Global LNG Spot Price Tracker
Weekly Report | Week 38, 2026 (14–18 September 2026)


Weekly Report | Week 38, 2026 (14–18 September 2026)
Epignosis Insights' Global LNG Spot Price Tracker for Week 38 of 2026 finds a market that remains structurally tight but has begun to price in the possibility of diplomatic relief in the Middle East. Asia's benchmark Japan Korea Marker (JKM) held in the high-US$20s per million British thermal units (MMBtu) through the week, closing at US$27.51/MMBtu on the newly prompt November contract. That is roughly US$1/MMBtu below the two-and-a-half-year spot high reached on 10–11 September, when escalating US–Iran tensions and aggressive South Asian buying pushed prices into the high-US$28s. Europe's Dutch Title Transfer Facility (TTF) was more volatile, opening the week at €82.57 per megawatt-hour (MWh) before sliding to €76.35/MWh mid-week and recovering to €79.52/MWh by Friday.
The defining feature of the week was convergence. With JKM and TTF trading within about US$0.50/MMBtu of each other, Asia and Europe are competing directly for the same flexible cargoes ahead of winter, and neither region has a clear pricing advantage. Our analysis indicates that this parity reflects two offsetting forces: Europe's storage deficit keeps TTF bid, while price-sensitive Asian buyers have started to step back at current levels. Meanwhile, the US Henry Hub benchmark remained anchored below US$3/MMBtu for most of the week, leaving an exceptionally wide margin for US exporters.
Settlement data from CME Group shows that the continuous JKM front-month contract moved from US$25.06/MMBtu on 14 September to US$27.51/MMBtu on 18 September. Much of that apparent jump reflects the contract roll on 16 September, when the prompt month shifted from October, whose settlement was already largely fixed by past assessments, to November, which trades on live expectations. On a like-for-like basis, the November contract averaged US$27.16/MMBtu over the final three sessions of the week, fell to US$26.75/MMBtu on 17 September on reports of diplomatic contacts involving Iran, and then rebounded 2.8% on 18 September as shipping risk through the Strait of Hormuz resurfaced.
TTF told a similar story in euro terms. The front-month contract averaged €79.31/MWh across the week, 1.6% above the €78.09/MWh average of Week 37, while the Friday close was essentially unchanged week-on-week. The intra-week trough of €76.35/MWh on 17 September reflected profit-taking after a four-week rally. Henry Hub closed the week near US$2.87/MMBtu, up about 2.5% from US$2.80/MMBtu a week earlier, supported by late-season heat in the southern United States.
Table 1: Weekly LNG and Gas Benchmark Snapshot
| Indicator | Week 38 (14–18 Sep) | Week 37 (7–11 Sep) | Change |
| JKM, week-end close (US$/MMBtu) | 27.51 (Nov) | ~28.5 (spot) | ≈ −3.5% |
| JKM Nov contract, 16–18 Sep average (US$/MMBtu) | 27.16 | - | - |
| TTF, weekly average (€/MWh) | 79.31 | 78.09 | +1.6% |
| TTF, week-end close (€/MWh) | 79.52 | 79.52 | 0.0% |
| TTF, week-end close (US$/MMBtu equiv.) | 27.00 | 27.00 | 0.0% |
| Henry Hub, week-end (US$/MMBtu) | ~2.87 | ~2.80 | ≈ +2.5% |
| JKM–TTF spread (US$/MMBtu) | 0.51 | 1.50 | −0.99 |
| JKM–Henry Hub spread (US$/MMBtu) | 24.64 | 25.70 | −1.06 |
Source: Epignosis Insights analysis of exchange settlements and agency spot commentary. JKM changes span the October-to-November contract roll and are indicative.
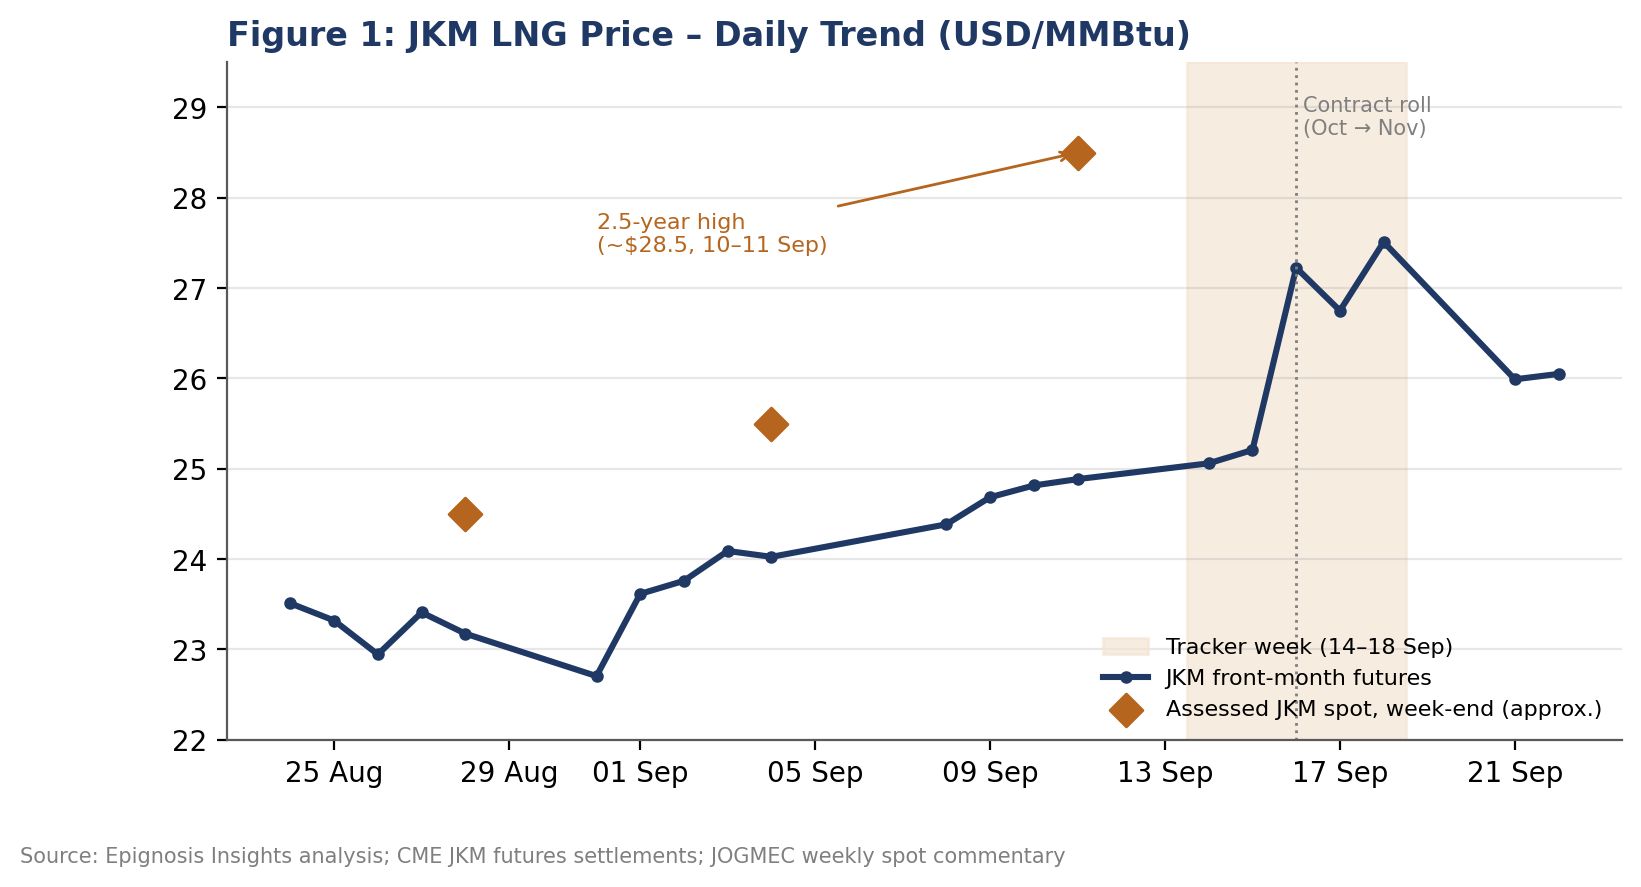
Figure 1: JKM front-month futures and assessed week-end spot levels, late August to 22 September 2026.
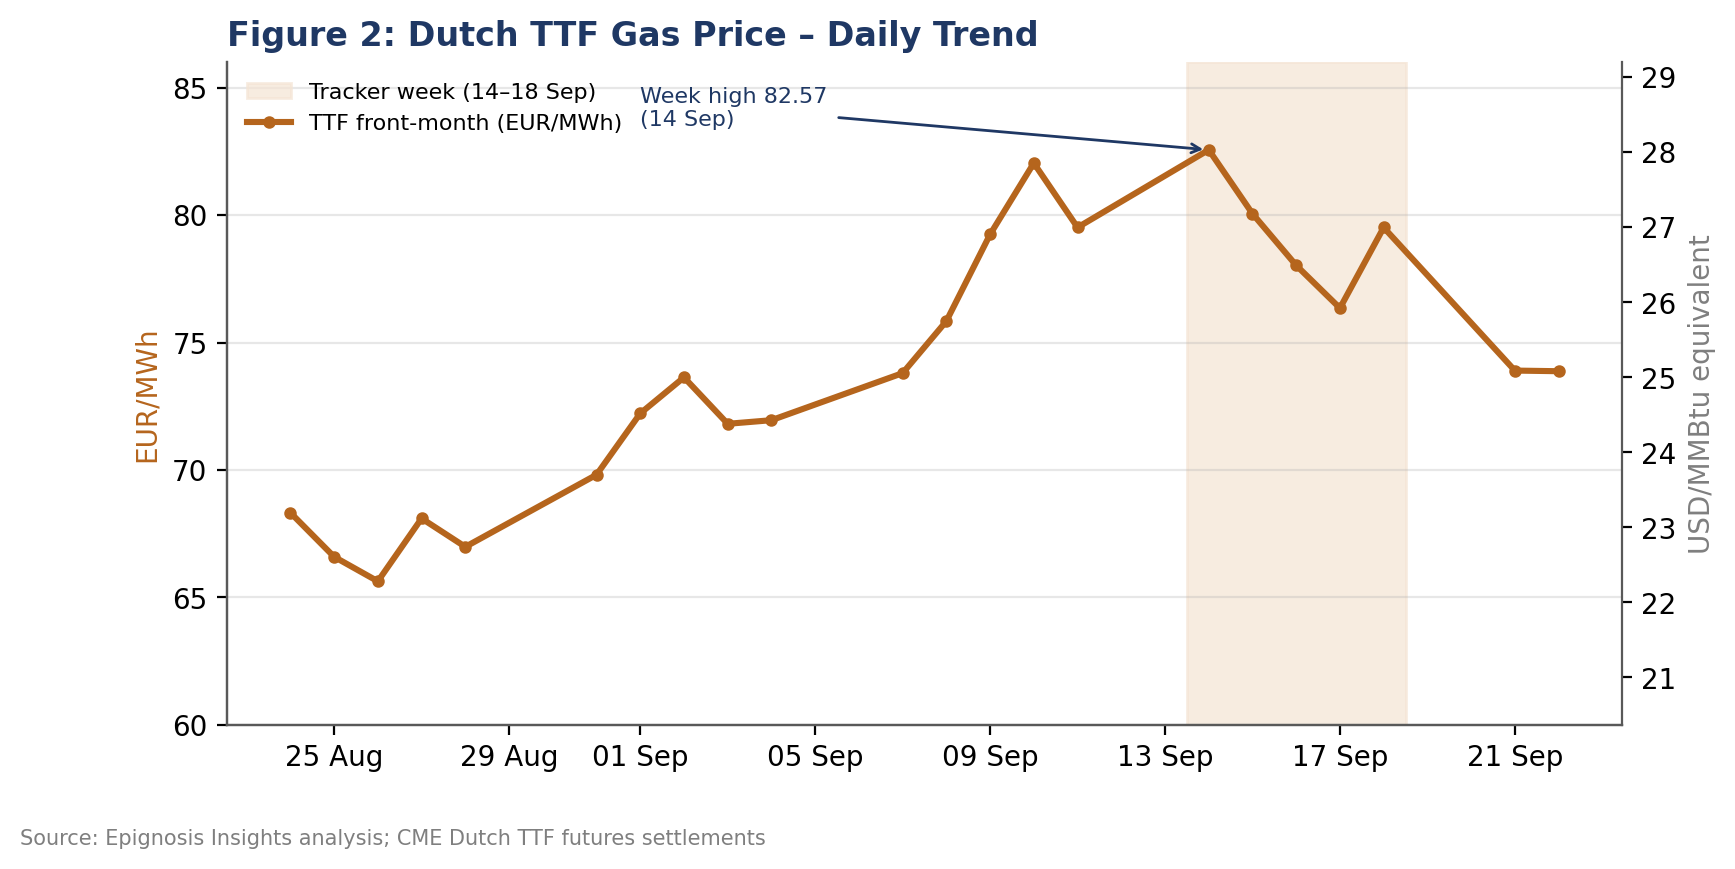
Figure 2: Dutch TTF front-month prices in EUR/MWh with USD/MMBtu equivalent, late August to 22 September 2026.
Placing the week in a longer frame shows how far LNG prices have travelled. The continuous JKM futures contract has traded in a 52-week range of roughly US$9.5 to US$27.5/MMBtu, meaning current levels sit close to the top of the range and nearly three times the lows. The path has not been linear: prices spiked after the March strikes on Ras Laffan, corrected into early summer as deferred cargoes arrived and emergency buying faded, and then rallied again from late August as winter positioning began. Since 24 August alone, the JKM front-month has gained about 17% and TTF about 16%.
Epignosis Insights notes that this third leg of the rally differs from the spring spike. It is driven less by panic buying and more by a measurable seasonal gap: Europe needs to refill storage, Asia needs to secure winter cover, and the incremental supply that the market had expected from Qatar in 2026 is not arriving. This makes the current price level more durable than the spring highs, even if headline-driven volatility remains high.
Japan's energy security agency JOGMEC reported that assessed spot JKM for October delivery climbed from the mid-US$25s to the mid-US$28s/MMBtu during Week 37, touching its highest level in about two and a half years on 10 September. The agency attributed the rally to rising geopolitical risk premiums, the closed arbitrage for US cargoes to Asia and strong spot procurement by South Asian buyers. It also noted that Japanese utilities held 2.43 million tonnes of LNG for power generation as of 6 September, a modest weekly increase that suggests Northeast Asian buyers are not facing an immediate shortage.
Epignosis Insights' reading is that Week 38 marked a pause rather than a reversal. Northeast Asian utilities appear comfortable with current inventory cover and have become more selective at prices above US$27/MMBtu, while South and Southeast Asian buyers, who are far more price-sensitive, are likely to defer discretionary cargoes. This demand elasticity is the main reason JKM has not broken decisively above US$29/MMBtu despite the severity of the supply shock.
Europe enters the heating season in a notably weaker position than in recent years. Data from Gas Infrastructure Europe's AGSI+ transparency platform showed EU-wide underground storage at 67.8% on 11 September, up only 1.4 percentage points from a week earlier and well short of the 80% refill benchmark. At the current injection pace, Epignosis Insights estimates that Europe will need to attract an above-normal share of Atlantic Basin LNG through October simply to reach the mid-70s by the start of November.
Market commentary from Trading Economics noted that European gas prices have nearly tripled so far this year and reached their highest level since December 2022 earlier in September. Unplanned maintenance at Norwegian gas facilities and low wind generation have added to the pressure. Our view is that TTF will remain the marginal price-setter for spot LNG through the autumn, because Europe has less room than Asia to reduce consumption when prices rise.
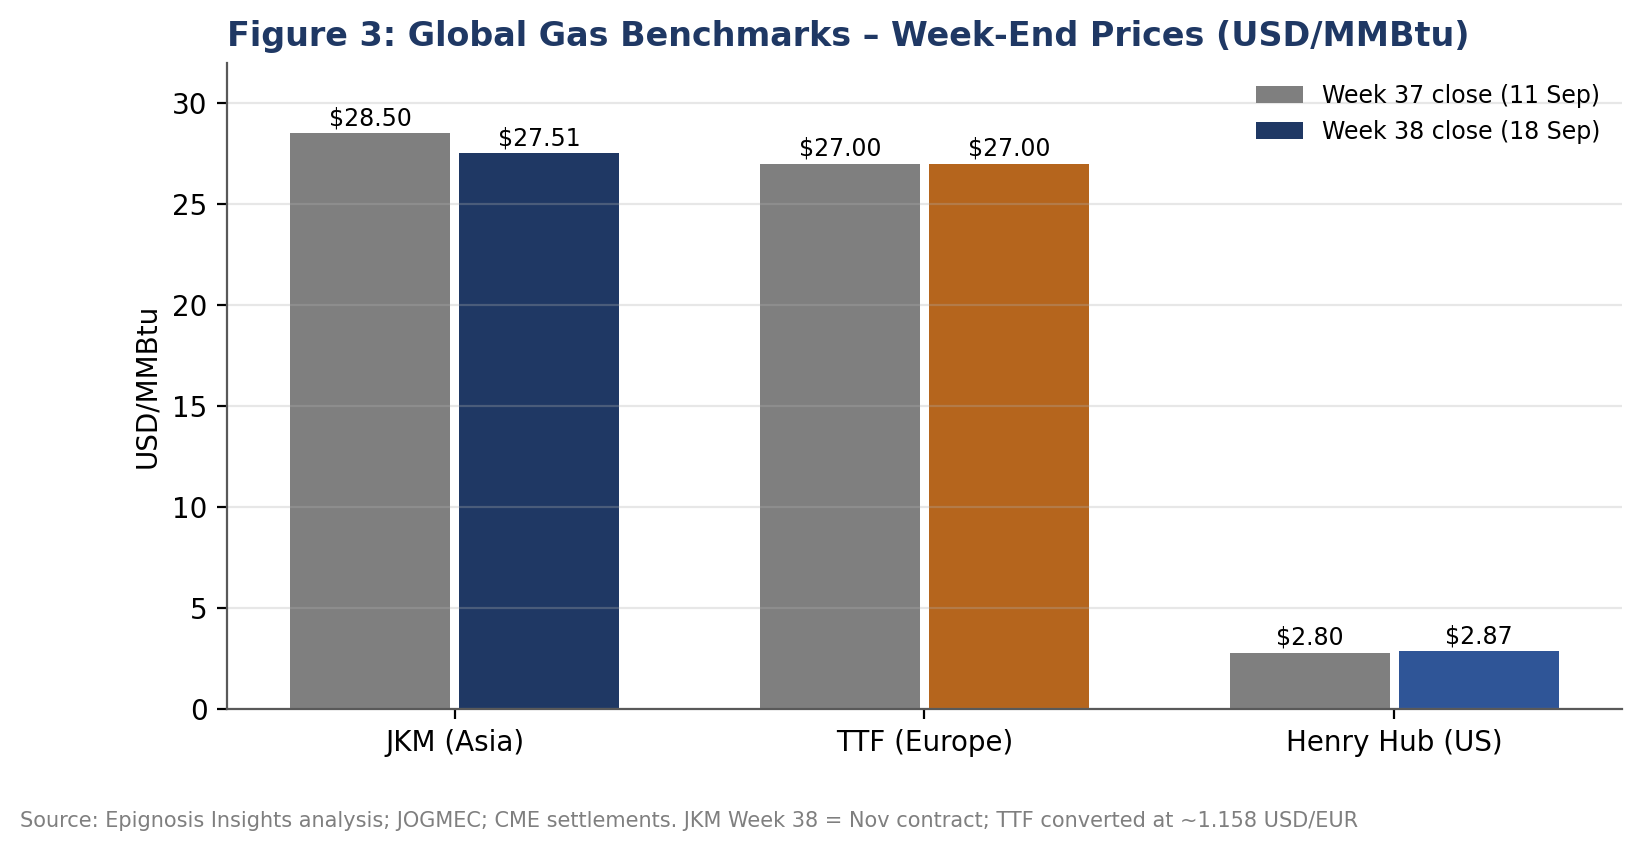
Figure 3: Week-end prices for JKM, TTF and Henry Hub, Week 37 versus Week 38.
The United States remains the swing supplier of flexible LNG. Cheniere Energy's second-quarter 2026 results showed 184 cargoes exported in the quarter, and the company tightened its full-year production forecast upward to 53–54 million tonnes. Cheniere's management told investors that constraints in the Strait of Hormuz reduced Middle East LNG supply by roughly 18 million tonnes during the quarter, and that Europe's storage deficit versus the previous year equated to about 11 billion cubic metres, or roughly 100 cargoes.
Domestically, the US Energy Information Administration (EIA) reported a 44 Bcf storage injection for the week ended 11 September, below the five-year average of 74 Bcf, lifting working gas inventories to 3,298 Bcf, or 3.7% above the five-year average. This comfortable inventory position explains why Henry Hub has stayed below US$3/MMBtu while international prices trade near US$27/MMBtu. The resulting spread of more than US$24/MMBtu between JKM and Henry Hub implies exceptional margins for uncontracted US volumes, even after shipping and liquefaction costs.
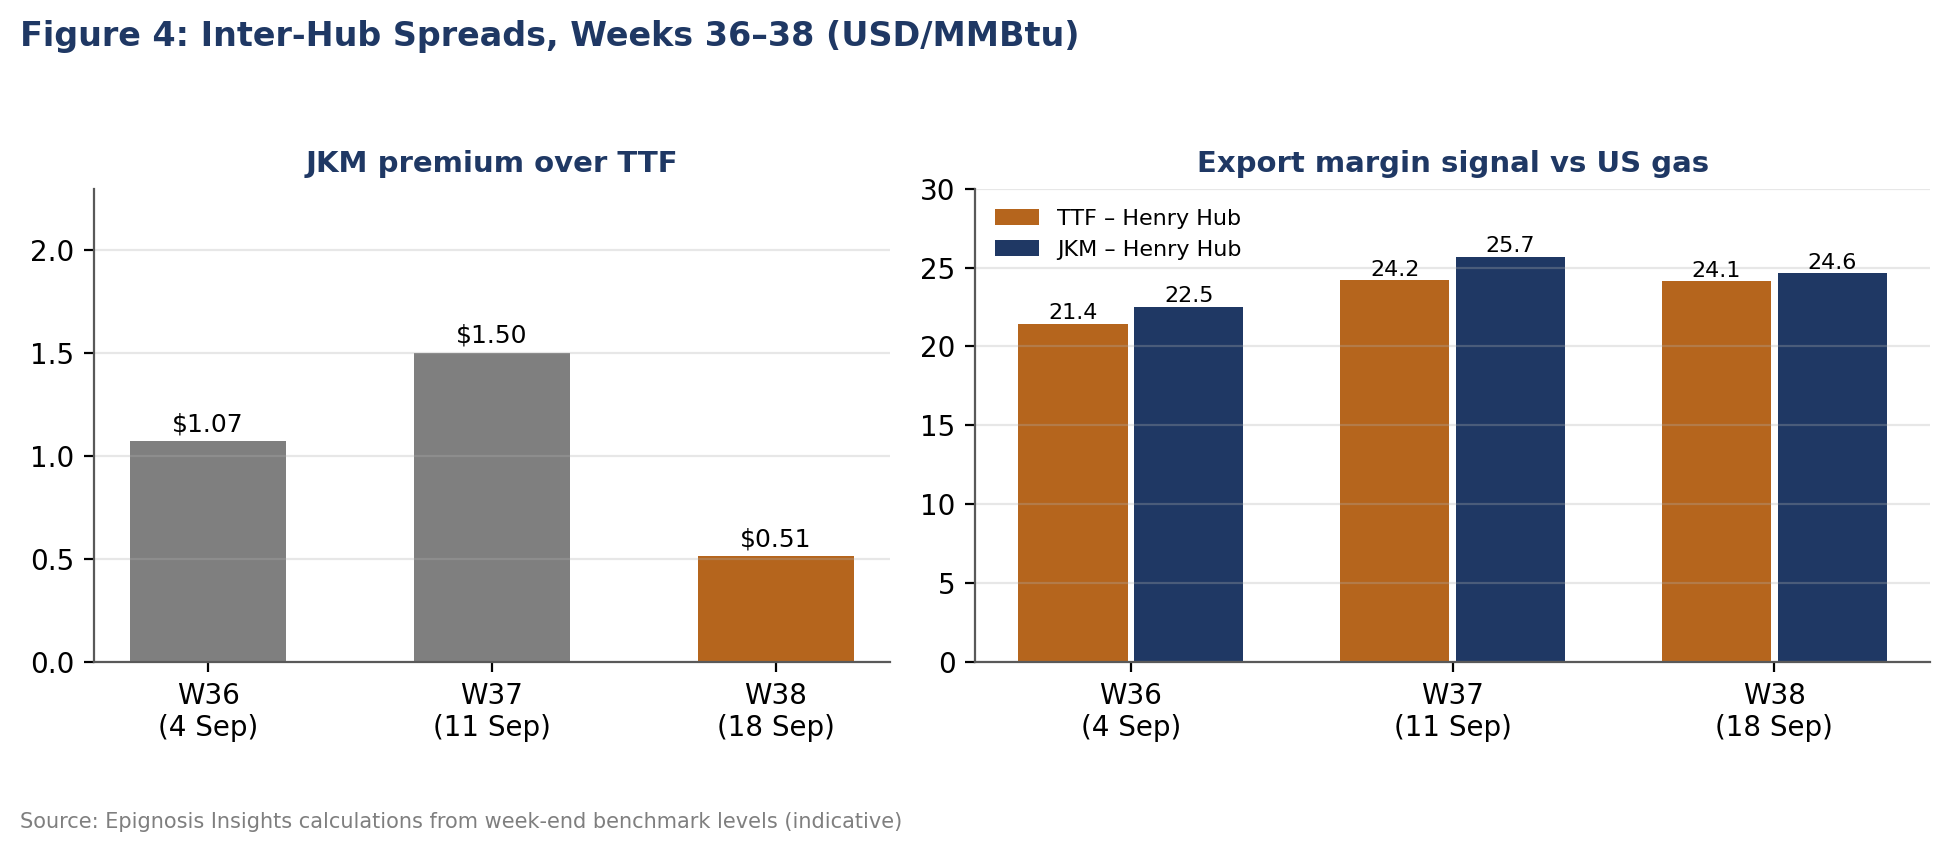
Figure 4: JKM-TTF, TTF-Henry Hub and JKM-Henry Hub spreads based on week-end levels, Weeks 36–38.
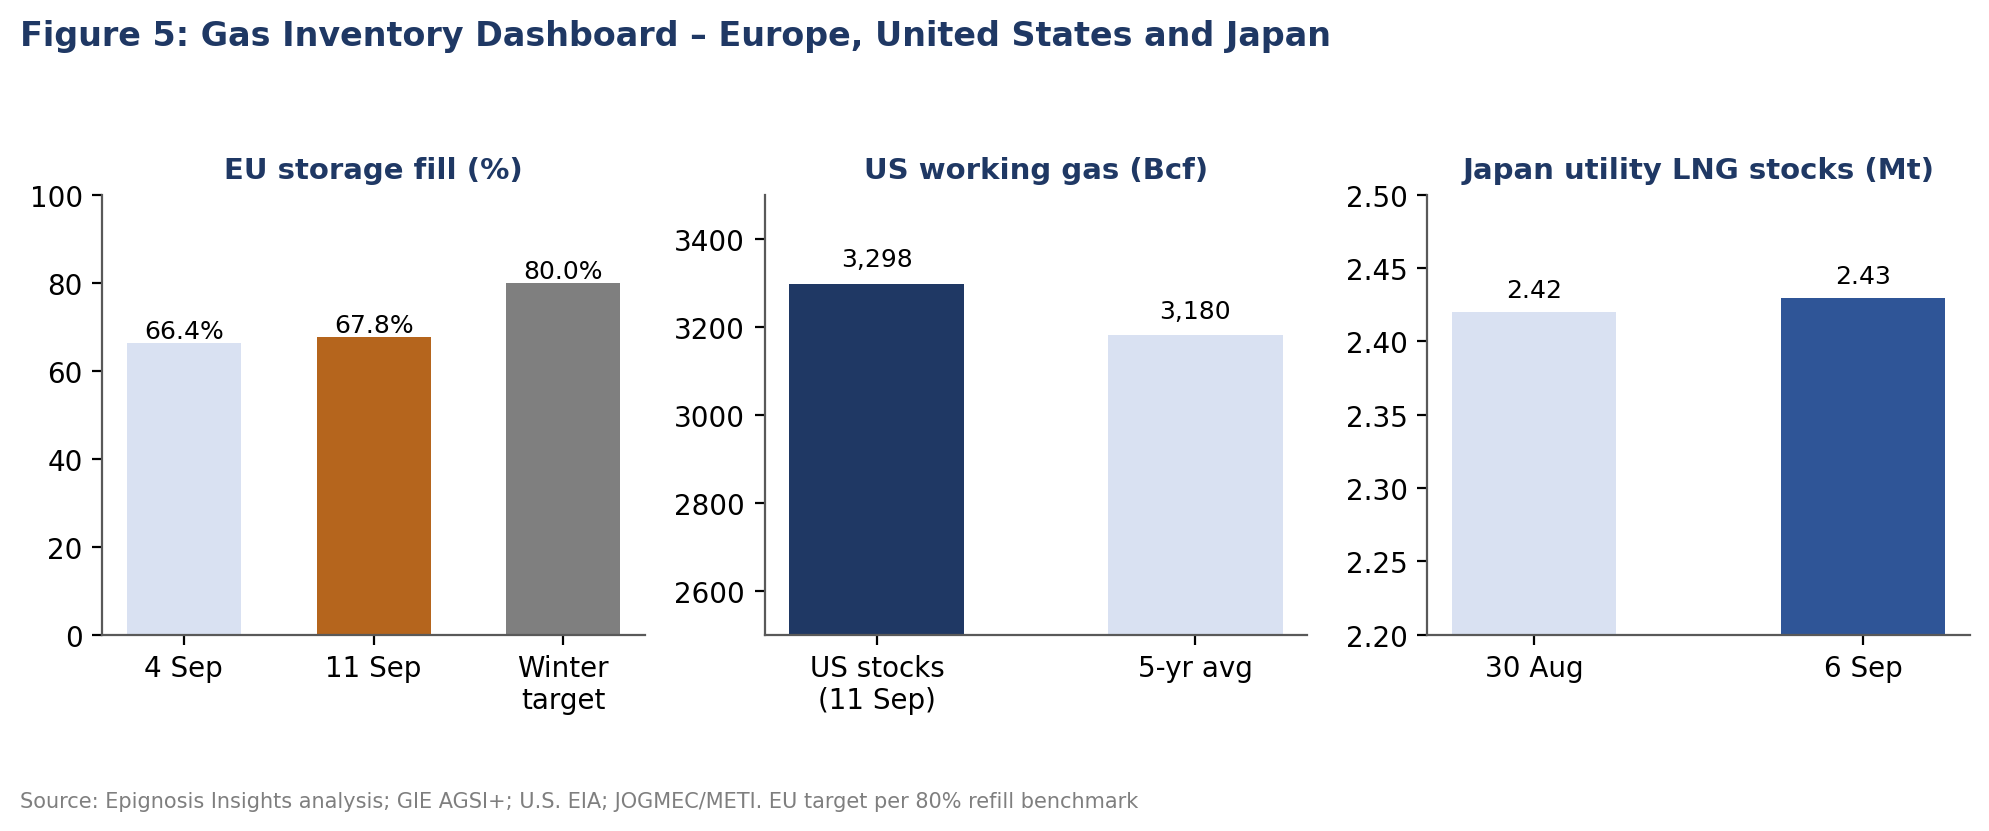
Figure 5: Gas inventory indicators for Europe, the United States and Japan.
The single largest factor behind 2026's elevated LNG prices remains the damage to Qatar's export infrastructure. QatarEnergy has stated that Iranian strikes damaged two of its 14 export trains, removing 12.8 million tonnes per annum of capacity, roughly 17% of the country's total, with repairs expected to take three to five years. Consulting firm Energy Aspects forecasts Qatari LNG exports of 38.7 million tonnes in 2026, roughly half of pre-conflict capacity, and argues that the binding constraint is transit through Hormuz rather than liquefaction itself.
Reporting by The National this month highlighted that even a full reopening of the strait would not immediately normalise Gulf LNG flows, because war-risk insurance costs and security concerns continue to slow the return of LNG carriers. The International Energy Forum has also noted that global spare liquefaction capacity fell about 14 billion cubic metres short of the LNG volumes that moved through Hormuz in 2025, leaving buyers with a thin buffer. Epignosis Insights therefore treats any diplomatic progress as a sentiment catalyst that can compress risk premiums quickly, but not as a fix for the underlying supply deficit.
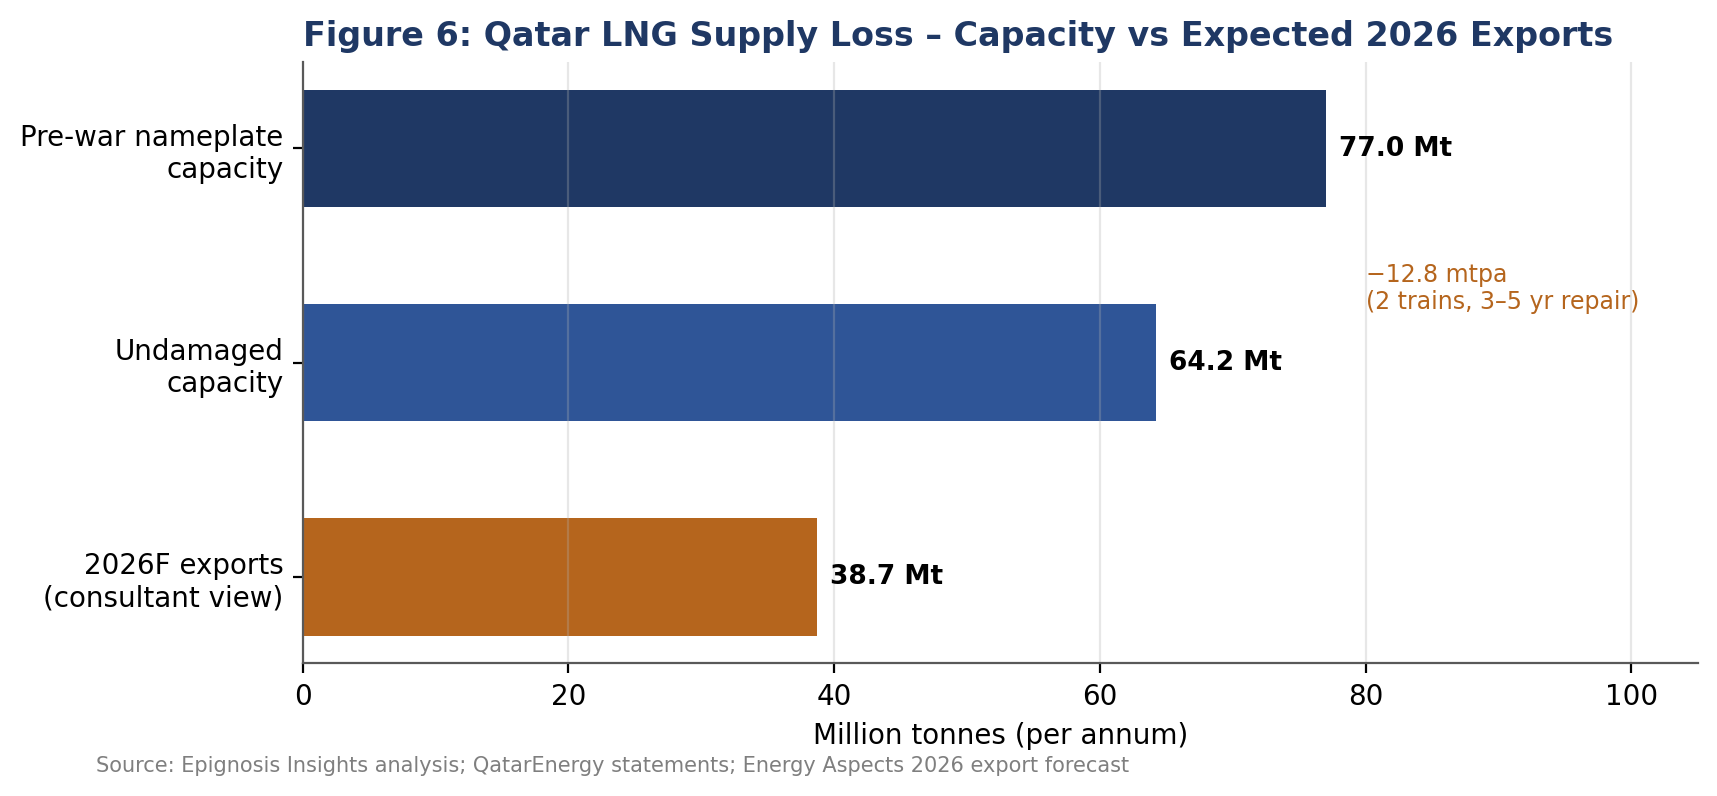
Figure 6: Qatar's pre-war LNG capacity, undamaged capacity and expected 2026 exports.
The JKM premium over TTF narrowed to about US$0.51/MMBtu at the end of Week 38 from US$1.50/MMBtu a week earlier. A spread this narrow is insufficient to cover the additional shipping cost of sending US Gulf Coast cargoes to Asia via the Cape of Good Hope, so the bulk of US output continues to flow to Europe. For Asian buyers this means reliance on Pacific Basin supply from Australia, Southeast Asia and North America's west coast. Should the spread widen back above US$2/MMBtu, Epignosis Insights would expect a rapid redirection of flexible Atlantic cargoes eastward, which would tighten Europe further.
The regional implications differ sharply. For South Asian importers such as India, Pakistan and Bangladesh, spot prices near US$27/MMBtu are well above the level at which gas-fired power and fertiliser production remain economic, so Epignosis Insights expects demand switching to coal, liquid fuels or curtailment rather than sustained spot buying. Chinese buyers, who hold substantial long-term contract cover and domestic production, are likely to resell surplus cargoes into the tight market where contracts allow. Japanese and Korean utilities, by contrast, are likely to keep buying selectively because energy security takes priority over cost for them.
Figure 7 summarises how Epignosis Insights weighs current market drivers. Bullish forces, led by Hormuz transit constraints, lost Qatari capacity and Europe's storage deficit, continue to outweigh bearish forces such as diplomatic contacts with Iran, record US output and demand destruction among price-sensitive buyers. The net bias is for elevated but volatile prices, with headline risk dominating day-to-day moves.
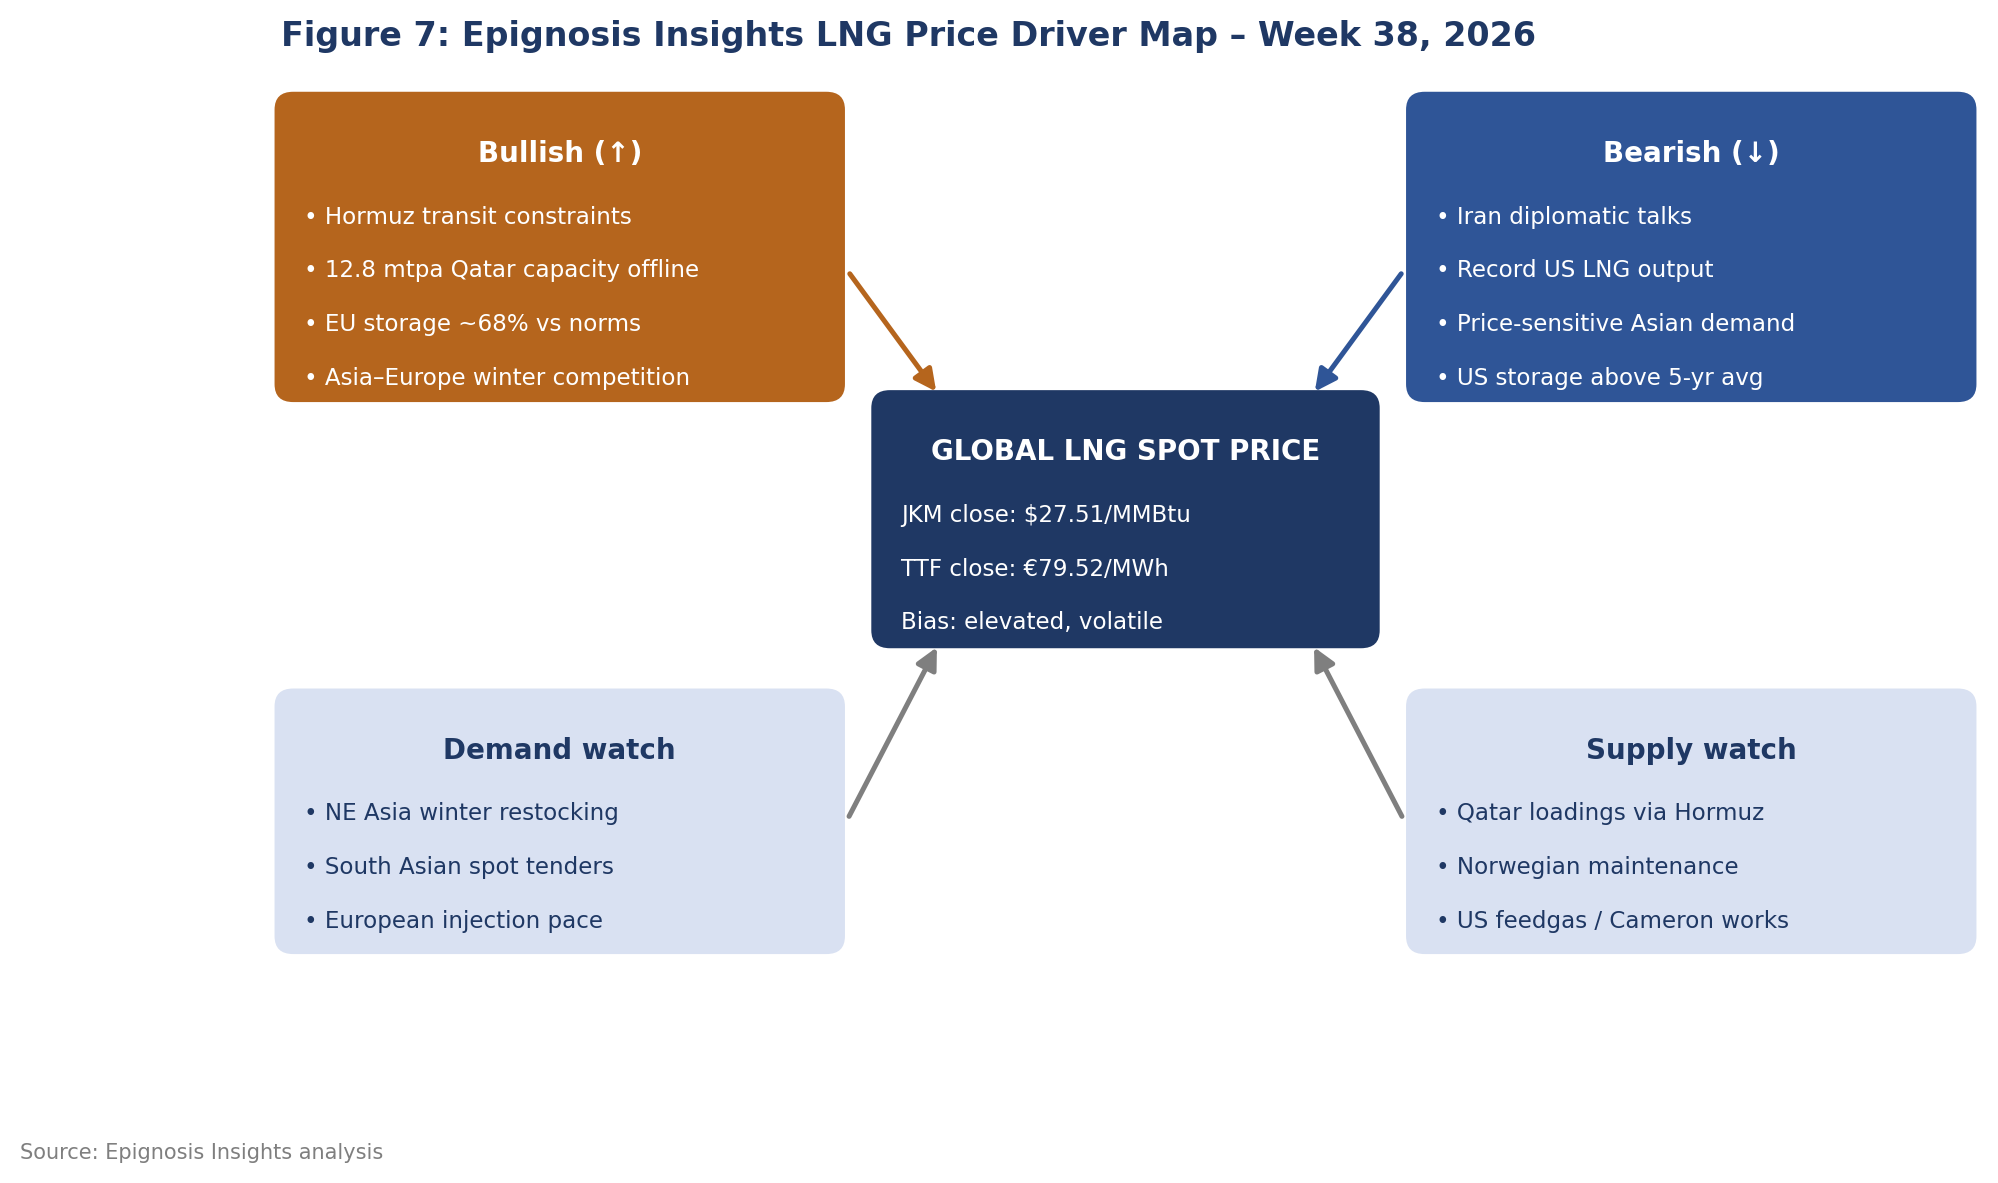
Figure 7: Epignosis Insights LNG price driver map for Week 38, 2026.
Trading at the start of Week 39 underlined how sensitive prices are to diplomatic headlines. The JKM front-month fell 5.5% to US$25.99/MMBtu on 21 September and TTF dropped 7.1% to €73.90/MWh, as markets weighed the prospect of US–Iran contacts around the UN General Assembly. Henry Hub moved in the opposite direction, rising above US$3.1/MMBtu on 22 September on tighter storage expectations and early heating-demand signals. Epignosis Insights views the international sell-off as a partial unwinding of risk premium rather than a change in the physical balance.
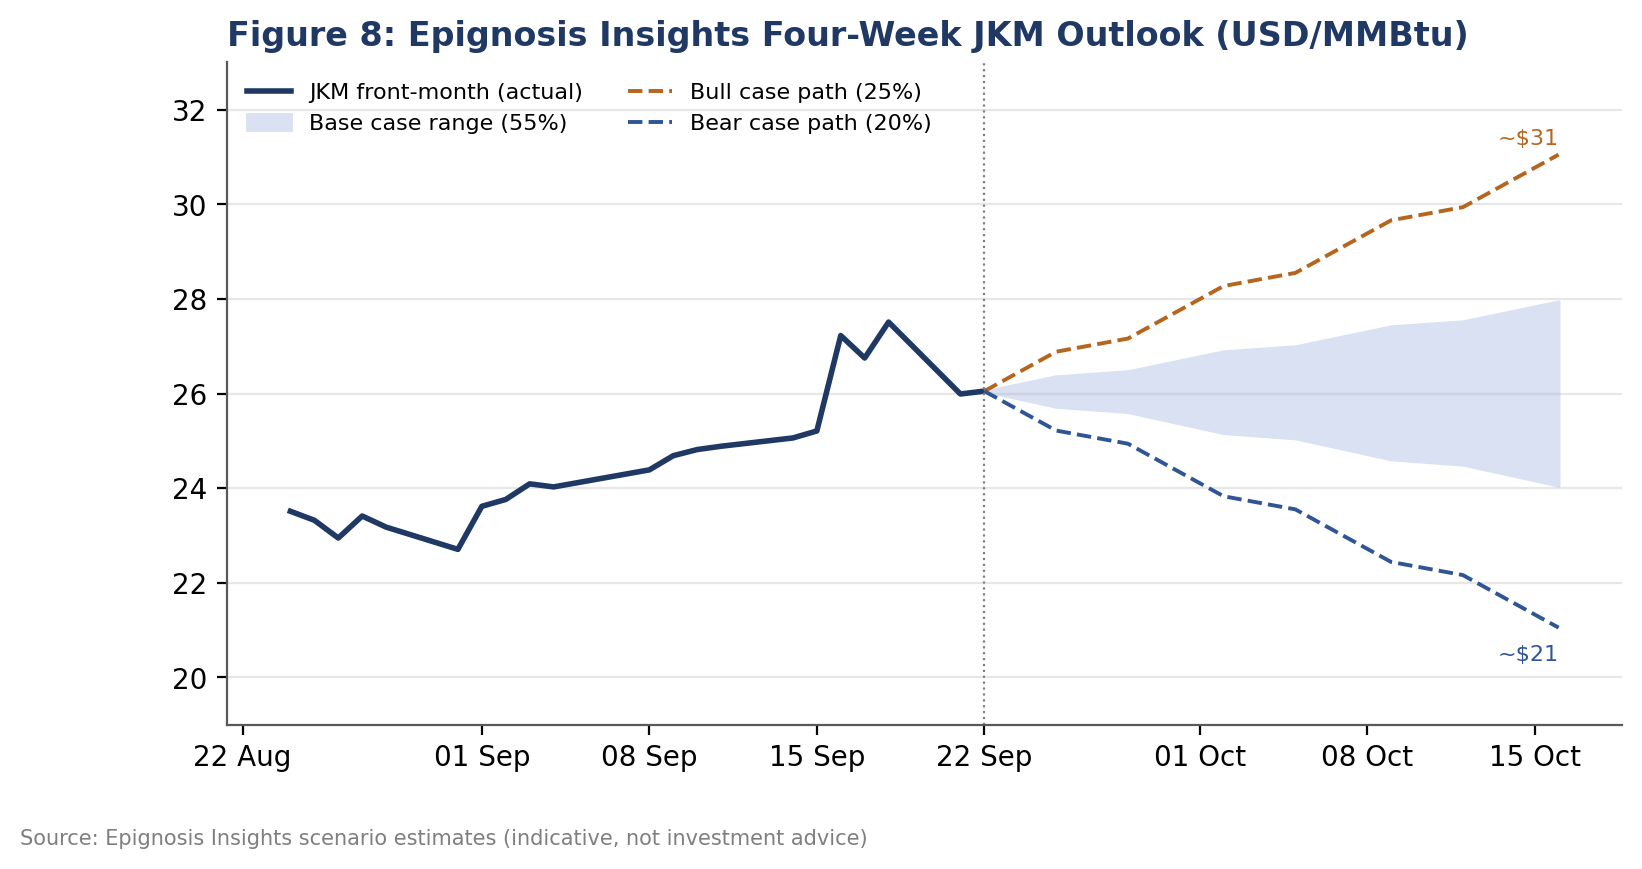
Epignosis Insights' base case, assigned a 55% probability, is that JKM trades between US$24 and US$28/MMBtu through mid-October, with TTF broadly in a €68–82/MWh range. In this scenario, Hormuz transit remains restricted but stable, European injections continue at a below-normal pace and Asian demand stays price-disciplined. Our bull case (25%) sees JKM rising towards US$31/MMBtu if shipping disruptions intensify, Norwegian outages extend or an early cold spell hits Northeast Asia or Europe. The bear case (20%) sees JKM easing towards US$21/MMBtu if credible de-escalation allows a faster recovery in Qatari loadings.
For LNG buyers, we recommend spreading winter procurement across October and November rather than concentrating purchases in a single window, and prioritising contract flexibility over headline price. For portfolio players and traders, the key indicators to monitor are Hormuz transit counts, EU weekly injection rates, the JKM–TTF spread and US feedgas volumes.