US Asphalt Price Tracker
Monthly Report — September 2026 | Liquid Binder & Hot-Mix Pricing, Regional Analysis and Outlook Across the US


Monthly Report — September 2026 | Liquid Binder & Hot-Mix Pricing, Regional Analysis and Outlook Across the US
US Liquid Asphalt Binder Prices climbed for a sixth consecutive month through September 2026, with the Epignosis Insights National Asphalt Binder Composite reaching an estimated $698 per ton — up roughly 30% from $538 per ton in January. The Epignosis Insights US Asphalt Price Tracker, which benchmarks monthly liquid binder and finished hot-mix asphalt (HMA) pricing across US regions, finds this year's climb sharper and earlier than the typical spring paving-season run-up, driven by a combination of refinery feedstock costs, tightening heavy-crude supply, and construction-season demand converging in the second quarter.
This report consolidates Epignosis Insights' proprietary monthly tracker with data drawn from the US Bureau of Labor Statistics producer price index program, the National Asphalt Pavement Association (NAPA), HF Sinclair's 2026 investor disclosures, a global energy consultancy's asphalt supply chain analysis prepared for the Asphalt Institute Foundation, and Engineering News-Record's long-running construction materials price series. State transportation department indices show the regional pattern clearly: Oklahoma's Midwest/Mid-Continent benchmark jumped from $495 to $572.50 per ton between April and May, while Vermont's index climbed from $638 to $793 per ton between March and June — both consistent with the national composite's steep second-quarter acceleration.
Asphalt sits at the intersection of two markets that rarely move in the same direction for long: crude oil refining economics and US infrastructure spending. The US Bureau of Labor Statistics' producer price index for asphalt paving mixtures and blocks (series WPU139401) reached 431.026 in July 2026, up 6.6% over the prior year and up 34.4% over five years — a pace of increase well ahead of headline consumer inflation and a signal that this year's move is not merely a seasonal blip. NAPA, the industry's national trade association, notes that 94% of US roadways are surfaced with asphalt and that the paving supply chain, from production through construction, supports roughly 4 million direct jobs and 63 million jobs across adjacent sectors — a scale that makes binder cost movements a material line item across thousands of public infrastructure budgets simultaneously.
The 2021 Infrastructure Investment and Jobs Act continues to underpin structural demand: its roughly $550 billion in road, bridge and transit funding has kept state DOT paving programs active even as binder costs have risen, leaving agencies with limited ability to defer projects the way a private-sector buyer might. That combination — inelastic public-sector demand meeting a feedstock-driven cost increase — is a central reason this year's price run has proven more durable than prior seasonal spikes.
The Epignosis Insights tracker follows monthly US liquid asphalt binder pricing (dollars per ton, PG 64-22 equivalent) as a national composite, benchmarked against a panel of state DOT asphalt price indices and Poten& Partners' Asphalt Weekly Monitor reporting, alongside a separate national average for finished hot-mix asphalt (HMA) at the plant gate. The national composite is an Epignosis Insights desk estimate; individual state DOT indices, which vary by refining hub proximity and specification, are tracked as reference points rather than averaged directly, given the meaningful regional spread this report documents below.
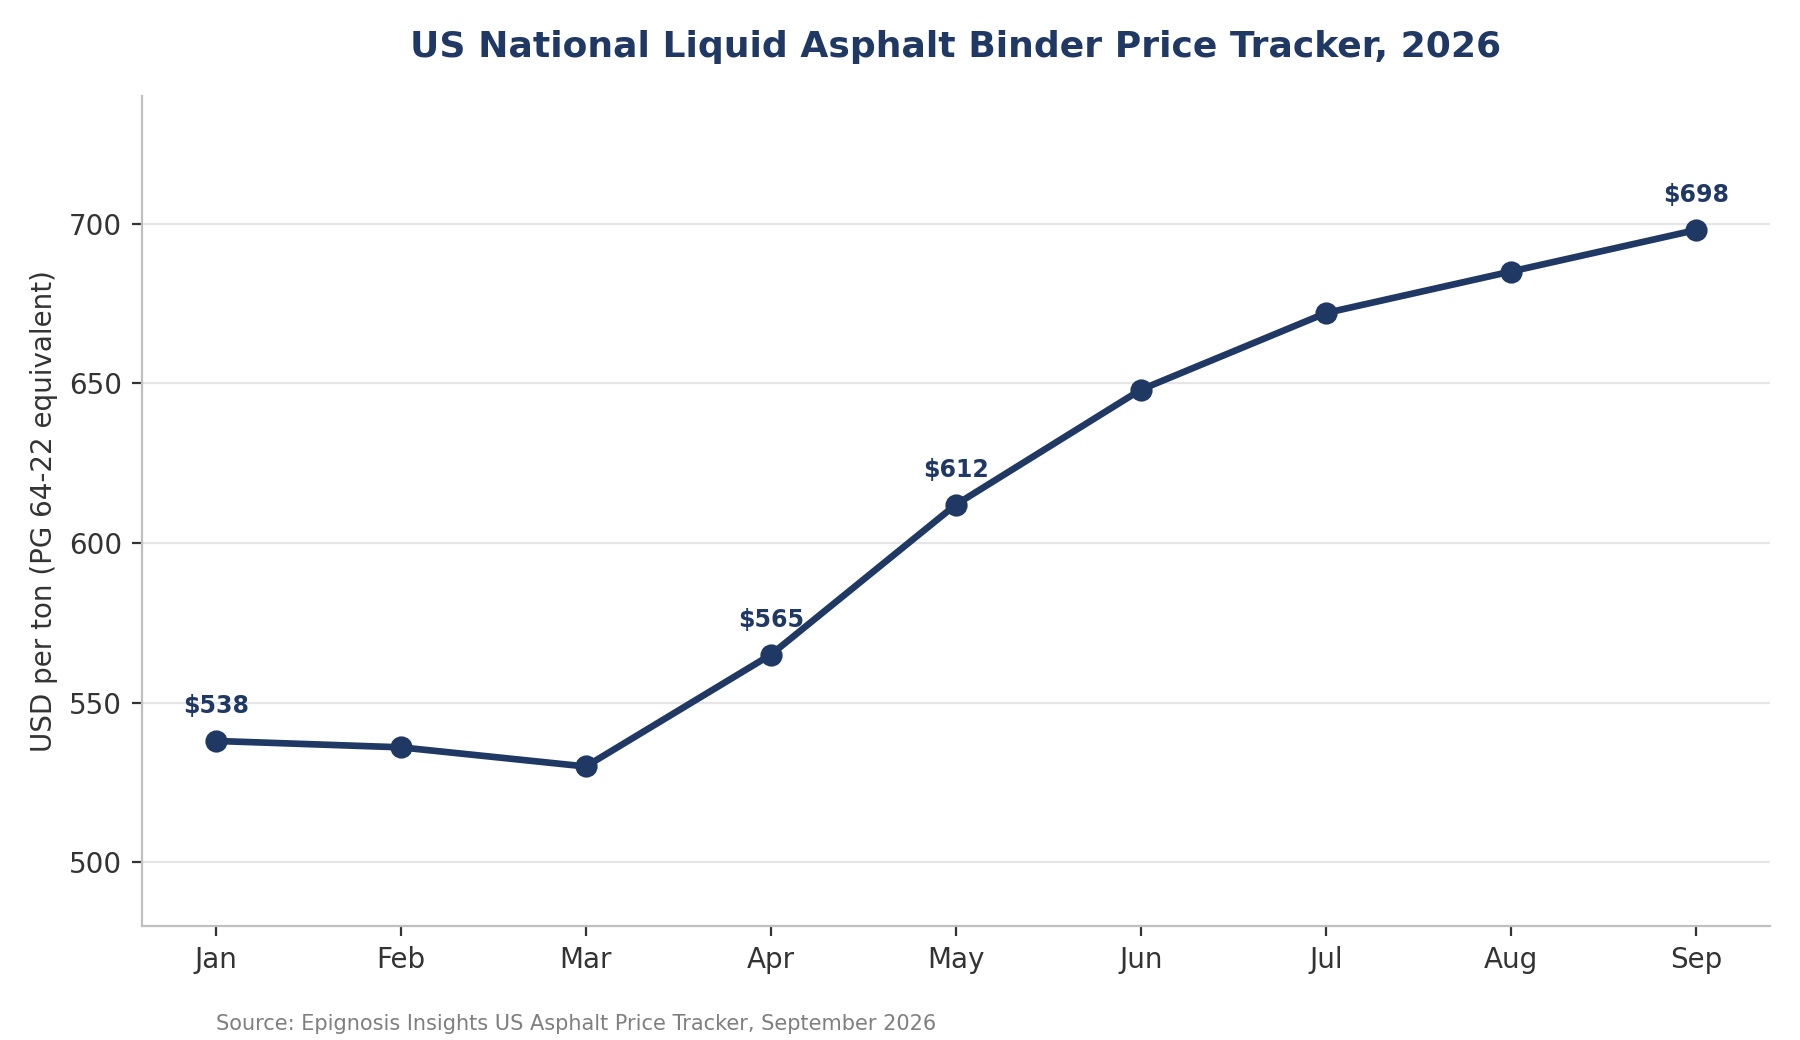
Figure 1. US National Liquid Asphalt Binder Price Tracker, 2026. Source: Epignosis Insights US Asphalt Price Tracker.
The composite rose from $538 per ton in January to $698 per ton in September, with the steepest single-month gains falling in April and May as paving-season demand met higher feedstock costs simultaneously. Oklahoma's Tulsa/Southern Kansas benchmark — one of the most widely cited Midwest/Mid-Continent reference prices for PG 64-22 binder — held at $495 per ton in March and April before jumping to $572.50 in May, a 15.7% single-month increase. Vermont's statewide index moved even further, from $638 per ton in March to $793 per ton by June, a 24.3% three-month gain, illustrating how much wider regional swings can run relative to the national composite.
Finished hot-mix asphalt, which blends liquid binder with aggregate and therefore moves less sharply than the binder price alone, is estimated to have risen from $112 per ton in January to $128 per ton by September — a national plant-gate average broadly consistent with independent industry benchmarking that places 2026 HMA pricing in the $115–125 per ton range nationally, with Gulf Coast and southern states typically at the lower end of that band.
Table 1. Monthly price tracker — binder composite & HMA (USD per ton)
| Month (2026) | Binder composite ($/ton) | HMA plant-gate ($/ton) | Binder MoM change |
| January | $538 | $112 | — |
| February | $536 | $113 | -0.4% |
| March | $530 | $114 | -1.1% |
| April | $565 | $117 | +6.6% |
| May | $612 | $121 | +8.3% |
| June | $648 | $124 | +5.9% |
| July | $672 | $126 | +3.7% |
| August | $685 | $127 | +1.9% |
| September | $698 | $128 | +1.9% |
Binder composite and HMA plant-gate figures are Epignosis Insights desk estimates, benchmarked against state DOT indices and industry reporting.
Regional spread is the defining feature of this year's tracker data. Maryland's asphalt index, maintained by the state's asphalt trade association, posted a prevailing monthly price of $807.50 per ton for September 2026 — well above both the Oklahoma Midwest benchmark and the Vermont Northeast index at their respective latest readings. That spread reflects a combination of refinery proximity, regional crude slate (heavier, more asphalt-yielding crudes are concentrated in specific refining hubs), freight distance from terminal to plant, and state-specific specification requirements that are not directly comparable across DOT indices. Buyers sourcing across multiple states should treat national or even regional averages as directional only and confirm current pricing against the specific state DOT index or supplier quote relevant to their project.
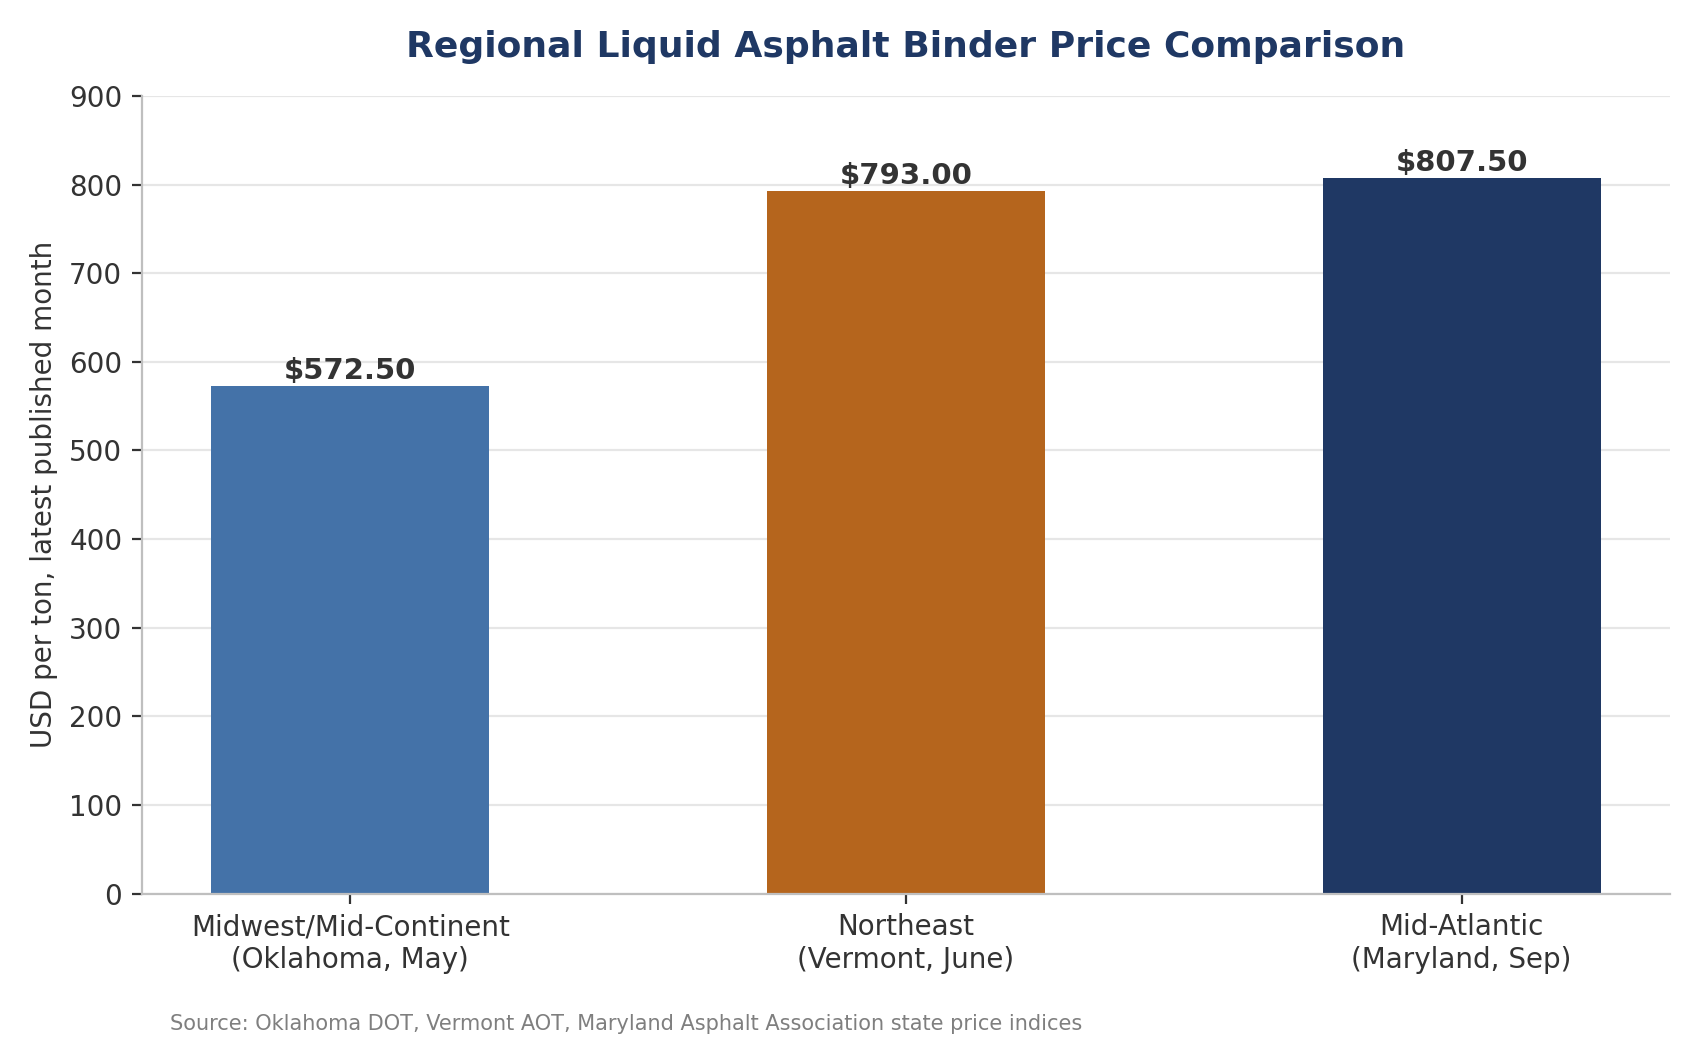
Figure 2. Regional liquid asphalt binder price comparison. Source: Oklahoma DOT, Vermont AOT, Maryland Asphalt Association.
Three forces explain the shape of this year's climb. First, asphalt is a byproduct of crude oil refining, specifically the heavier vacuum-residue fraction, so refiners' feedstock costs and crude slate decisions flow through to binder pricing within roughly 30 to 60 days — the fastest-moving driver of month-to-month changes. Second, refineries prioritize higher-margin light products (gasoline, diesel, jet fuel) over asphalt when margins on those products improve, meaning asphalt supply can tighten even when crude supply itself is adequate, simply because refiners are allocating heavy-crude throughput elsewhere. Third, ordinary construction-season demand — concentrated in the April-through-October paving window across most of the US — adds a predictable seasonal overlay on top of the feedstock-driven trend, which is why nearly every state DOT index in this report's panel shows its steepest gains in the April-to-June window.
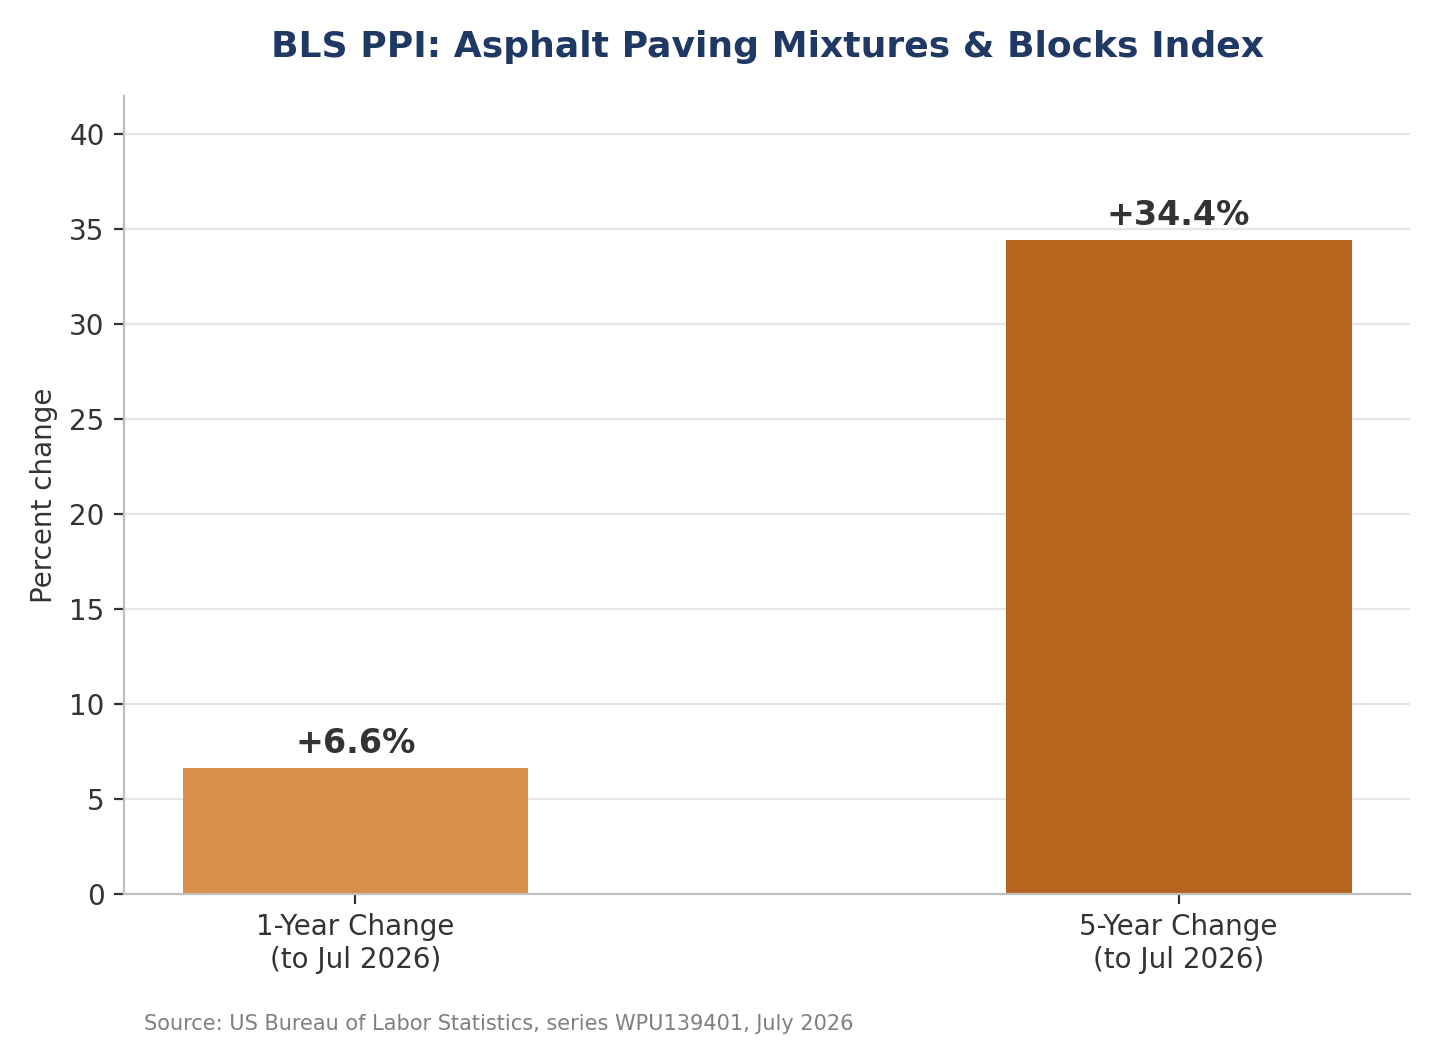
Figure 3. BLS PPI: Asphalt Paving Mixtures & Blocks Index. Source: US Bureau of Labor Statistics, series WPU139401.
HF Sinclair's 2026 investor disclosures offer a producer-side view of how asphalt fits into refiner economics. The company's Refining segment includes HF Sinclair Asphalt Company LLC, which operates terminals across Arizona, New Mexico and Oklahoma, and management highlighted its 'retail asphalt' and heavy-oil value chain as a contributor to improved margin capture in both Q1 and Q2 2026 earnings calls, tying the business explicitly to the company's ability to run heavier crude slates profitably. That framing is consistent with this report's driver analysis: asphalt economics for an integrated refiner are a function of heavy-crude processing strategy, not a standalone commodity decision, which is part of why supply can tighten even in periods of ample overall crude availability.
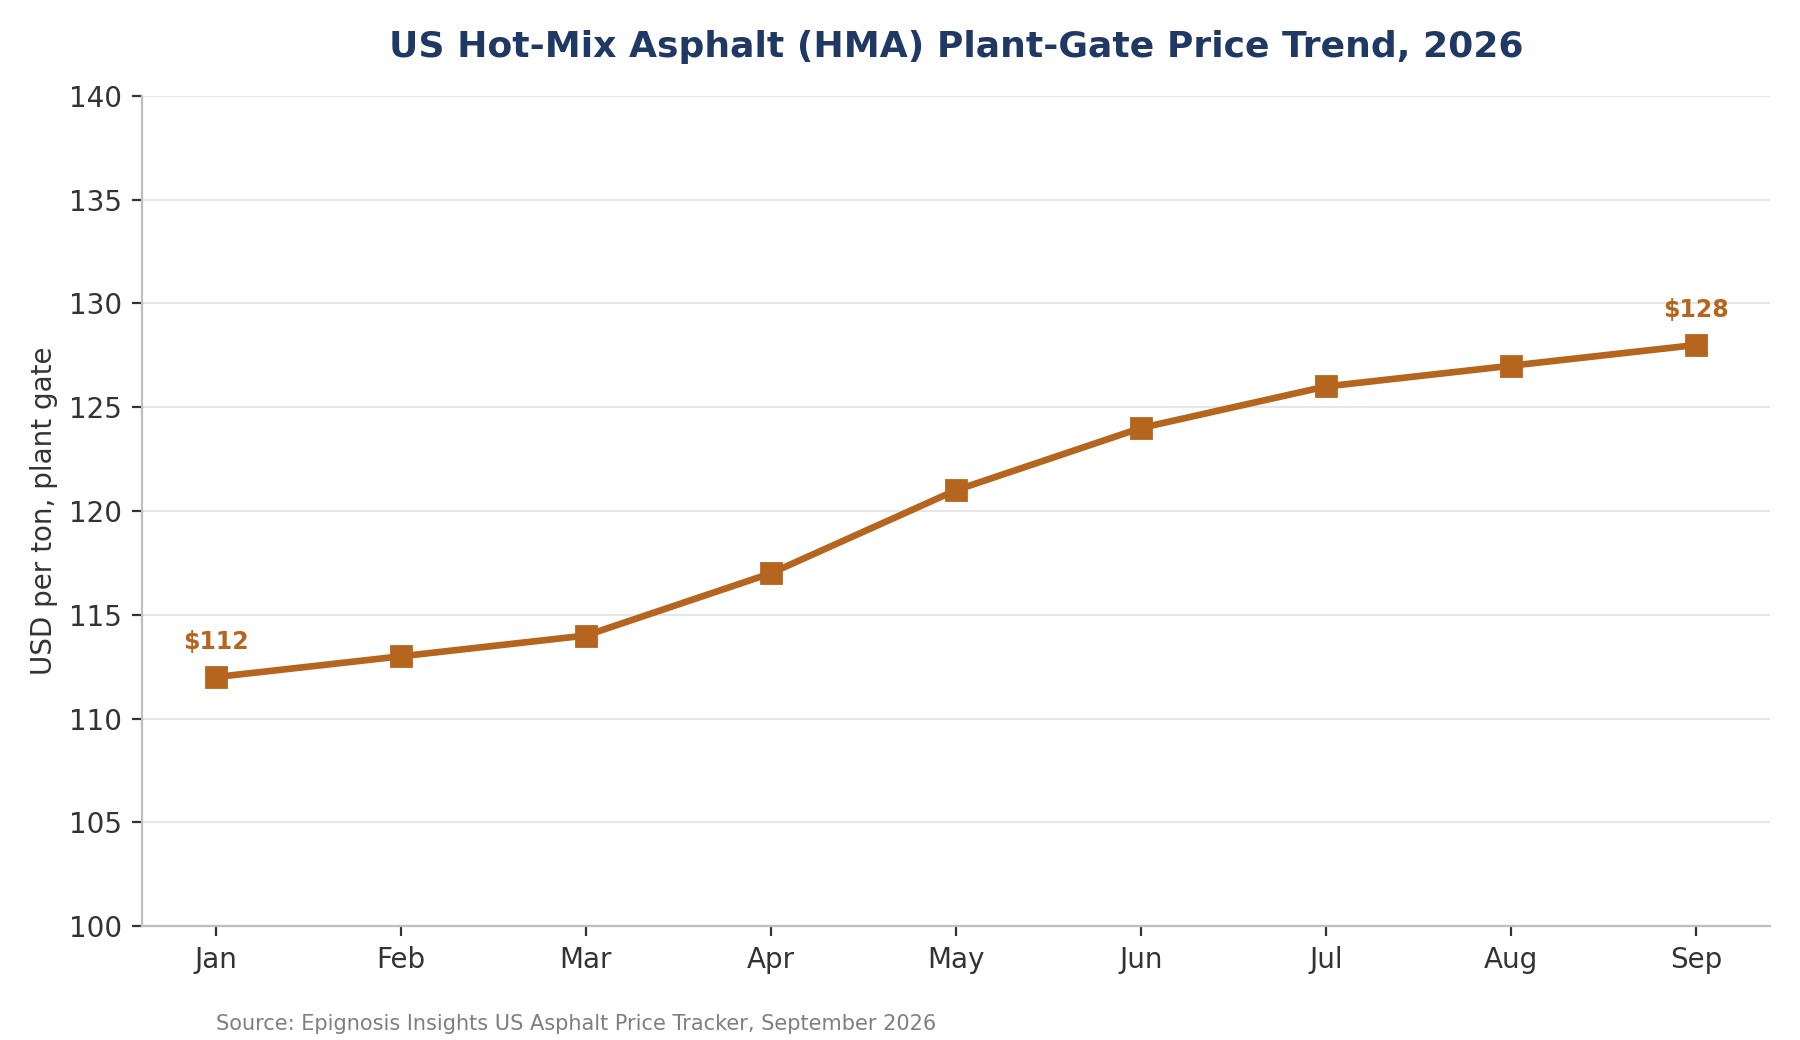
Figure 4. US hot-mix asphalt (HMA) plant-gate price trend, 2026. Source: Epignosis Insights US Asphalt Price Tracker.
A longer-running supply question sits beneath this year's monthly moves. Analysis prepared for the Asphalt Institute Foundation by a global energy consultancy examined the petroleum asphalt binder supply chain under various energy-transition scenarios and found that binder supply is structurally exposed to refinery configuration decisions made for reasons entirely unrelated to paving demand — as refiners invest in lighter-product yield and, in some cases, reduce heavy-crude processing capacity over the coming decade, asphalt-grade residue supply could tighten independent of paving demand trends. For state DOTs and paving contractors planning multi-year capital programs, that structural supply question is arguably a more consequential long-term risk than this year's cyclical price increase.
The tracker's near-term outlook points to a seasonal plateau or modest pullback into the fourth quarter as the paving season winds down in most northern and midwestern states, historically the pattern following a strong spring-summer run — Indiana's own binder index, for example, has shown a similar late-year softening in several recent years after summer peaks. However, the BLS PPI's 6.6% one-year and 34.4% five-year gains suggest the underlying cost trend is structurally higher than pre-2021 levels, and buyers should not expect a full retracement to prior-year pricing even after the seasonal peak passes. State DOTs and contractors locking in 2027 paving contracts should treat current elevated pricing as the likely floor for next year's spring season rather than a temporary peak.
Methodology: Pricing reflects Epignosis Insights' monthly desk-research tracker for September 2026, compiled from a national composite benchmarked against a panel of state DOT asphalt price indices (including Oklahoma, Vermont and Indiana) and industry reporting, cross-checked against publicly disclosed data from the US Bureau of Labor Statistics, NAPA, HF Sinclair's public disclosures, and Engineering News-Record. The national composite and HMA plant-gate series are Epignosis Insights desk estimates; individual state DOT figures cited are as published by the respective agencies. Figures are benchmark estimates for budgeting purposes; actual supplier quotations vary by region, grade, volume and delivery terms.