Copper Scrap Price Tracker
Week of 15–21 September 2026


Week of 15–21 September 2026
Global Copper Scrap Markets closed the week of 15–21 September 2026 on a firming note, with benchmark COMEX futures recovering from a mid-week dip to settle at $6.65 per pound on 21 September, up 0.47% on the day and 0.62% over the trailing month. The week's price action sits inside a much larger story: copper touched an all-time intraday high above $14,600 per tonne on the London Metal Exchange in early September before a sharp, tariff-driven reversal briefly knocked nearly 5% off COMEX futures in a single session. Scrap markets, which typically track refined copper with a lag and a discount, absorbed that volatility while remaining structurally tight, as buyers competing for feedstock across brass mills, wire-rod producers and secondary smelters continued to bid up No. 1 and No. 2 grades in most regional markets. Epignosis Insights' compiled tracker draws on government statistics, trade-association data, consultancy forecasts, primary company disclosures and wire-service reporting to give procurement and recycling teams a single, cross-checked view of where scrap pricing stands and why.
| Benchmark / Grade | Price | Weekly Change | Source |
| COMEX Copper Futures | $6.65 / lb | +0.47% (day) | Trading Economics |
| LME 3-Month Copper | ~$14,530 / tonne | Near record high | Bloomberg |
| U.S. Bare Bright Wire | $5.10–$5.43 / lb | Firm | Regional scrap yards |
| U.S. No. 1 Copper | $4.97–$5.27 / lb | Firm | Regional scrap yards |
| U.S. No. 2 Copper | $4.83–$4.90 / lb | Steady | Regional scrap yards |
| India MCX Copper | ₹1,403 / kg | +1.14% (week) | MCX-linked market data |
| China Yangshan Premium | $121 / tonne | Highest since Nov 2022 | Trading Economics |
Table 1. Key copper and copper-scrap benchmarks, week of 15–21 September 2026.
Daily price movements through the week illustrate a market still digesting the aftershocks of early-September's record run. Trading Economics data show copper opening the week around $6.58 per pound before slipping toward $6.50 on 16 September, a session an iScrap App market note attributed to renewed uncertainty over the timing of prospective U.S. tariffs on refined copper imports. From that low, prices stabilised and then climbed steadily through the remainder of the week, closing Friday at $6.62 per pound and extending gains into Monday's $6.65 close. The net effect was a modest weekly recovery of roughly $0.07 per pound, though it followed a far larger single-session swing the previous week: COMEX futures fell 4.7% intraday on 10 September after reports that a planned tariff escalation on refined copper was losing momentum, a move that erased a large share of the tariff-risk premium that had been built into prices since midsummer. Goldman Sachs has pegged copper's underlying fair value near $11,500 per tonne on the LME, several thousand dollars below the September peak, implying that a meaningful portion of the current price still reflects policy uncertainty rather than physical supply-demand balance alone. Scrap grades have broadly mirrored this pattern: U.S. yard postings for bare bright copper wire clustered around $5.10 to $5.43 per pound during the week, with No. 1 copper trading a modest discount to bare bright and No. 2 copper trading a further step below that, consistent with the standard grade hierarchy the industry uses to price contamination and processing cost into scrap.
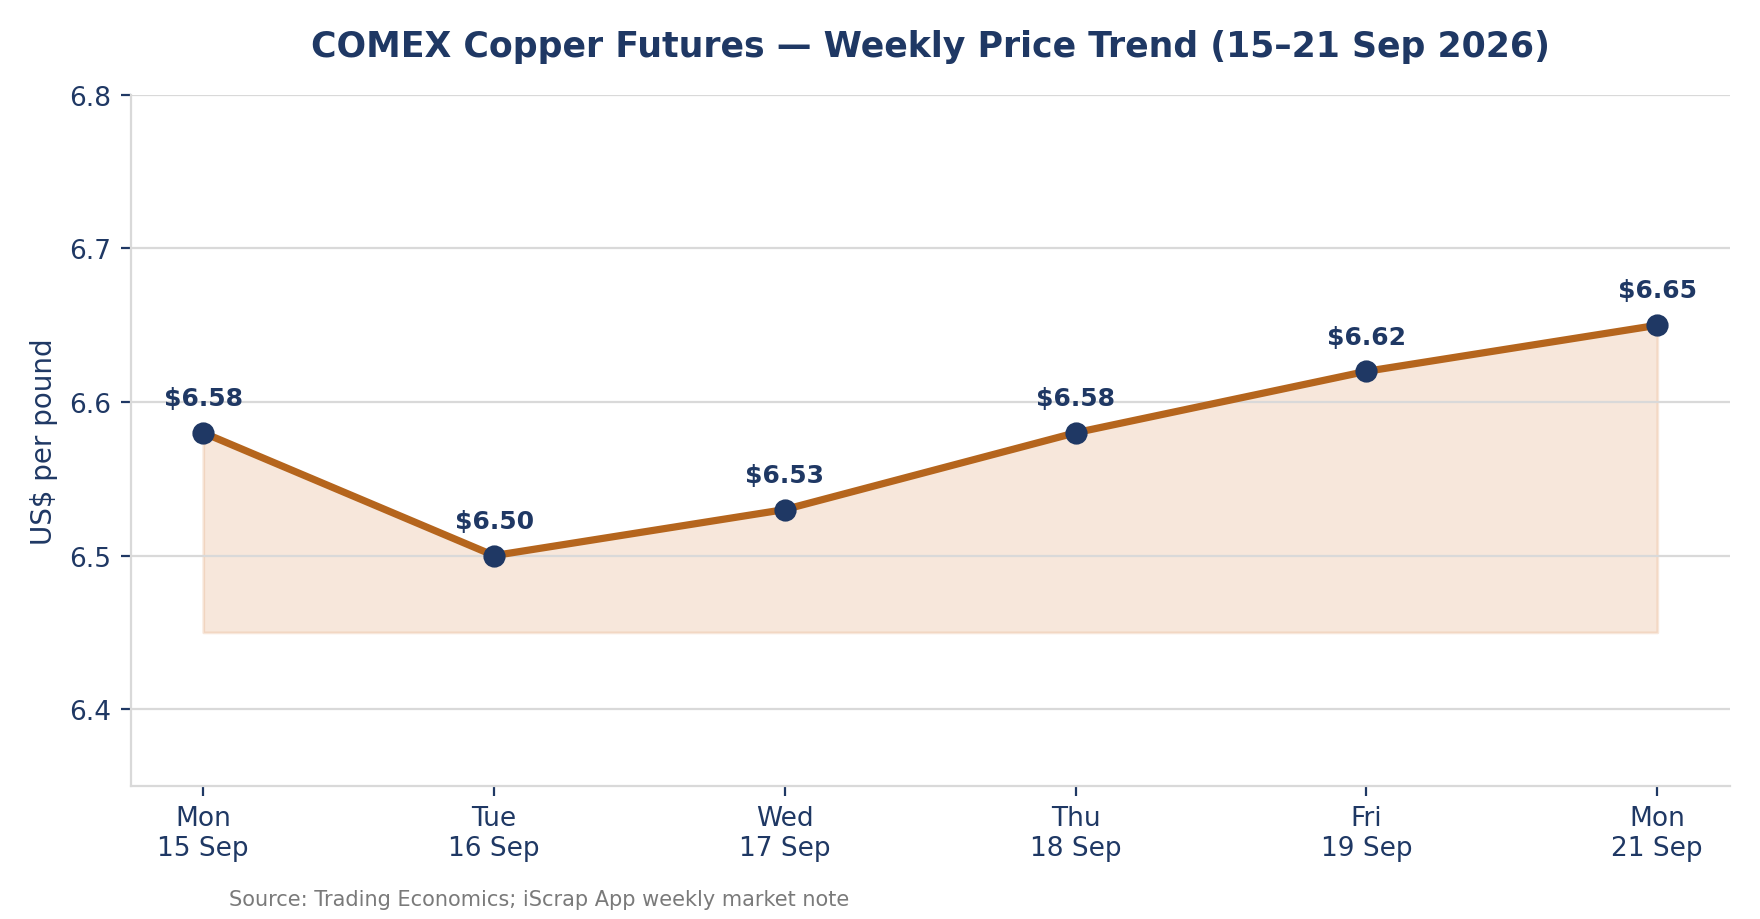
Figure 1. COMEX copper futures, daily close, 15–21 September 2026.
Supply-side conditions remain the dominant driver of the current price regime. The U.S. Geological Survey's Mineral Commodity Summaries 2026 reports that domestic mine production fell an estimated 5% in 2025 to about 1.0 million tons of recoverable copper, even as its value rose 10% to roughly $11 billion, underscoring how price gains are currently outpacing volume growth. Arizona alone accounted for close to 70% of that output.
Globally, mine supply has been further constrained by operational disruptions: Freeport-McMoRan's own disclosures describe a phased, multi-quarter ramp-up of the Grasberg Block Cave underground mine in Indonesia following a mud-rush incident in September 2025, with the company targeting a full recovery in production capacity only gradually through 2026 and beyond. Freeport reported second-quarter 2026 copper sales of 710 million pounds at an average realized price of $6.17 per pound, alongside a 65% year-on-year increase in consolidated net income, evidence that even constrained producers are capturing substantial margin at current price levels. Wood Mackenzie's most recent copper outlook describes the global market as entering 2026 with structural tightness increasingly dominating short-term cyclical noise, pointing to years of underinvestment, declining ore grades and lengthening project-development timelines as the reasons new mine supply is struggling to keep pace with demand. On the trade-policy front, the framework finalised at the end of June 2026 temporarily exempted refined copper imports from new duties, but phased tariffs of 15% from January 2027 and 30% from 2028 remain on the table, a prospect that has repeatedly pulled metal into U.S. warehouses ahead of any formal decision and left LME stocks comparatively thin.
Demand growth is the other half of the tightening equation, and it is increasingly being driven by sectors outside copper's traditional base of construction and general manufacturing. S&P Global's January 2026 study, Copper in the Age of AI, projects global copper demand rising to roughly 42 million metric tons by 2040, a 50% increase from current levels, with the acceleration attributed to electrification, artificial-intelligence data-centre buildout and rising defence spending alongside traditional grid and construction use. The same study projects that global mined production will peak at around 33 million metric tons in 2030 before plateauing, opening what its authors describe as a systemic risk to industrial and technological growth unless recycling and new mine investment scale considerably faster than current trajectories suggest. Wood Mackenzie's parallel analysis estimates that meeting 2035 demand will require more than 8 million tonnes per year of new mine capacity plus 3.5 million tonnes from direct-use scrap, a buildout it prices at upward of $210 billion against roughly $76 billion actually invested in copper mining over the preceding six years. Within this picture, recycled copper is expected to more than double in absolute terms, from about 4 million metric tons currently to 10 million metric tons by 2040 on S&P Global's figures, but even that expansion is not projected to close the gap on its own, leaving scrap markets structurally advantaged as consumers compete for every available ton of recoverable metal.
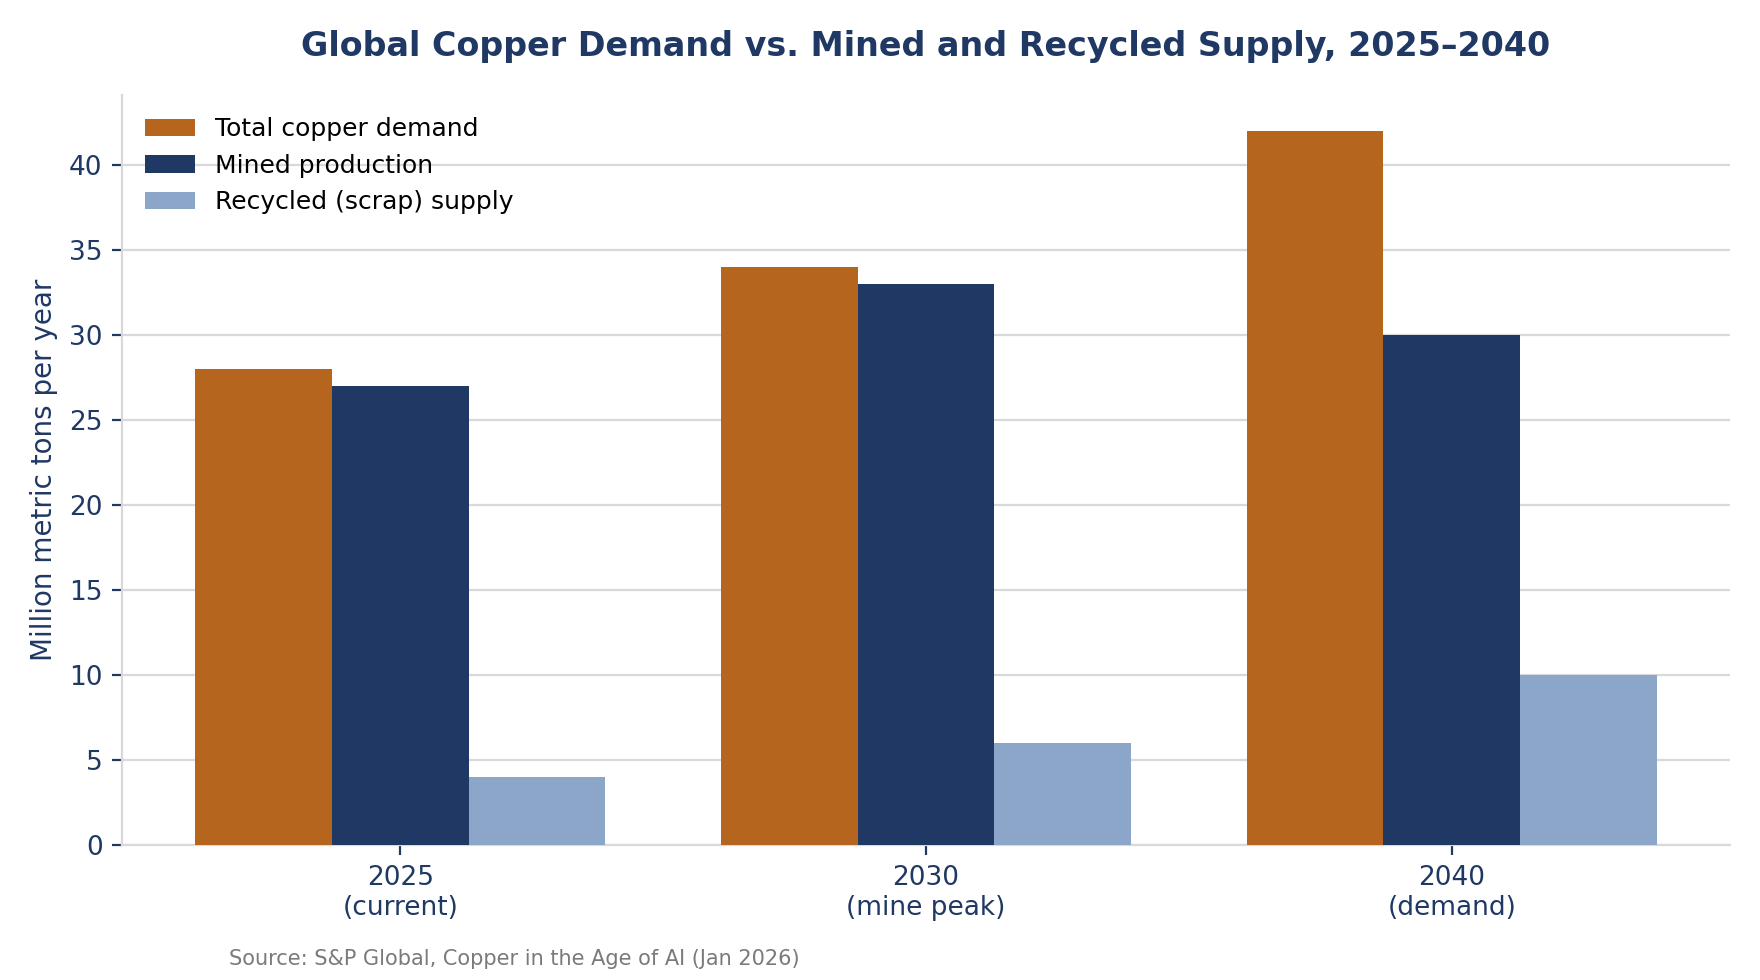
Figure 2. Global copper demand versus mined and recycled supply, 2025–2040.
Scrap-specific dynamics reinforce this tightening. USGS data show that old, post-consumer scrap converted to refined metal, alloys and other forms supplied an estimated 150,000 tons of copper domestically in the most recent full year on record, while new manufacturing scrap contributed a further 720,000 tons, with brass and wire-rod mills accounting for roughly 85% of total scrap consumption. Secondary refinery production, the copper recovered from scrap and returned to refined form, held in a narrow 39,000-to-49,000-ton band from 2021 through 2024 before an estimated jump to 60,000 tons in 2025, a step-change that industry participants attribute to wider refined-scrap price spreads incentivising processors to run scrap-heavy furnace charges rather than rely solely on concentrate. The Recycled Materials Association, the trade body formerly known as the Institute of Scrap Recycling Industries, continues to grade nonferrous scrap under its long-standing specifications circular, distinguishing bare bright wire, No. 1 and No. 2 copper, and lower-value categories such as copper-bearing scrap and irony brass by contamination level and copper content, a taxonomy that remains the reference standard buyers and sellers use to price grade discounts across every regional market this tracker covers. Persistence Market Research estimates the U.S. copper scrap market alone at approximately $18 billion in 2026, expanding at a projected 6.5% compound annual rate through 2033 on the back of grid-modernisation spending under existing federal infrastructure programmes and continuing electric-vehicle-driven demand, a trajectory broadly consistent with the national and international figures cited elsewhere in this tracker.
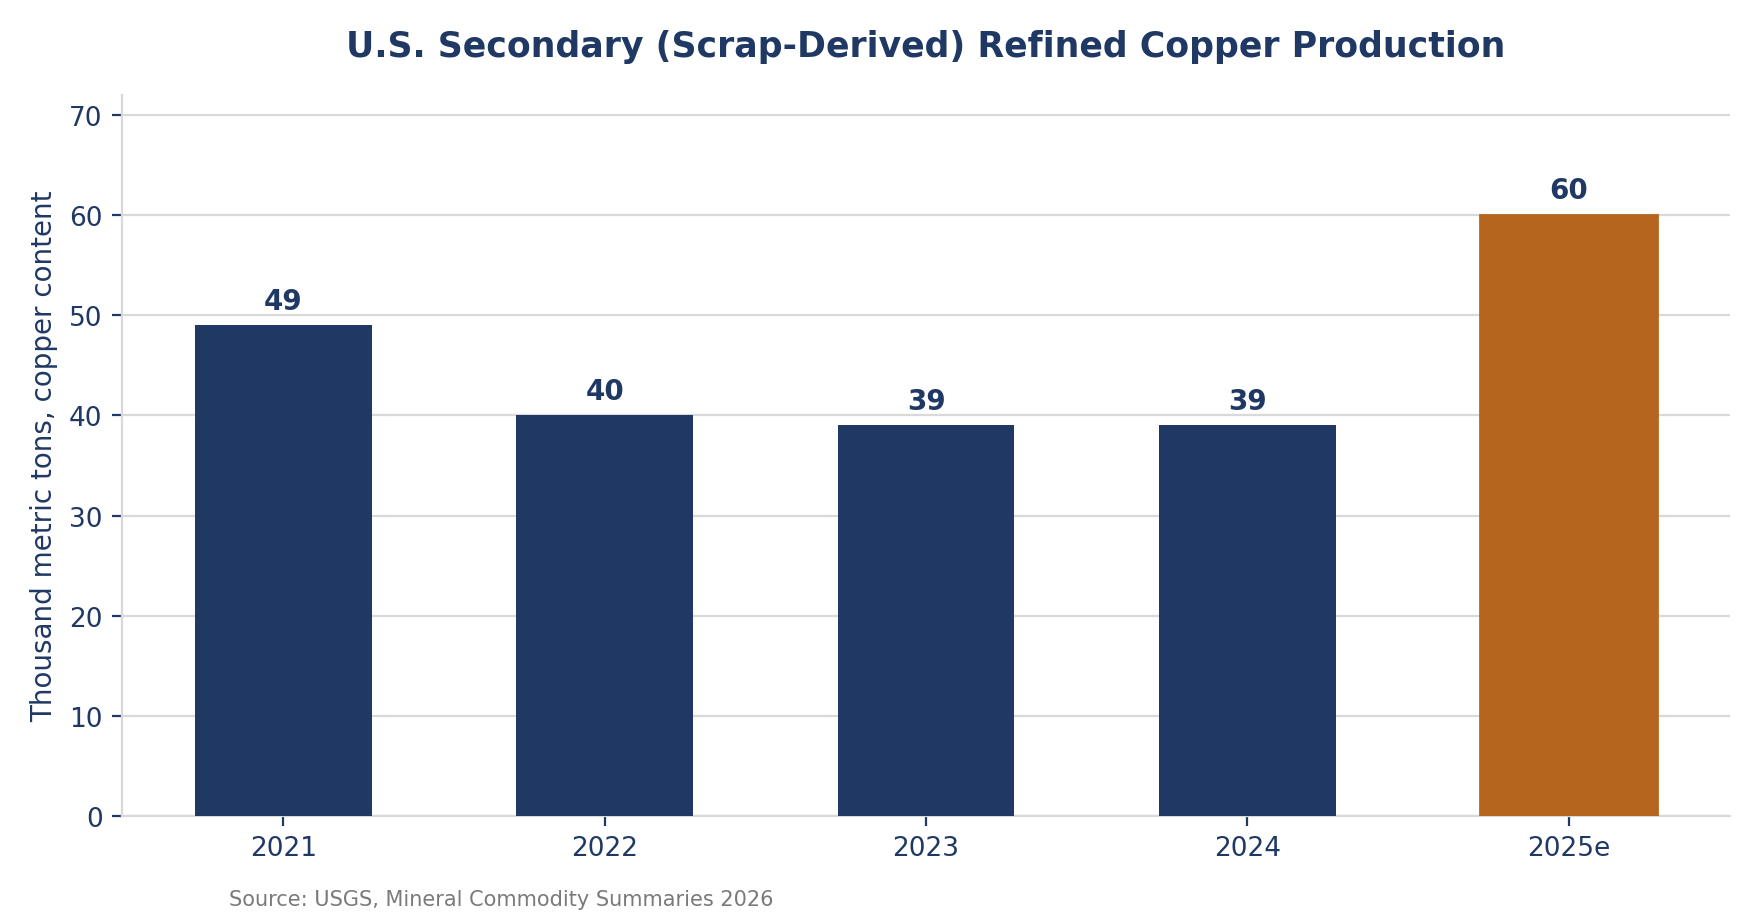
Figure 3. U.S. secondary (scrap-derived) refined copper production, 2021–2025.
Regional scrap pricing continued to diverge this week, reflecting differing import dependence, currency effects and domestic collection infrastructure. In the United States, Chicago-area yards posted roughly $5.10 per pound for bare bright copper and $4.97 for No. 1 copper during the week, while national online scrap trackers showed a somewhat wider $4.10-to-$5.50 range once regional and grade variation is included. Bloomberg's coverage of the broader refined market noted that LME three-month copper closed at its highest level ever on 7 September at $14,533 a tonne, a roughly 47% year-on-year gain that has pulled scrap prices higher in tandem across every major consuming region. India's copper market, relevant to Epignosis Insights' home base in Pune, traded on the Multi Commodity Exchange near ₹1,403 per kilogram in the third week of September, with import-dependent domestic scrap pricing continuing to track both MCX futures and rupee movements; UN Comtrade figures compiled via Trading Economics show copper waste and scrap remaining a meaningful line item within India's broader copper import basket sourced from the United States, the United Kingdom and the United Arab Emirates. China, still the largest single consumer of copper scrap globally, continues to absorb material through both domestic collection and imports, with the Yangshan premium, a closely watched gauge of Chinese physical copper demand, climbing to $121 a tonne in mid-September, its highest level since November 2022, according to Trading Economics' market commentary, a signal of firm import appetite that has historically flowed through to regional scrap premiums as well.
Several distinct risk factors are likely to shape scrap pricing over the coming weeks, and procurement teams following this tracker should weight them differently depending on time horizon. In the near term, U.S. tariff policy remains the dominant swing factor: the 30 June 2026 framework left refined copper temporarily exempt while leaving phased duties of 15% from January 2027 and 30% from 2028 on the table, and each new signal about that timeline has produced outsized single-session price moves, including both the early-September record highs and the 10 September reversal. A second near-term factor is exchange inventory positioning; Trading Economics reported LME warehouse inflows reaching a four-week high in mid-September, pushing the London market into contango and signalling more ample near-term availability even as COMEX stockpiles built on tariff-driven import front-running remain historically large. Over a medium-term horizon, the pace of the Grasberg Block Cave ramp-up in Indonesia and the progress of Freeport-McMoRan's leaching-technology initiatives, which the company is targeting to add roughly 300 million pounds of annual production, will materially affect how quickly mine supply responds to price incentives. Longer term, the gap Wood Mackenzie and S&P Global both identify between required investment and capital actually committed to new mine capacity is the structural factor underpinning elevated price expectations across nearly every forecast surveyed for this report, and it is this gap, more than any single week's price movement, that continues to make scrap an increasingly strategic feedstock for downstream copper consumers.
Looking into the final quarter of 2026, most compiled forecasts point to continued price support rather than a reversal. Market commentary aggregated by Capital.com cites UBS projections of copper reaching roughly $14,000 per tonne by September 2026 and as much as $14,500 by year-end if current supply constraints persist, with third-party targets across the sources it tracks clustering broadly between $11,750 and $15,500 per tonne. The principal risks to that view are concentrated on the policy side: any formal confirmation or further delay of the pending U.S. refined-copper tariff schedule is likely to remain the single largest source of single-session volatility, as the 10 September reversal demonstrated. On the supply side, the pace of the Grasberg Block Cave ramp-up, the scale of new mine investment relative to Wood Mackenzie's $210 billion estimate of what is required by 2035, and the rate at which secondary refiners can scale scrap-based output all bear close monitoring. For scrap-market participants specifically, the combination of record refined prices, thin exchange inventories and structurally rising demand from electrification and data-centre buildout continues to argue for firm collection and processing margins into 2027, even allowing for the kind of short-term pullbacks the market experienced twice already in September. Epignosis Insights will continue to compile and cross-check this tracker on a weekly basis, integrating fresh government, association, corporate, consultancy and news-sourced data as each new reporting cycle becomes available.