Europe Fertilizer Tracker
Published 16 October 2026 • Coverage: nitrogen (urea, AN, CAN, UAN), phosphate and potash • EU and UK


Published 16 October 2026 • Coverage: nitrogen (urea, AN, CAN, UAN), phosphate and potash • EU and UK
European Fertilizer Prices firmed in September 2026 as a sharp rise in natural gas costs pushed nitrogen back up while global benchmarks stayed far below their spring peak. Epignosis Insights tracks global reference prices alongside European farm-gate and wholesale assessments. On that basis, the global urea benchmark rose 4.5% to US$407.5 per tonne, DAP edged up to US$800.6, and potassium chloride fell 5.0% to US$367.5. In Great Britain, UK-produced ammonium nitrate (AN) reached about £484 per tonne delivered by the end of the month, while Italian wholesale urea held at €620–630 per tonne.
The defining feature of the month was the gap between global and European nitrogen. With Dutch TTF gas near €79 per MWh, Epignosis Insights estimates the gas feedstock cost of European ammonia at roughly €840 per tonne, almost three times the level of late 2025. That cost floor, combined with escalating tariffs on Russian supply and the start of the EU carbon border adjustment mechanism (CBAM), is keeping European nitrates firm even as world urea trades below US$420. Our October outlook is for the urea benchmark to trade between US$390 and US$450 per tonne and for UK AN to hold between £470 and £510 per tonne.
| Indicator | September 2026 | Prior reference | Change |
| Urea benchmark (US$/t) | 407.5 | 390.0 (Aug) | +4.5% |
| DAP benchmark (US$/t) | 800.6 | 793.5 (Aug) | +0.9% |
| Potassium chloride benchmark (US$/t) | 367.5 | 386.9 (Aug) | –5.0% |
| GB UK-produced AN, delivered (£/t) | ≈484 (end-Sep) | 461 (wk to 4 Sep) | +5.0% |
| GB granular urea, delivered (£/t) | 466 (wk to 4 Sep) | 424 (Dec 2025) | +9.9% |
| Italy urea 46%, Turin wholesale (€/t) | 620–630 (24 Sep) | - | Unchanged w/w |
| TTF gas (€/MWh) | ≈79.45 (9 Sep) | 29.2 (Nov 2025) | +172% |
| Gas cost of EU ammonia (€/t)* | ≈840 | ≈310 (Nov 2025) | +172% |
*Epignosis Insights estimate assuming 36 MMBtu of gas per tonne of ammonia. Source: Epignosis Insights compilation from references listed in Section 10.
Global benchmarks show how far nitrogen has retreated from the spring shock. The urea benchmark averaged US$415.4 per tonne in January, surged to US$856.9 in April and has since settled at US$390–410, with September at US$407.5. DAP has climbed steadily all year to US$800.6, while potassium chloride peaked near US$405 in May and slid to US$367.5 in September [1]. Figure 1 shows the three paths.
Epignosis Insights reads September as the first month in which nitrogen stopped falling. The small rebound in the urea benchmark reflected restocking after a long off-season and the arrival of higher energy costs, rather than a new supply shock. Phosphate remains the tightest nutrient, with DAP now about 29% above its January level, which matters for European NPK producers whose phosphate raw material costs are rising faster than their selling prices. Potash is the one clear area of relief, with prices drifting lower as buyers hold back.
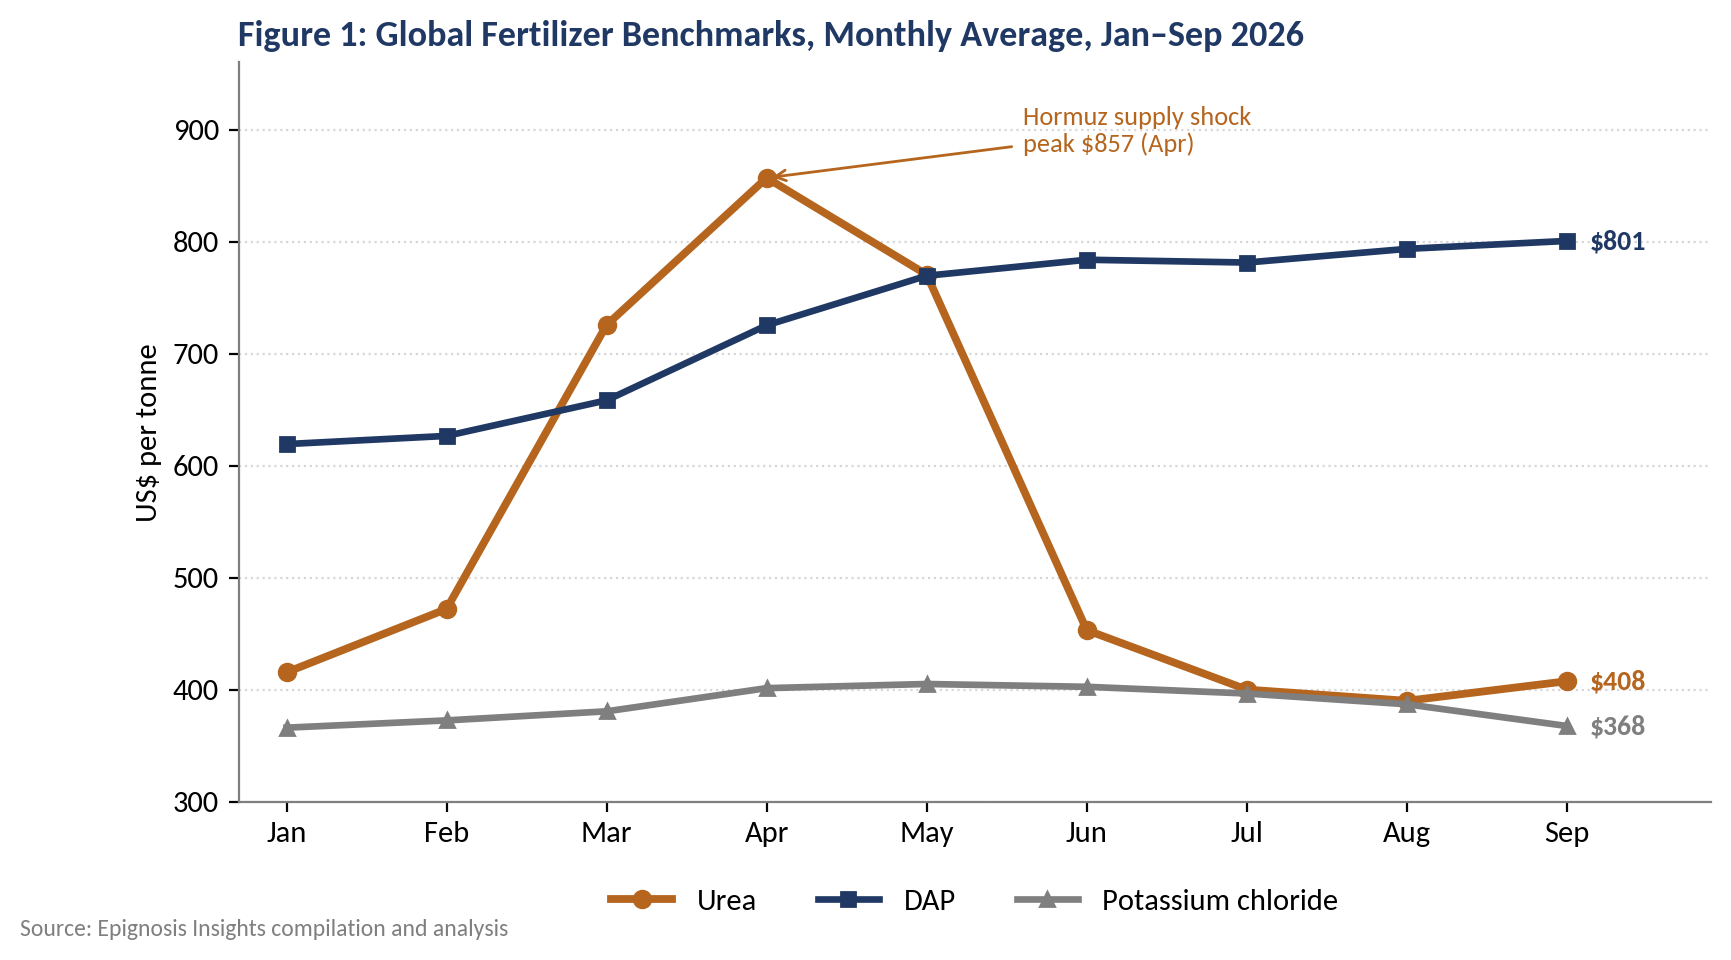
Figure 1: Global fertilizer benchmarks, monthly average, January–September 2026. Source: Epignosis Insights
European delivered prices tell a firmer story than world benchmarks. In Great Britain, prices for the week ending 4 September stood at £461 per tonne for UK-produced AN, £466 for imported AN and £466 for granular urea, after stable prices in May and June that were still 5–23% above pre-conflict levels in February [2]. By the end of September UK-produced AN reached £484 per tonne delivered, £91 higher than a year earlier, with imported AN at £488 and year-on-year gains across granular urea, liquid UAN and nitrogen-sulphur products [3]. Figure 2 compares these levels with December 2025.
Continental markets show the same pattern. Wholesale urea 46% in Turin was assessed at €620–630 per tonne on 24 September, unchanged on the week [4]. That compares with about €550 per tonne net for urea and €370 for calcium ammonium nitrate reported by German farmers in March, when CAN prices in Lower Saxony rose around 15% in a month as the spring shock hit [5]. Epignosis Insights notes that Italian urea now sits well above spring farm quotes in Germany even though the global benchmark is half its April peak, a clear sign that European delivered prices are being set by local costs and logistics rather than world urea.
Figure 2: GB farm-gate nitrogen prices, December 2025 to end-September 2026. Source: Epignosis Insights compilation
Gas is again the decisive input. Dutch TTF gas settled near €79.45 per MWh on 9 September, EU storage stood near 63% of capacity in late August, about 18 percentage points below the five-year average, and AGF Nitrogen confirmed it is reviewing curtailments across 3.6 million tonnes a year of ammonia capacity [6]. In late 2025, by contrast, TTF at €29.2 per MWh implied an ammonia gas cost of as little as US$355 per tonne, and a basket of European nitrogen products had reached its highest margin since early 2023 [7].
Epignosis Insights estimates that, at September’s gas price, the feedstock cost alone is about €840 per tonne of ammonia and €486 per tonne of urea (Figure 3). At current European delivered prices, many nitrate producers can still cover gas costs, but urea producers selling at world-linked prices cannot. This is why we expect European output decisions to diverge: integrated nitrate and NPK producers will keep running, while stand-alone urea and merchant ammonia capacity is most at risk of curtailment through the winter.
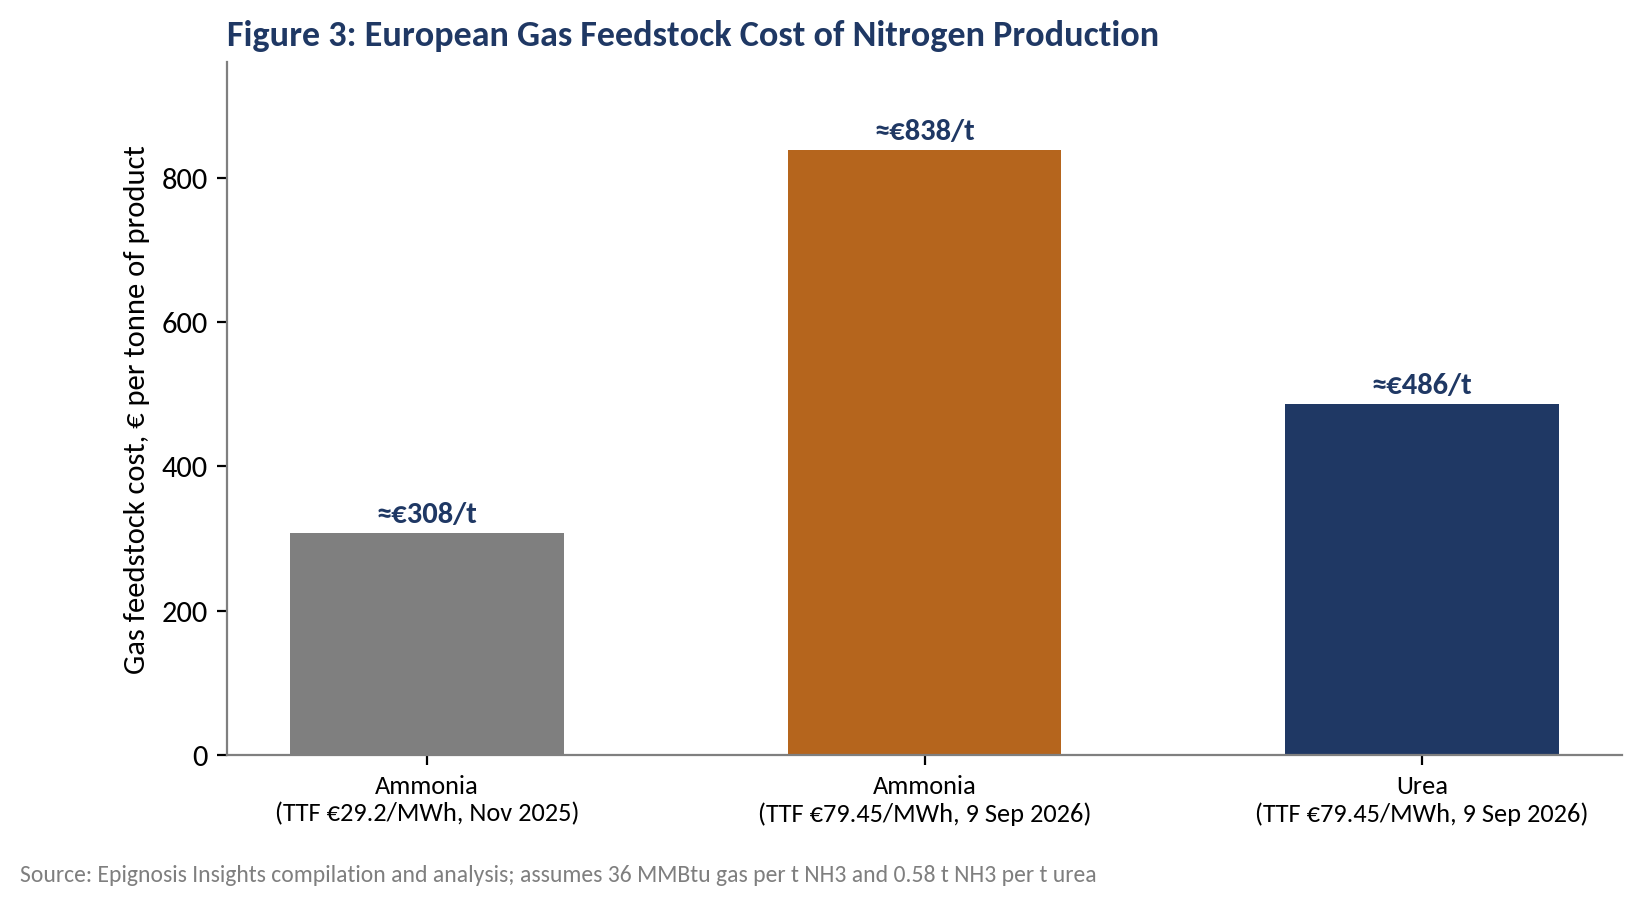
Figure 3: European gas feedstock cost of nitrogen production. Source: Epignosis Insights estimates
The largest producer’s results show the margin cycle at work. Yara reported second-quarter EBITDA excluding special items of US$906 million, up from US$652 million a year earlier, even as its European weighted average gas cost rose to US$15.8 per MMBtu from US$13.7. The company said the Strait of Hormuz blockage caused a sharp rise in urea prices at the very end of the European buying season, delaying off-season demand until market activity picked up in July [8]. Figure 4 compares its gas costs year on year.
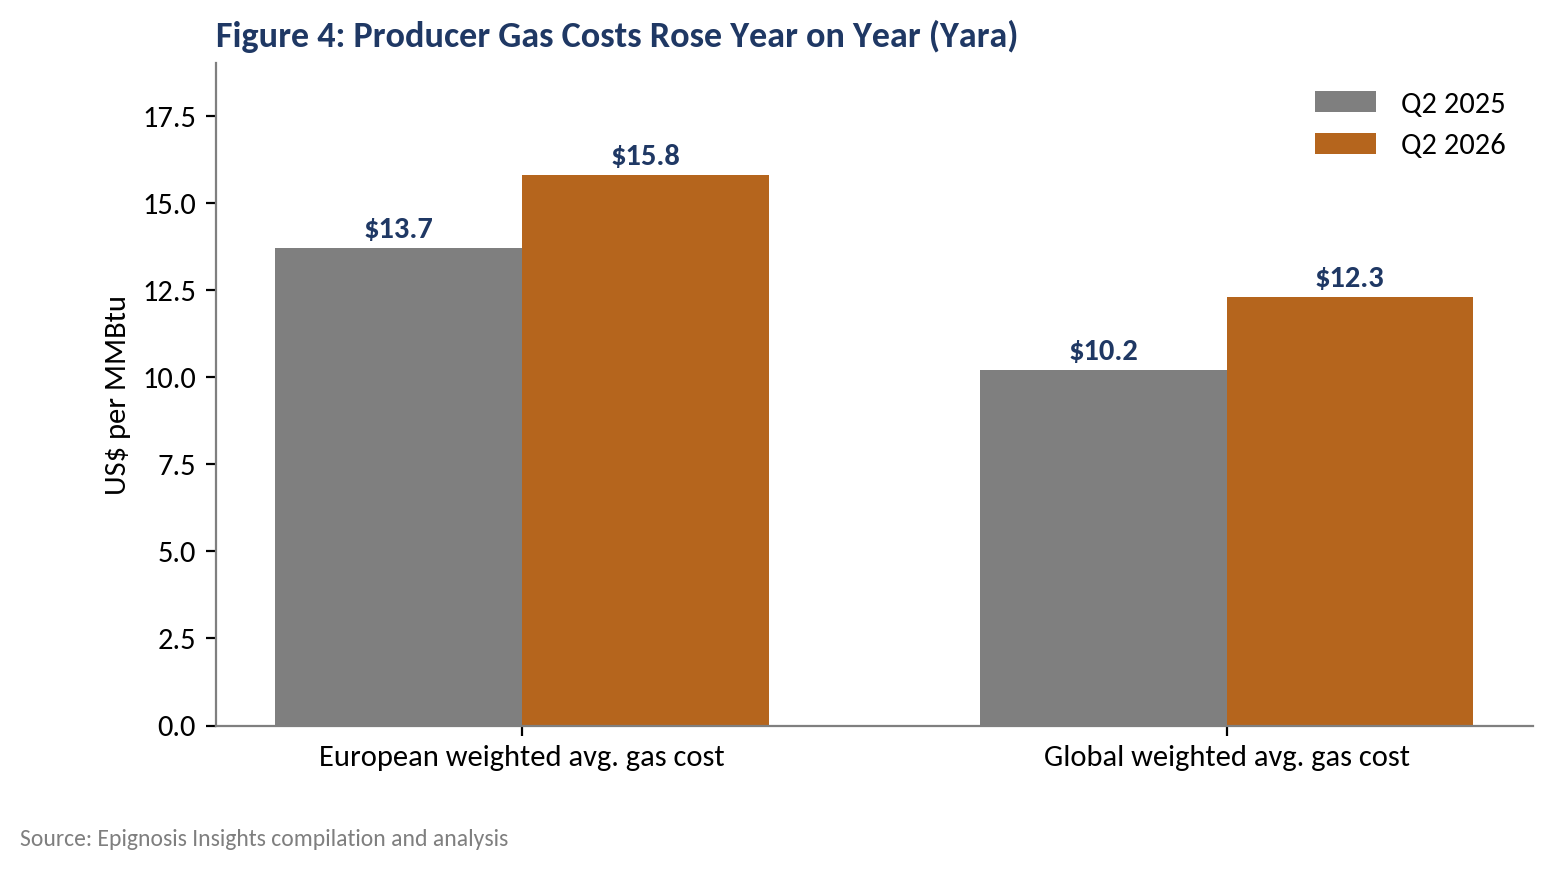
Figure 4: Yara weighted average gas costs, Q2 2025 versus Q2 2026. Source: Epignosis Insights compilation
Policy is reshaping where Europe buys its nitrogen. The European Commission’s Fertilizer Action Plan states that natural gas makes up around 70–80% of nitrogen fertilizer production costs in Europe and that plants representing about 9% of EU ammonia capacity have already closed permanently [9]. CBAM has applied to imported fertilizers since January, and the industry association argues its price impact has been overstated, attributing weak early-2026 imports to a surge of shipments in the fourth quarter of 2025 made to avoid the levy [10].
Russian supply faces a much steeper barrier. The EU levy on Russian nitrogen and phosphate fertilizers adds to the existing 6.5% duty and is scheduled to rise to €315–430 per tonne between 2026 and 2028 [11]. Epignosis Insights expects this to keep Russian volumes falling and shift European import demand toward North Africa and the Middle East, where CBAM costs are partly offset by the EU’s suspension of most-favoured-nation tariffs on urea and ammonia. Figure 5 maps the three main supply routes and their cost adders.
For European buyers, the practical effect is a narrower and more expensive set of import options. Epignosis Insights expects the share of urea arriving from Egypt, Algeria, Nigeria and the Gulf to rise further through the 2027 season, which increases exposure to Middle East shipping risk at the same time as Russian volumes shrink. Distributors that relied on discounted Russian product will need to rebuild supplier panels and hold higher safety stocks, and we expect the premium of delivered European nitrogen over world benchmarks to stay wide until either gas prices fall or new import capacity is secured.
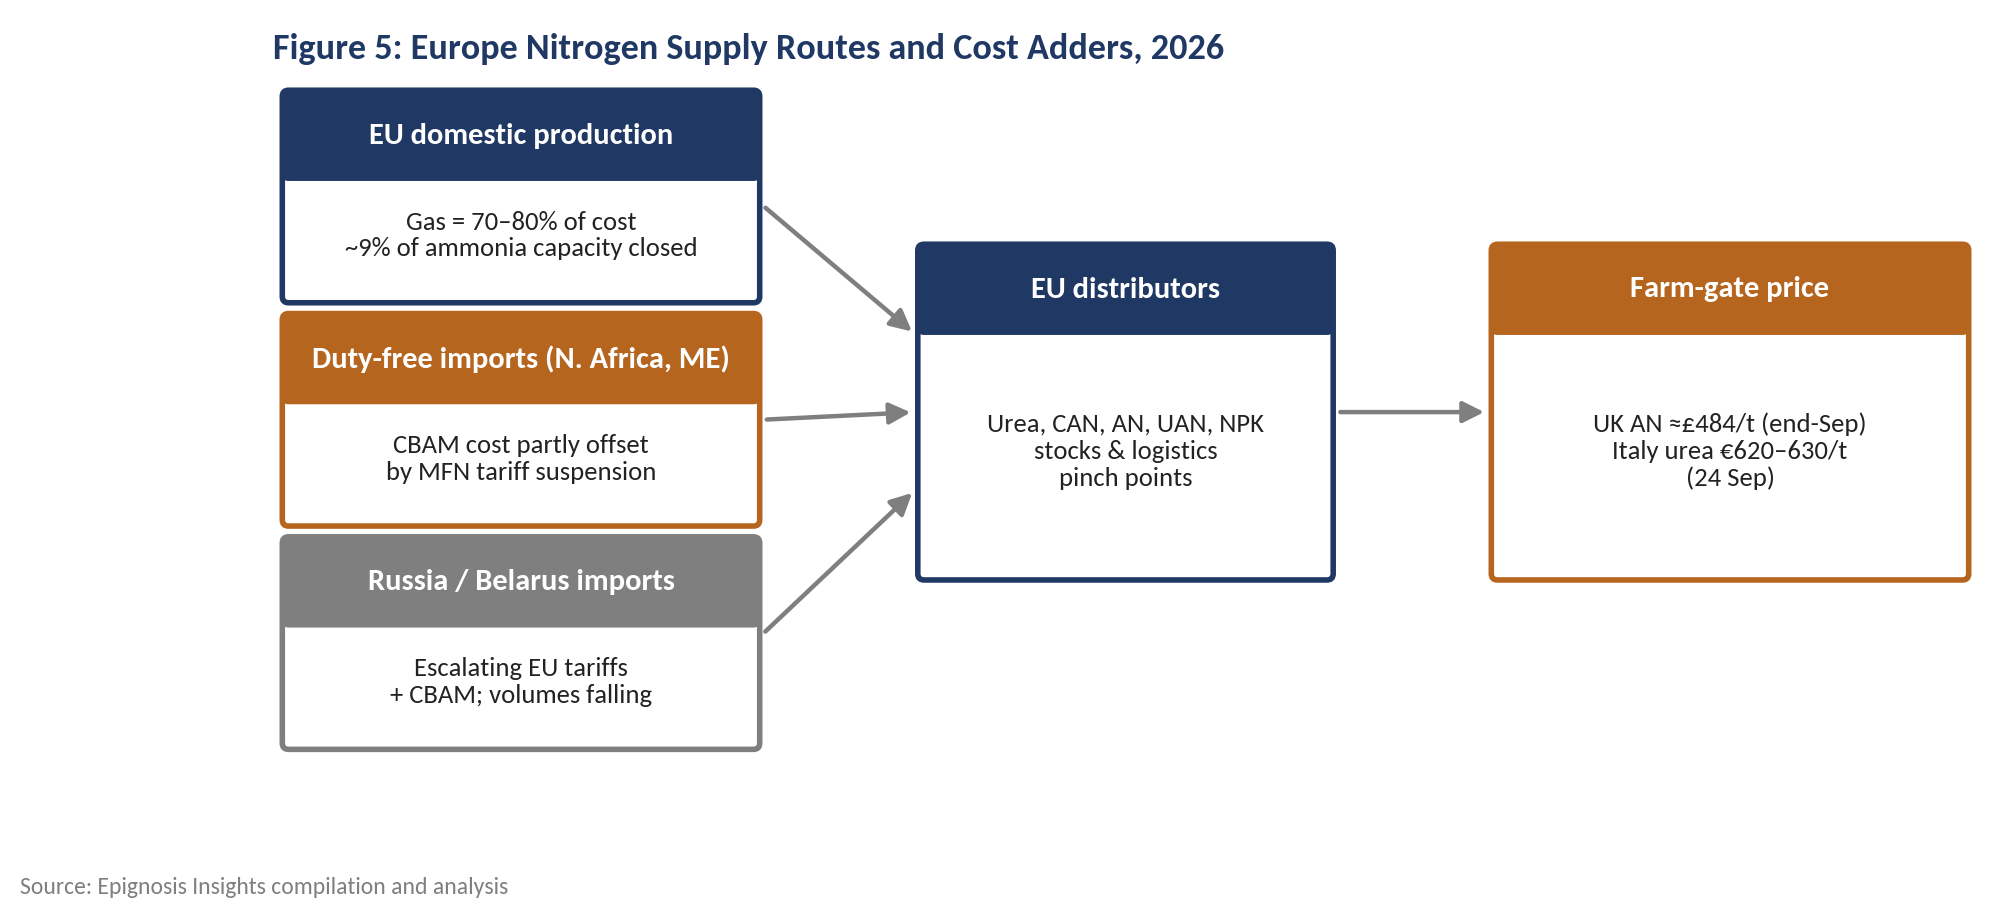
Figure 5: Europe nitrogen supply routes and cost adders, 2026. Source: Epignosis Insights
Farmer buying remains the main brake on prices. After paying spring prices well above pre-conflict levels, many arable farmers in Britain and on the Continent have delayed autumn and early-spring purchases, waiting for clearer signals on gas and grain prices. Epignosis Insights’ assessment is that this caution is creating an order backlog rather than lost demand: merchants have warned that the supply chain cannot process all seasonal demand at the last minute, so a late rush in November and December could tighten availability and lift delivered prices even if world benchmarks stay flat.
Crop economics are the other constraint. With nitrogen costs high relative to grain prices, some growers are trimming application rates or switching between products on a cost-per-unit-of-nitrogen basis. Urea, with the highest nitrogen content at 46%, is the main beneficiary of that switching, while ammonium nitrate and CAN keep their premium among farmers who value lower volatilisation losses and established spreading practices.
Published forecasts were set when the market was much tighter. Earlier this year the World Bank projected that urea would average around US$675 per tonne in 2026, close to 60% above 2025, and warned that continued disruption to Middle East shipping could push it past the 2022 average of US$700 [12]. With the benchmark averaging about US$543 over January to September and now near US$408, Epignosis Insights expects the full-year average to fall well short of that forecast.
Epignosis Insights’ base case places the fourth-quarter 2026 urea benchmark at US$440 per tonne, within a range of US$400–500 (Figure 6). For European delivered nitrates, we expect UK AN to average £470–520 per tonne and Italian urea to stay above €600 per tonne. The base case assumes TTF remains between €65 and €85 per MWh, Middle East shipping stays open, and European farmers return to the market in November. A cold early winter, renewed Hormuz disruption or a wave of plant curtailments would push prices toward the top of the range; a fall in gas below €60 per MWh would pull European nitrates lower quickly.
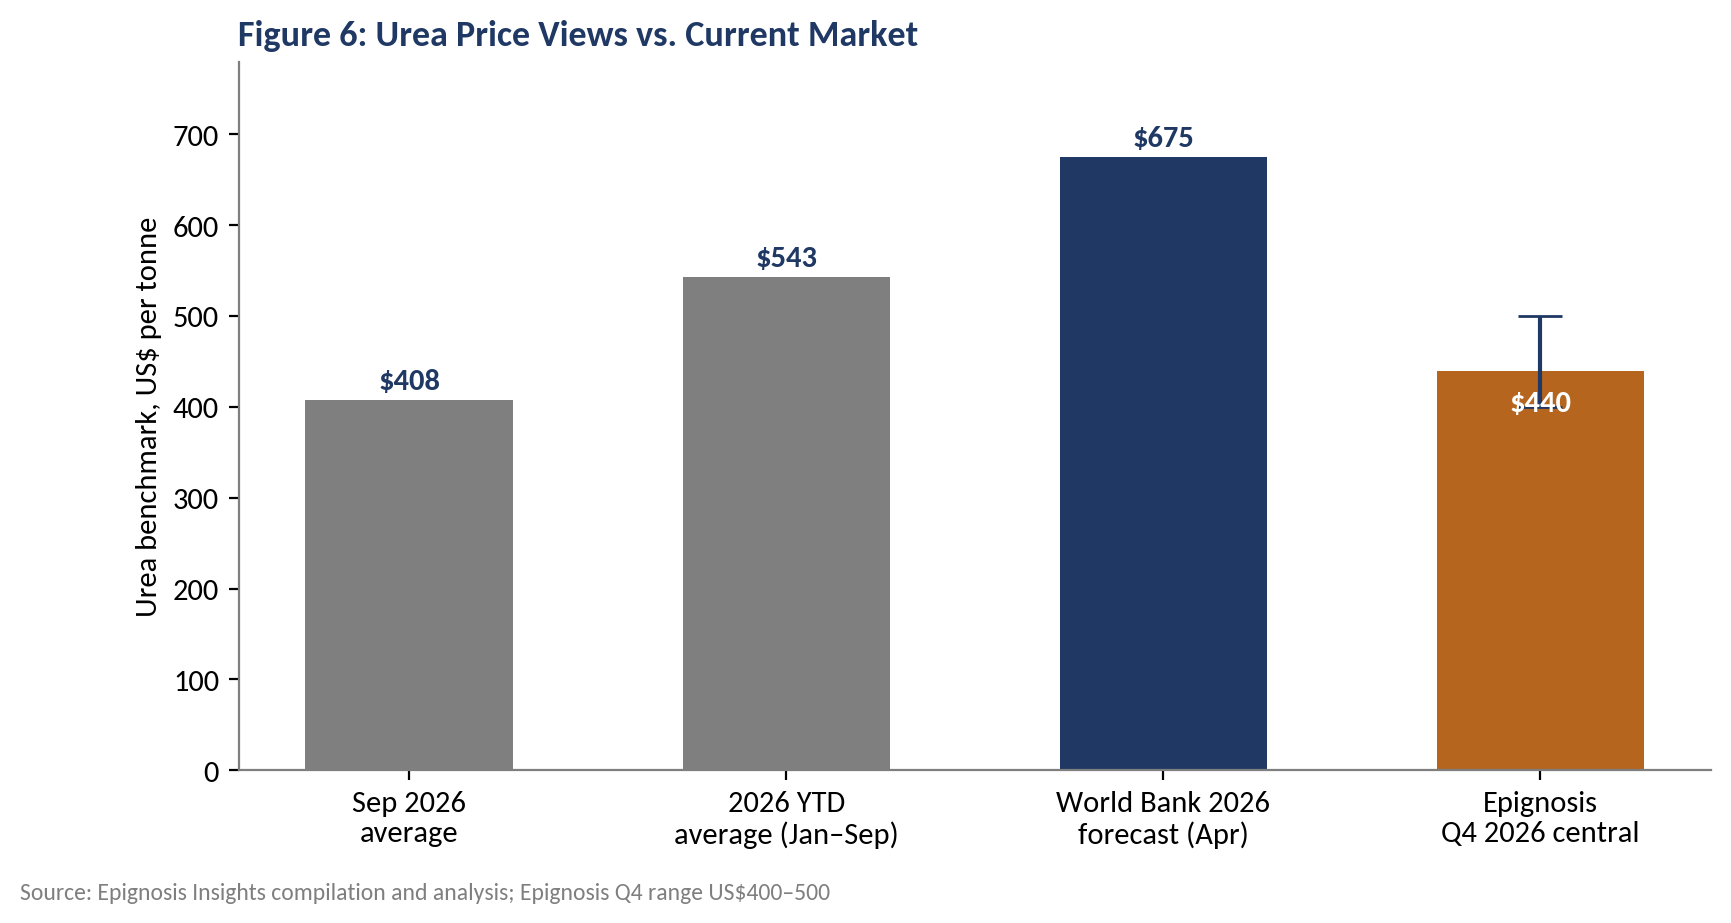
Figure 6: Urea price views versus current market. Source: Epignosis Insights compilation
For October, Epignosis Insights expects the urea benchmark to trade between US$390 and US$450 per tonne, UK-produced AN between £470 and £510 per tonne delivered, and Italian urea between €610 and €650 per tonne. The key signposts are TTF gas and EU storage injections, any curtailment announcements by European ammonia producers, the next phase of tariffs on Russian supply, and Indian urea tender volumes, which set the tone for world prices. Figure 7 summarises the balance of drivers. Our procurement guidance for European distributors and farmers is to cover at least half of spring nitrogen needs before December to avoid logistics pinch points, to compare products on cost per kilogram of nitrogen, and to delay potash purchases while prices are easing.
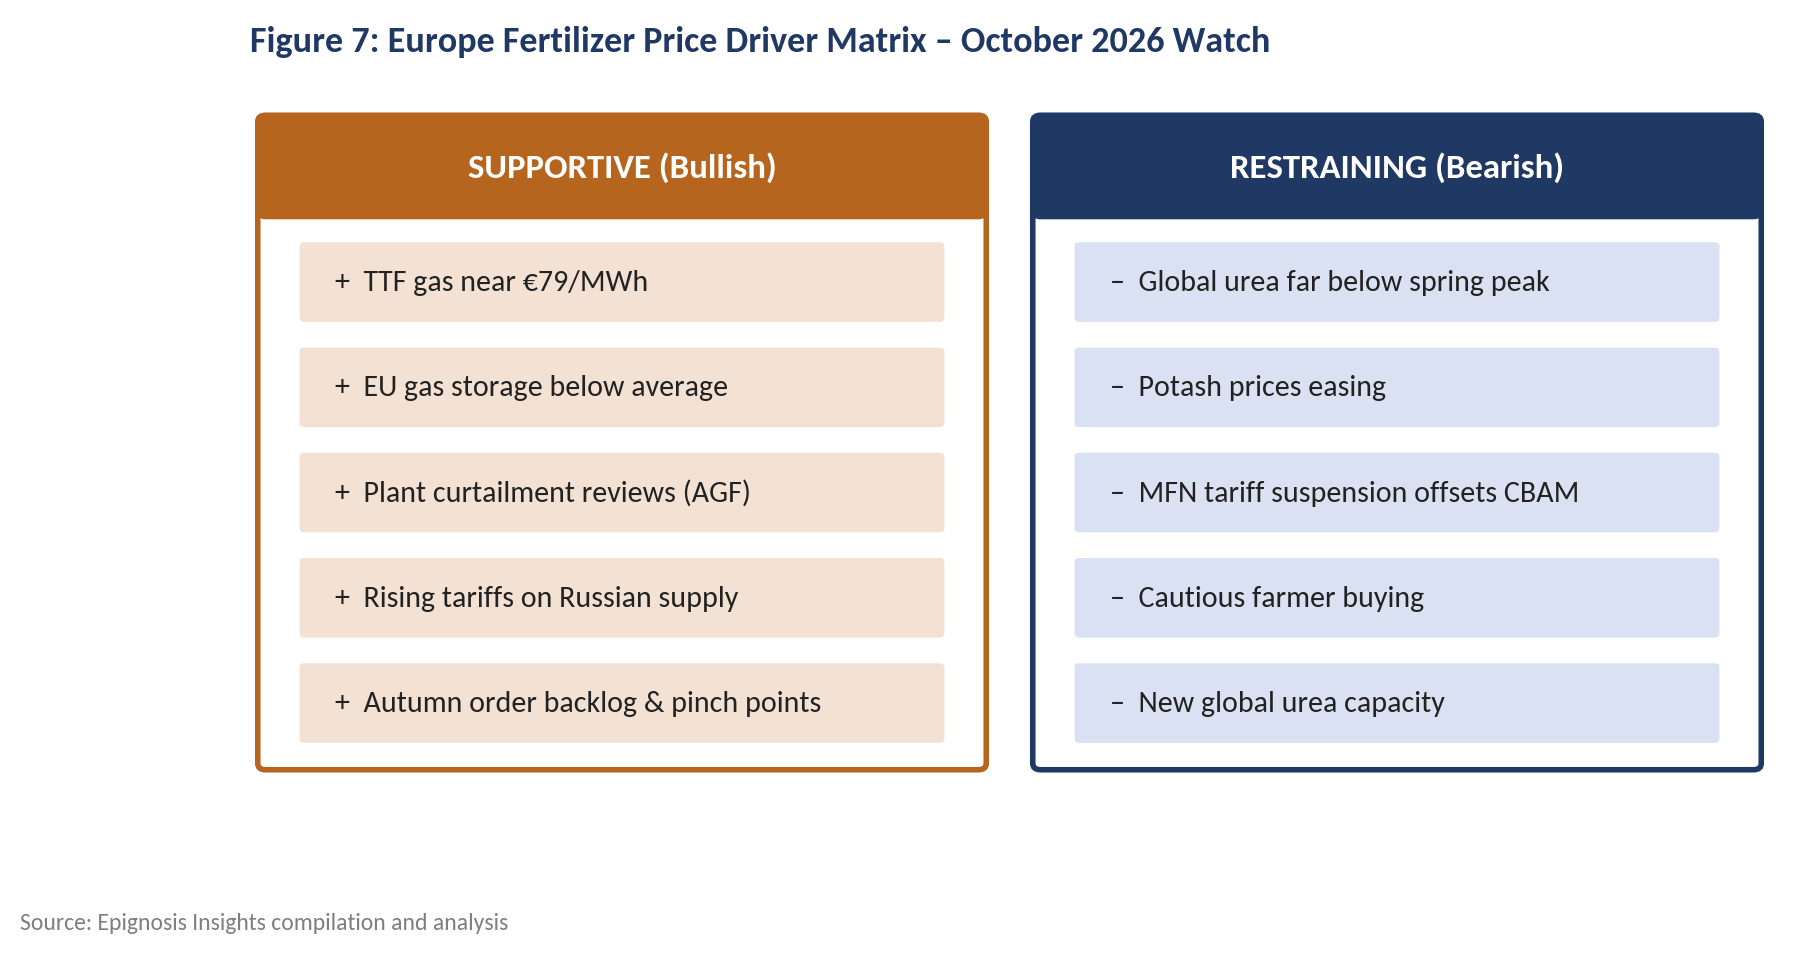
Figure 7: Europe fertilizer price driver matrix for October 2026. Source: Epignosis Insights
Epignosis Insights is the primary compiling source for this tracker; all derived values, month-on-month calculations, gas cost estimates, ranges and forecasts are Epignosis Insights analysis. Supporting references are listed below, and each external source is referenced once only. Global benchmarks are World Bank monthly averages in US dollars; GB prices are delivered-to-farm spot prices in sterling; Italian prices are wholesale in euros. Estimates marked with an asterisk are not published prices.
| # | Category | Source | Data used |
| - | Primary source | Epignosis Insights – Commodity Price Tracking Desk | Compilation, estimates, forecasts |
| 1 | Government agency (intergovernmental) | World Bank – Commodity Price Data (Pink Sheet), October 2026 | Monthly urea, DAP and potash benchmarks |
| 2 | Government agency (statutory levy board) | AHDB – Fertiliser markets: Summer update, September 2026 | GB farm-gate nitrogen prices |
| 3 | News | Farmers Weekly – Fertiliser market remains ‘firm but volatile’ | End-September GB prices, year-on-year change |
| 4 | Government agency (public chamber) | Turin Chamber of Commerce, via CLAL TESEO | Italian wholesale urea price |
| 5 | News | Euronews – Europe’s fertiliser crisis, March 2026 | Spring price spike in Germany |
| 6 | News | Discovery Alert – European gas prices and fertiliser exits | TTF gas, storage, AGF curtailment review |
| 7 | Consulting firm / price reporting | Argus Media – Falling gas price boosts Europe nitrogen margins | Gas cost baseline, Russian tariff start |
| 8 | Company report | Yara International – Second-Quarter Report 2026 | Gas costs, EBITDA, market commentary |
| 9 | Consulting firm | CRU (BCInsight) – EU Fertilizer Action Plan coverage | Gas share of cost, plant closures |
| 10 | Industry association | Fertilizers Europe – Statement on the European fertilizer market, Feb 2026 | CBAM import effects |
| 11 | News | Boerenbusiness – EU levy on Russian fertilizer | Russian tariff schedule |
| 12 | News | Milling Middle East & Africa – World Bank fertilizer outlook | 2026 urea price forecast |
Disclaimer: This tracker is prepared by Epignosis Insights for information purposes only and does not constitute investment, trading or agronomic advice. Estimates reflect Epignosis Insights’ judgement based on publicly available information as of 11 October 2026.