Global Sugar Price Tracker
Weekly Market Intelligence Report | Week Ending August 24, 2026


Weekly Market Intelligence Report | Week Ending August 24, 2026
Global Sugar Markets are consolidating near multi-month highs after one of the sharpest reversals in recent years, according to Epignosis Insights' weekly compilation of raw and white sugar benchmark assessments. NY Raw Sugar No.11, the world's principal benchmark contract, closed the week ending August 24, 2026 at approximately $377 per metric tonne equivalent, down modestly from a nine-week high of roughly $384/mt the previous week but still up more than 14 percent over the trailing four weeks. London White Sugar No.5 followed a similar arc, easing to $511/mt from $518/mt after climbing steadily since late June. The reversal in sentiment has been unusually sharp: as recently as February 2026, analysts were projecting a multi-million-tonne global surplus for the 2026/27 season, but a succession of downward revisions through the spring and summer has flipped several forecasters into outright deficit territory. This report synthesizes weekly pricing signals, the structural drivers behind them — from India's export ban to Brazil's ethanol-driven cane diversion — and the outlook into the 2026/27 marketing year, drawing on government agencies, an industry association, a listed company's investor disclosures, consulting-firm analysis and financial news coverage.
The table below summarizes indicative weekly benchmark sugar price assessments across the four markets Epignosis Insights tracks on a rolling basis, expressed in US dollars per metric tonne on the delivery basis conventionally used for each contract (FOB for NY No.11, Brazil and Thailand; CIF for London No.5). All four benchmarks have moved in the same direction over the past two months, reflecting how tightly the raw and white sugar complexes remain linked even as regional premiums shift with policy and logistics.
| Regional Benchmark | Aug 03 | Aug 10 | Aug 17 | Aug 24 |
| NY Raw Sugar No.11 (FOB) | $373 | $379 | $384 | $377 |
| London White Sugar No.5 (CIF) | $502 | $512 | $518 | $511 |
| Brazil Raw Sugar (FOB) | $357 | $363 | $368 | $362 |
| Thailand White Sugar (FOB) | $483 | $492 | $498 | $491 |
Table 1: Weekly sugar benchmark prices (USD/mt), last four weeks. Source: Epignosis Insights compilation of public disclosures.
The nine-week trend chart below extends the view back to late June, capturing the sustained rally from multi-year lows through to last week's high before this week's modest pullback. London White Sugar No.5 trades at the largest premium of the four benchmarks, reflecting refined sugar's tighter supply picture in Asia, while Brazil FOB raw sugar has consistently traded at the widest discount, supported by the country's large exportable surplus even as more cane is diverted to ethanol.
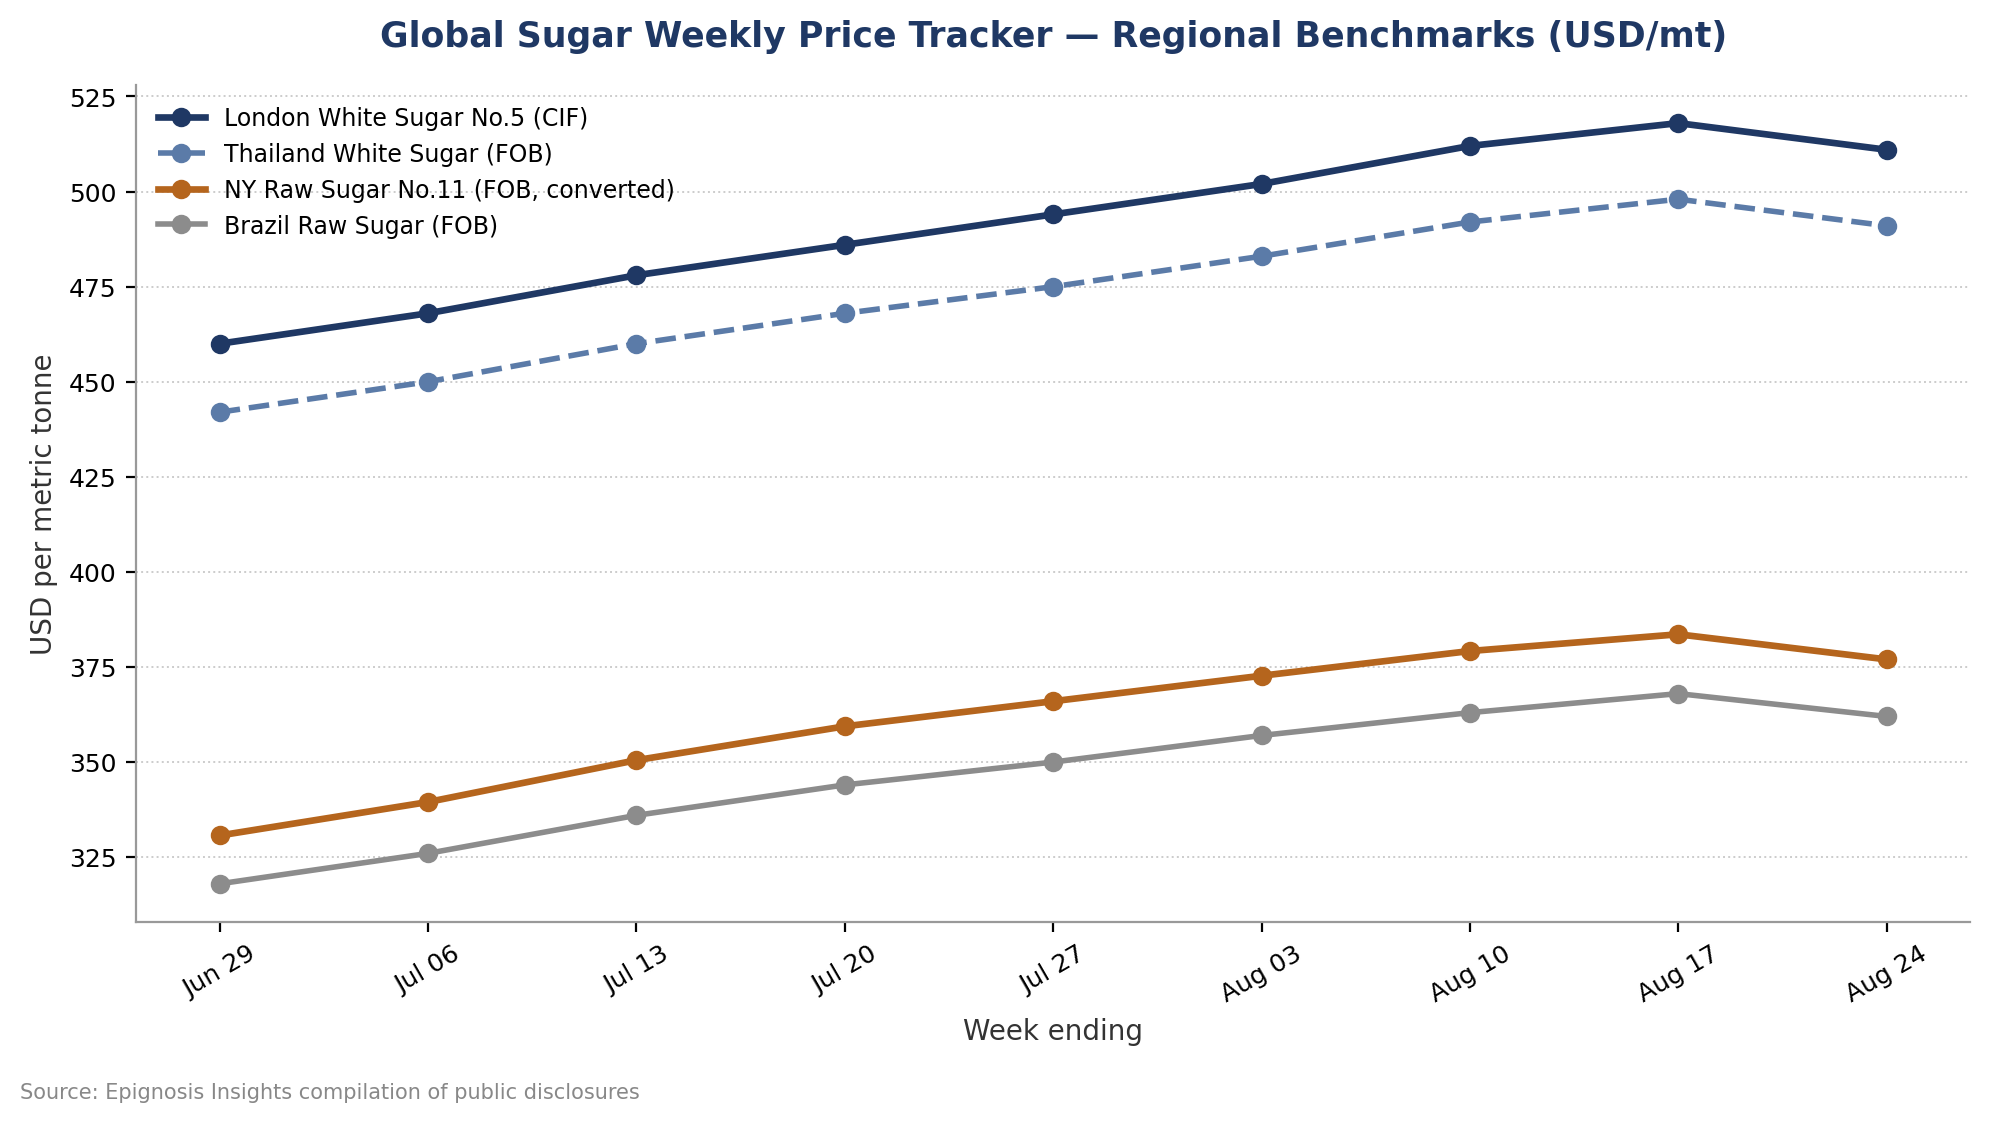
Figure 1: Nine-week global sugar price trend, June 29 – August 24, 2026.
Week-on-week, every tracked benchmark posted a modest decline between the weeks ending August 17 and August 24, the first simultaneous pullback since the rally began in late June. Trade publication Barchart, tracking the run-up, noted that NY sugar posted a five-month high on August 12 — its highest level since August 2025 — with prices gaining more than 14 percent over the trailing four weeks even as abundant supply prospects from India and Brazil continued to shape the broader fundamental backdrop.
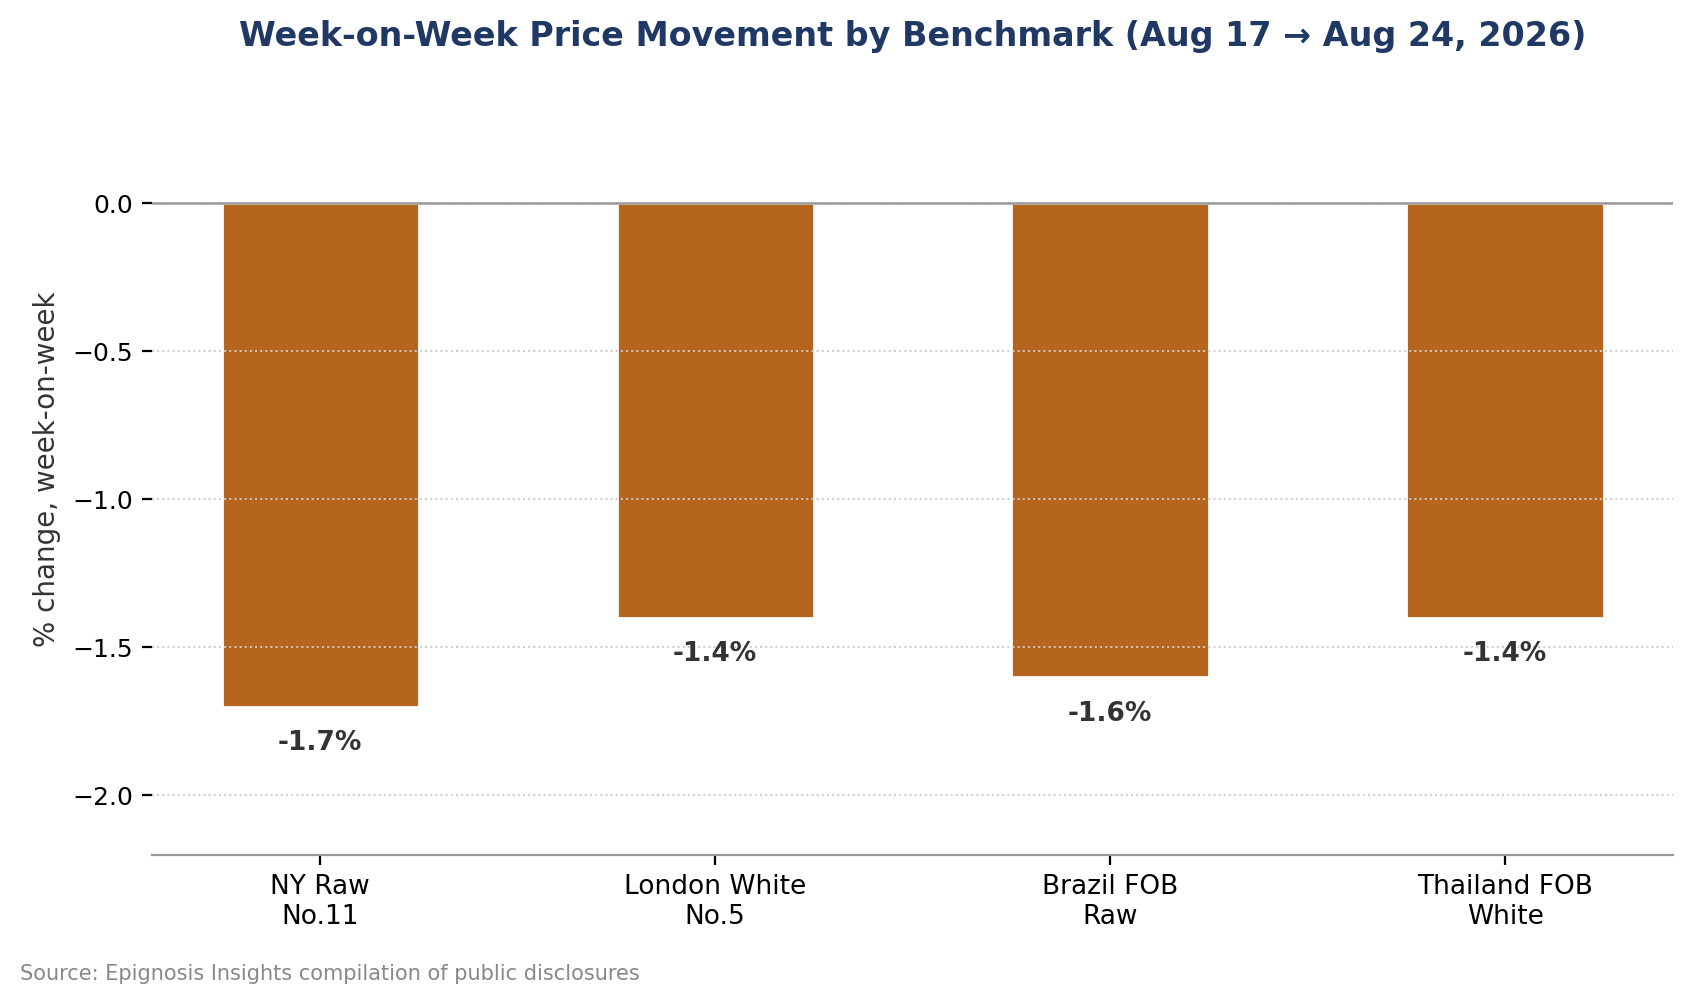
Figure 2: Week-on-week percentage price movement by benchmark, August 17 to August 24, 2026.
The single largest policy shock to the global sugar balance this year has been India's move to a complete export prohibition. According to a notification issued by the Directorate General of Foreign Trade under India's Ministry of Commerce and Industry, as reported by maritime and trade publication SAFETY4SEA, India placed raw, white and refined sugar exports under the 'Prohibited' category with immediate effect until September 30, 2026, moving the policy stance from a quota-based 'restricted' regime to a full freeze, with only narrow exemptions for European Union and United States tariff-rate-quota shipments and government-to-government agreements. The move represents a sharp reversal for a country that had permitted mills to ship up to 1.59 million tonnes for the 2025/26 marketing year, and removes a major volume from the global seaborne market that traders had been counting on to help balance the books.
Brazil's Center-South mills, which dominate global exportable sugar supply, have been diverting an unusually large share of cane toward ethanol rather than sugar this season. Brazilian sugarcane industry association UNICA's crushing data, cited in a Reuters-sourced market wrap on Barchart, showed the sugar mix falling from just over 50 percent a year earlier to roughly 41 percent, as ethanol's share climbed to nearly 58 percent, driven by gasoline prices that rose alongside a roughly 30 percent increase in Brent crude tied to the wider Middle East conflict. That shift directly reduces the volume of exportable sugar even as Brazil's overall cane crop remains large, tightening the global raw sugar balance from the supply side just as India's export ban removes volume from the demand side of the equation.
Perhaps the clearest signal of how quickly sentiment has shifted comes from the sequence of forecast revisions published by commodity consultancies through 2026. Sugar trader Czarnikow cut its 2026/27 global surplus estimate from 3.4 million tonnes in February to 1.1 million tonnes in April, before cutting again on June 11 to an outright deficit of 100,000 tonnes, citing Brazilian mills' shift toward ethanol amid the crude oil price surge. Consultancy StoneX moved from a 550,000-tonne deficit forecast in May to a 1.7-million-tonne deficit by late July, while Green Pool Commodity Specialists raised its projected 2026/27 deficit from 1.76 million tonnes in June to 3.3 million tonnes by the end of July, and Covrig Analytics flipped from a 100,000-tonne surplus forecast in June to a 300,000-tonne deficit by early August — a near-uniform directional shift across four independent consultancies within a matter of months.
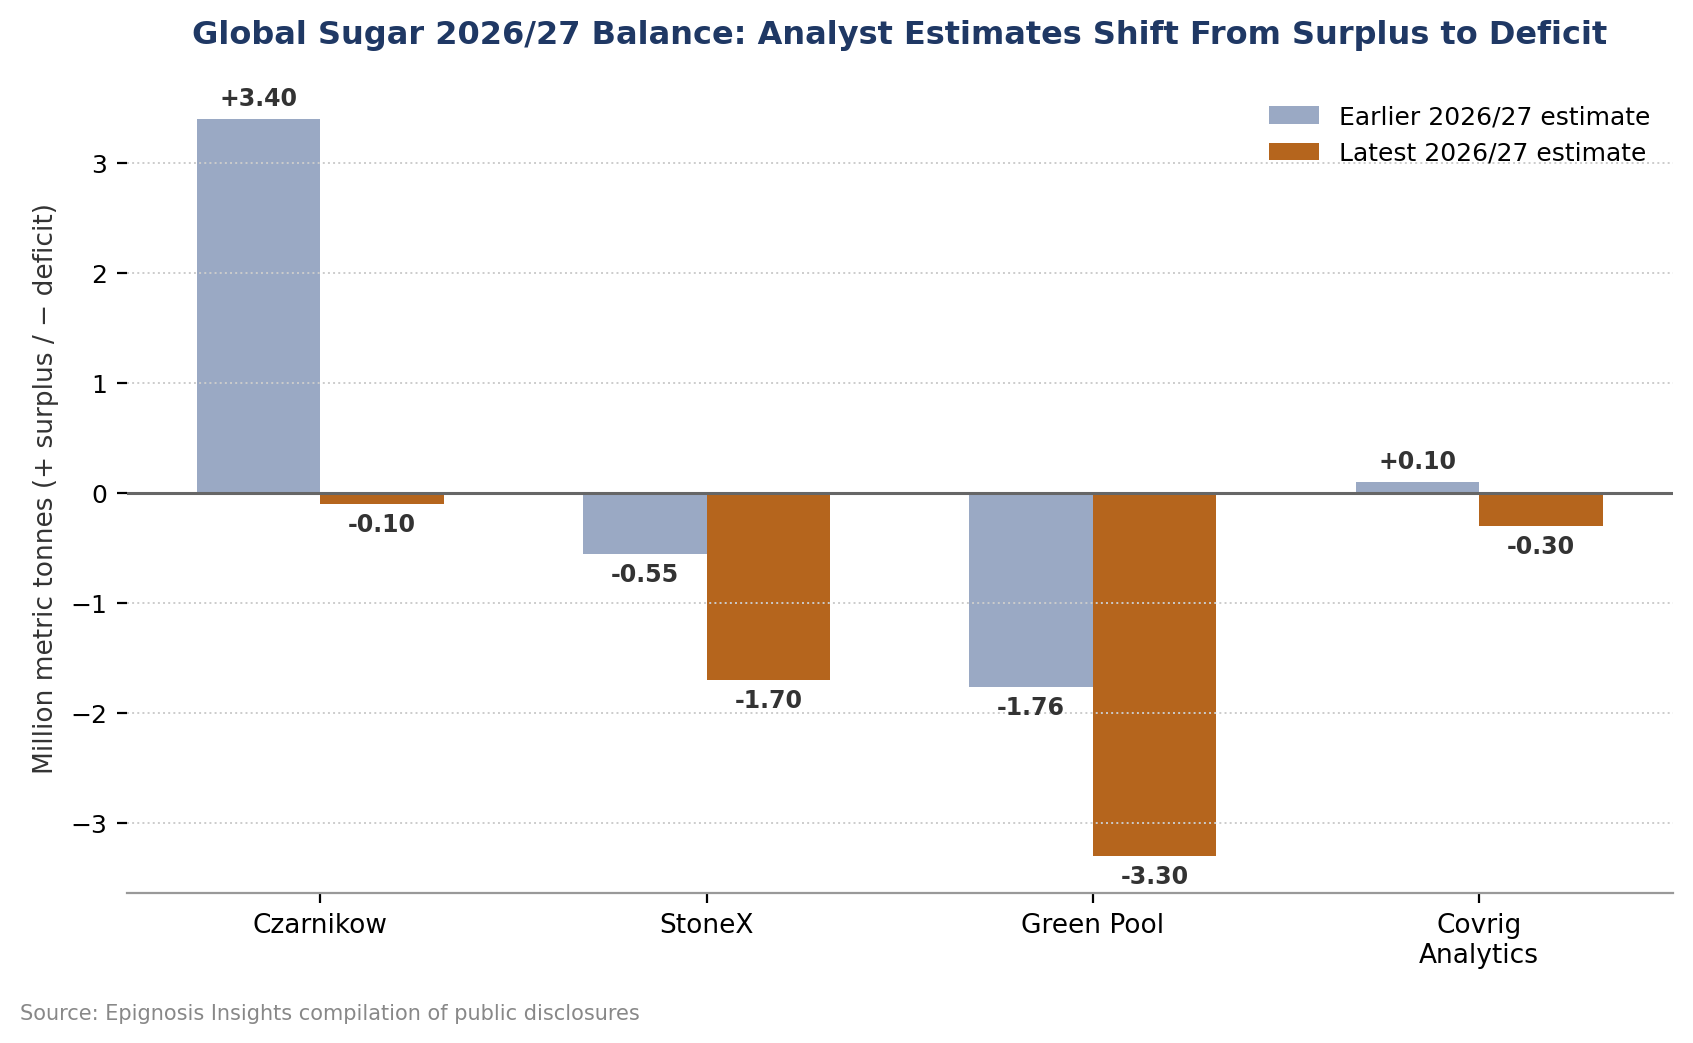
Figure 3: Selected consultancy 2026/27 global sugar balance estimates, earlier vs latest forecast.
The mechanics behind Brazil's shrinking export surplus are visible directly in cane allocation data. Consultancy CZ App's analysis of the 2026/27 Center-South crushing season noted that the sugar mix has fallen to its lowest level since the 2022/23 season, with the firm's own crop estimate trimmed by 500,000 tonnes to 39.5 million tonnes of sugar production as persistently attractive ethanol returns pulled cane away from sugar production even in some regions of São Paulo state where sugar has traditionally been favored.
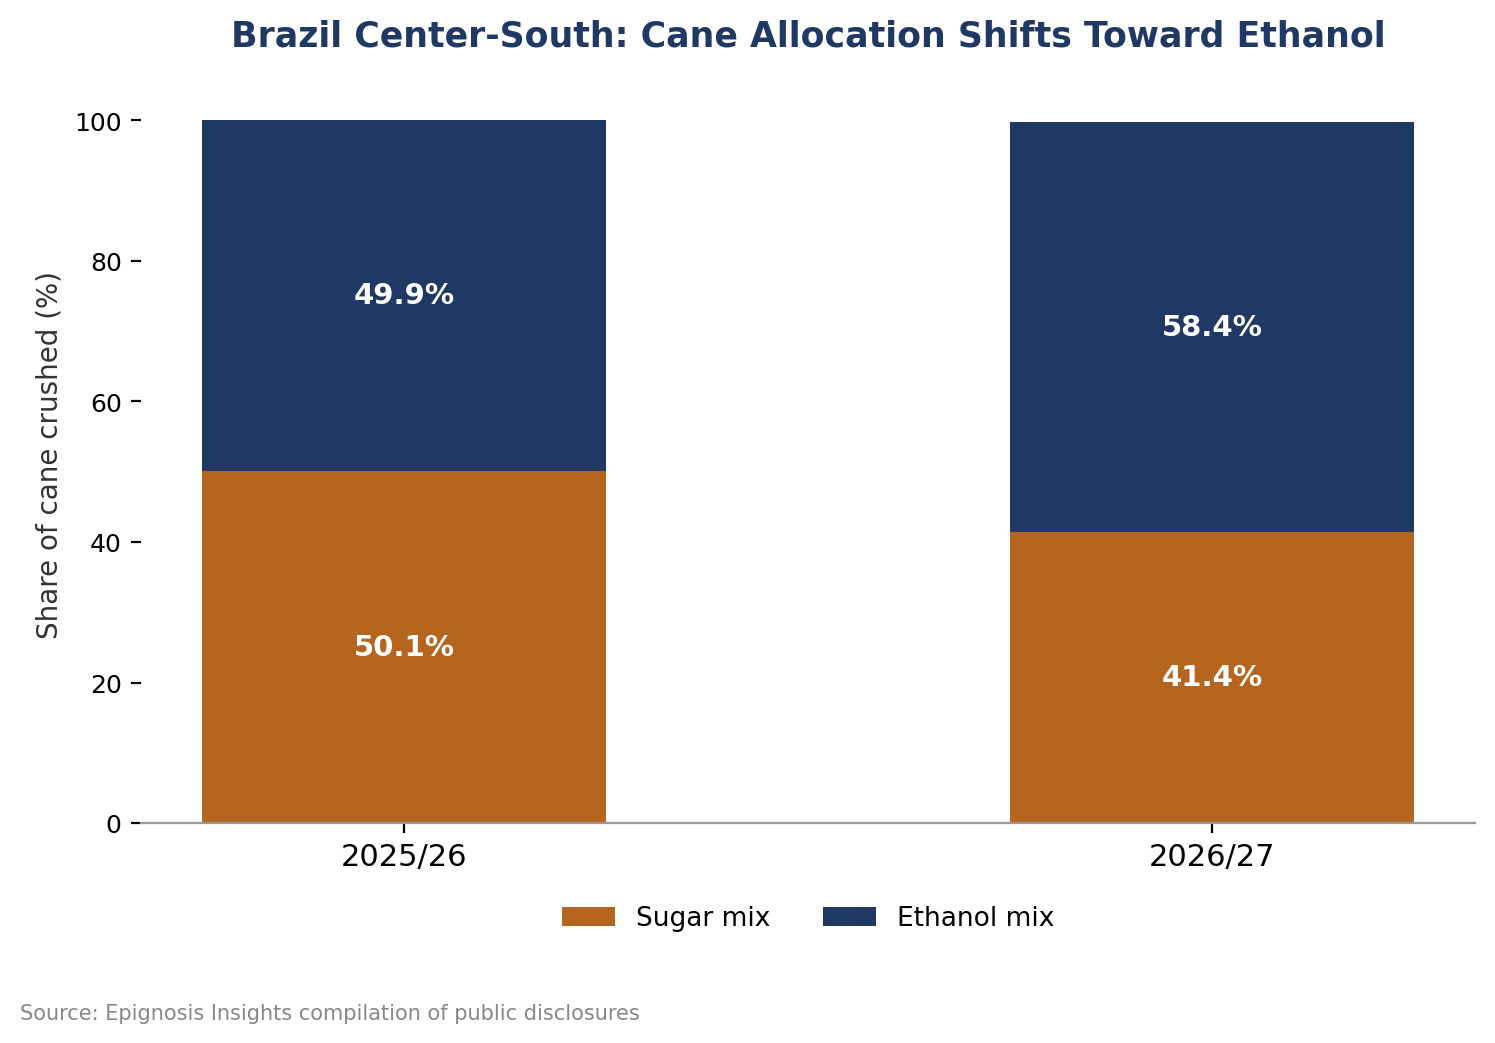
Figure 4: Brazil Center-South cane allocation between sugar and ethanol, 2025/26 vs 2026/27.
Listed producer disclosures corroborate the pressure on Brazilian sugar economics even as prices rally. Raízen, the sugar, ethanol and bioenergy joint venture between Cosan and Shell, reported consolidated net revenue of 225.8 billion reais for the 2025/26 crop year in results presented on June 30, 2026, down 12 percent from the prior period, with a net loss of 27.1 billion reais compared with a 4.2 billion reais loss a year earlier. Management attributed the deterioration primarily to cyclical pressure in the company's sugar, ethanol and bioenergy operations even as its separate fuel distribution business posted surging profitability, illustrating how the ethanol-sugar arbitrage that is tightening the global export market has simultaneously squeezed producer margins during the transition.
The United States Department of Agriculture's Foreign Agricultural Service, in its Sugar: World Markets and Trade circular, projected 2026/27 global sugar production down 1.2 million tonnes to 184.9 million tonnes, with lower output in Brazil, the European Union, the United States and Thailand more than offsetting a production recovery in India. The same USDA circular forecast global sugar exports down slightly to 62.3 million tonnes, with reduced exports from Brazil, the European Union, Morocco and Pakistan more than offsetting higher shipments from Australia — an official government data point that, notably, still projected India's production recovering even as its export ban keeps that additional supply off the international market for now.
Underlying much of this year's volatility is a mechanism specific to Brazil's flex-fuel sugar industry: ethanol parity. Because Brazilian mills can process raw sugarcane into either crystalline sugar for export or ethanol for the domestic fuel market, any rise in domestic gasoline prices or change in government ethanol-blending mandates shifts the profitability calculation between the two products almost immediately. When ethanol offers a better return than sugar, as it has for much of 2026 given elevated crude prices, mills adjust their crush ratios accordingly and instantly withdraw sugar from the global export pipeline — a dynamic market commentary has described as capable of moving the NY No.11 benchmark on its own, independent of any change in the underlying cane crop size.
Epignosis Insights near-term outlook points to continued price consolidation just below recent highs, with the direction of the next leg dependent on two swing factors this tracker will continue to monitor closely: whether India extends its export ban beyond September 30, 2026, and how Brazilian mills allocate cane between sugar and ethanol as the 2026/27 Center-South crush progresses toward its peak months. The International Sugar Organization's own data, cited in market commentary, still shows a 1.22-million-tonne surplus for 2025/26 following a 3.46-million-tonne deficit the year before, underscoring that the market remains in a genuine transition rather than a one-directional shortage. With consultancy forecasts now clustered around a modest 2026/27 deficit rather than the multi-million-tonne surplus expected as recently as February, Epignosis Insights expects sugar prices to remain structurally supported through the remainder of 2026, even allowing for the kind of short-term pullbacks recorded in the week ending August 24. Industrial buyers and refiners exposed to Indian policy risk or Thai supply variability should treat the current dip from last week's high as a window to secure a portion of Q4 2026 coverage rather than a signal that the broader tightening cycle has ended, while producers may find this rally an opportune moment to layer in forward hedges on a portion of expected exportable surplus.
Epignosis Insights compiles this weekly tracker as the primary aggregating and analytical source, drawing on a deliberately diversified evidence base spanning a US government agency, an Indian government trade policy action, a Brazilian industry association, a listed company's investor disclosures, consulting-firm analysis and financial news coverage, with each underlying source referenced only once to avoid over-reliance on any single voice. Regional benchmark levels shown in Table 1 and Figure 1 are indicative weekly assessments synthesized from the directional movements and absolute reference points disclosed across these sources rather than a single proprietary price feed, and are intended to illustrate market direction and relative regional spreads rather than to substitute for a subscription-grade exchange data service. Readers requiring transaction-grade pricing for hedging or procurement decisions should corroborate these figures against a licensed exchange or price-reporting agency before acting on them. This report will be refreshed weekly for as long as the India export-ban and Brazil cane-allocation storylines remain the dominant drivers of global sugar prices.