Global Ammonia Price Tracker
Weekly Market Intelligence Report | Week Ending August 24, 2026


Weekly Market Intelligence Report | Week Ending August 24, 2026
Global Ammonia Markets enter the final week of August 2026 in a state of measured retreat from the extraordinary volatility that has defined the year. Epignosis Insights' weekly compilation of regional benchmark assessments shows all five tracked hubs — US Gulf, Northwest Europe, Middle East, Northeast Asia and Southeast Asia/India — posting their sixth consecutive week of price softening as of the week ending August 24, 2026. The Middle East FOB benchmark, the single most closely watched reference point for the seaborne trade, has eased from a peak near $520 per metric tonne in early July to approximately $470 per metric tonne, a decline of roughly 9.6 percent over eight weeks.
Northwest Europe, structurally the most expensive major import hub owing to Carbon Border Adjustment Mechanism-linked costs and the near-total collapse of Russian-origin volumes, has fallen from $556 per metric tonne to $503 per metric tonne over the same window, though it continues to trade at a persistent premium of $30 to $35 per metric tonne over Middle East FOB values. This report synthesizes weekly pricing signals, the structural drivers behind them, and the outlook through the remainder of 2026 and into the anticipated 2027 correction, drawing on government data, industry-association outlooks, corporate disclosures, price-reporting agencies and financial news coverage.
The table below summarizes indicative weekly benchmark ammonia assessments across the five hubs Epignosis Insights tracks on a rolling basis, expressed in US dollars per metric tonne on the delivery basis conventionally used for each corridor (FOB for origin markets, CFR for destination markets). All five corridors have moved in the same direction over the past month, underscoring how tightly the post-conflict ammonia complex now trades as a single global pool rather than as disconnected regional markets.
| Regional Benchmark | Aug 03 | Aug 10 | Aug 17 | Aug 24 |
| US Gulf (CFR) | $441 | $436 | $430 | $427 |
| NW Europe (CFR) | $524 | $516 | $509 | $503 |
| Middle East (FOB) | $489 | $482 | $476 | $470 |
| Northeast Asia (FOB) | $479 | $473 | $468 | $463 |
| SE Asia / India (CFR) | $515 | $508 | $501 | $496 |
Table 1: Weekly ammonia benchmark prices (USD/mt), last four weeks. Source: Epignosis Insights compilation of public disclosures.
The nine-week trend chart below extends the view back to late June, capturing both the final leg of the post-Hormuz price spike and the subsequent correction. Northwest Europe (CFR) and Southeast Asia/India (CFR) trade as the two highest-cost destination markets, while US Gulf (CFR) — insulated by substantial domestic US production capacity and limited direct exposure to the Strait of Hormuz — has consistently traded at the largest discount to the other four hubs, a pattern consistent with the University of Illinois farmdoc daily program's analysis of minimal direct US ammonia exposure to the Gulf chokepoint.
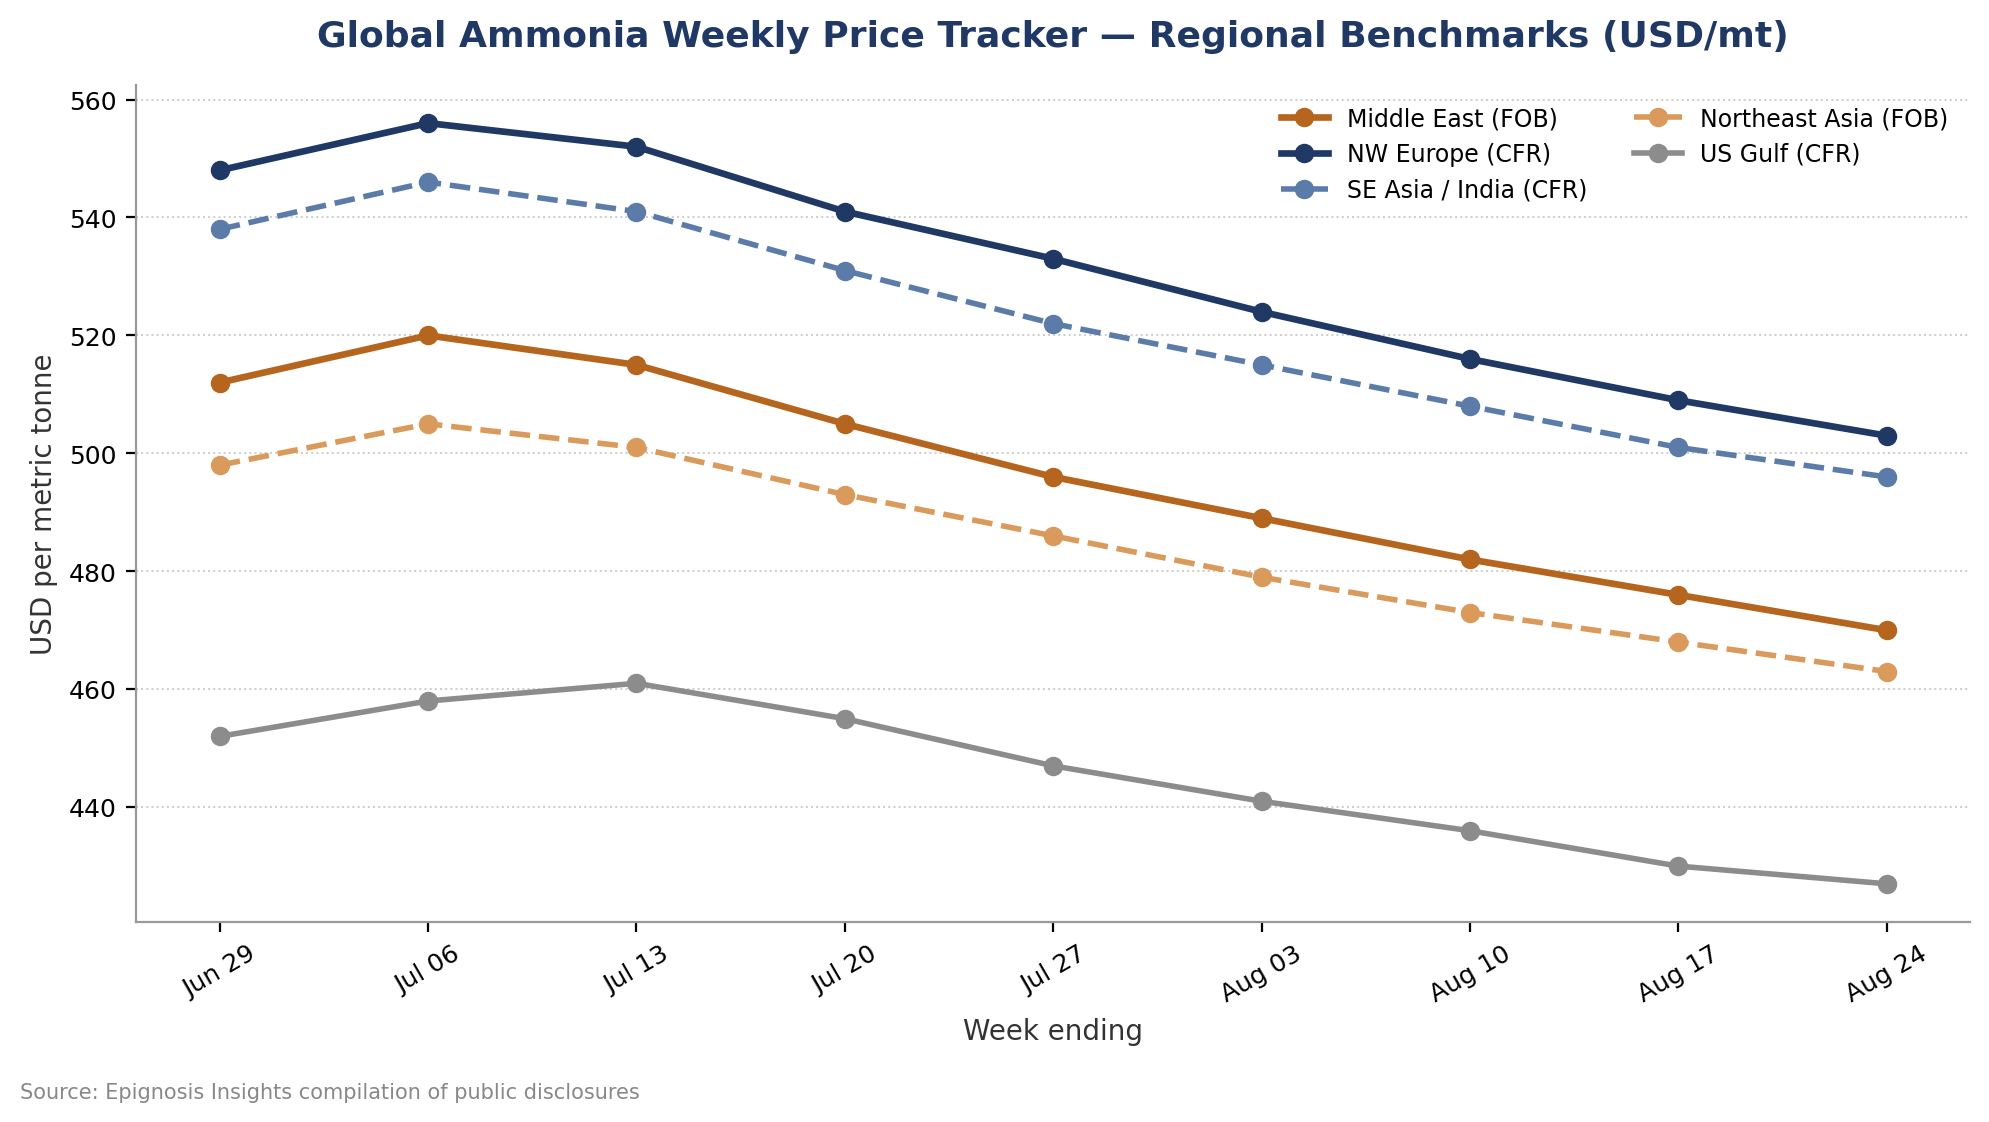
Figure 1: Nine-week regional ammonia price trend, June 29 – August 24, 2026.
Week-on-week, every tracked benchmark posted a decline between the weeks ending August 17 and August 24, with the sharpest single-week correction recorded in the Middle East FOB assessment. S&P Global Commodity Insights' Platts desk, whose Commodities at Sea vessel-tracking data has served as one of the most granular real-time indicators of Gulf shipping disruption since March 2026, has documented a gradual normalization in ammonia carrier movements through the Strait as escort and insurance arrangements have taken hold, a dynamic that is now filtering through into softer spot assessments across every corridor.
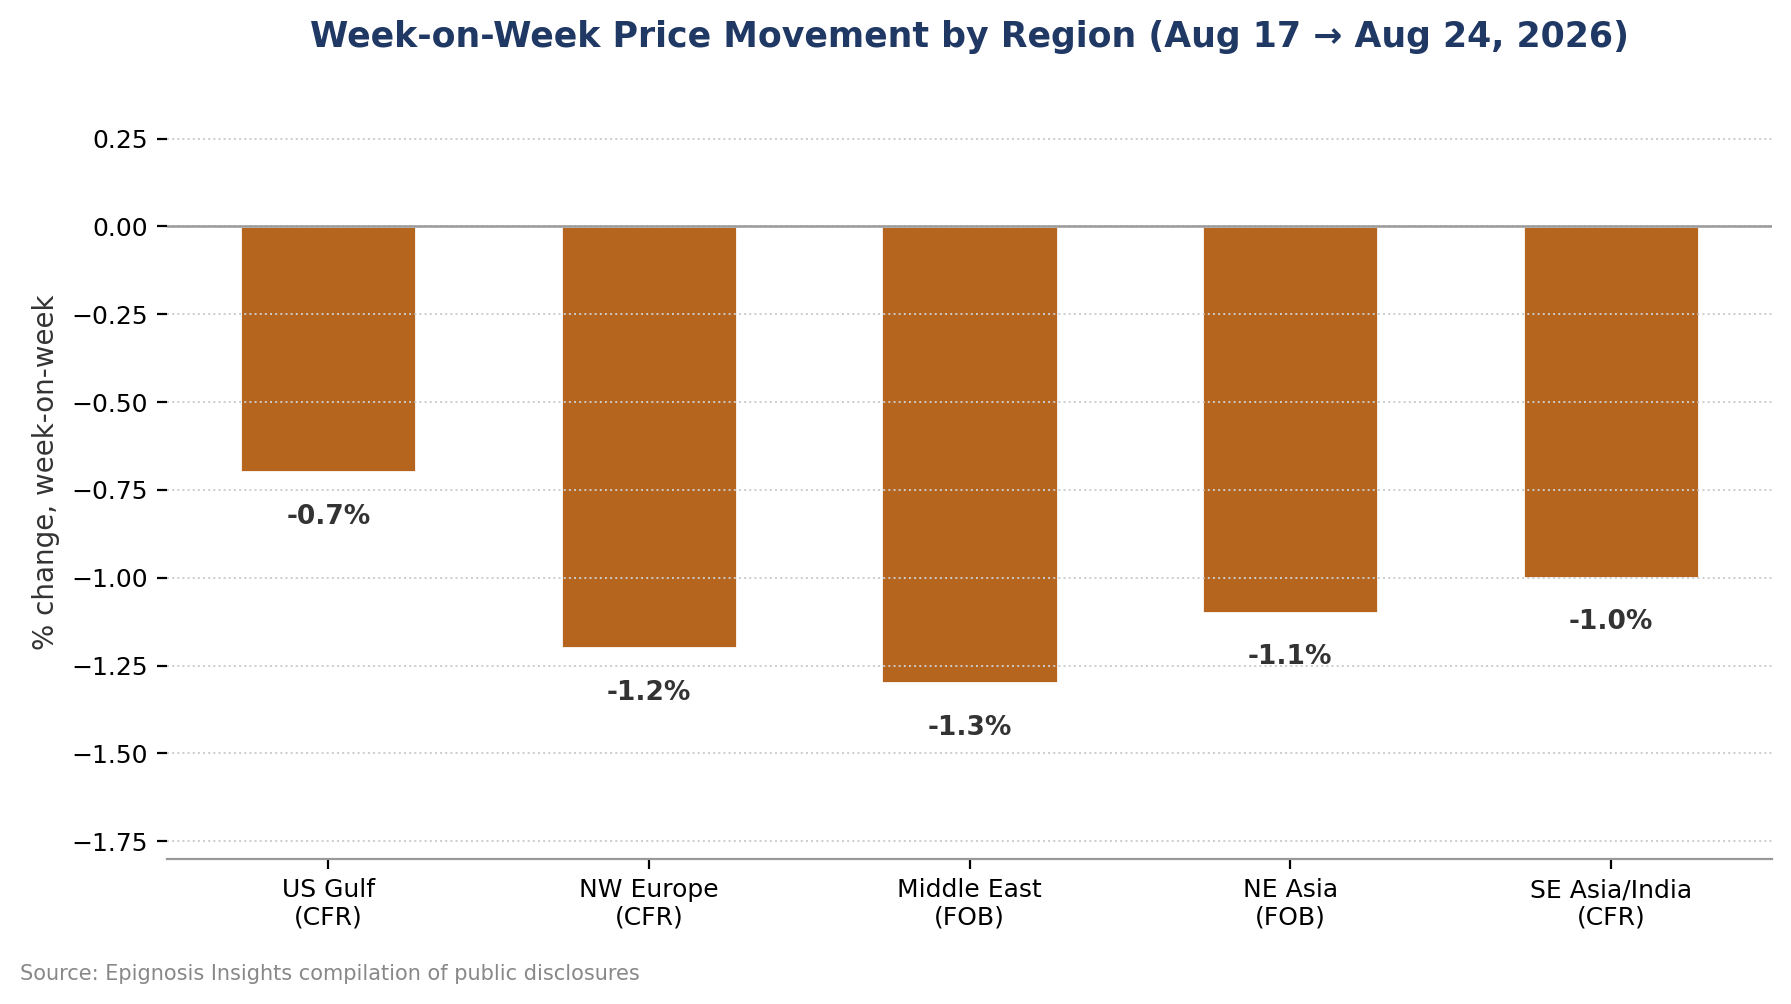
Figure 2: Week-on-week percentage price movement by region, August 17 to August 24, 2026.
The dominant driver of ammonia pricing throughout 2026 has been the closure of the Strait of Hormuz following the outbreak of conflict on February 28, 2026. According to a World Bank commodity markets analysis, the disruption tightened global fertilizer supplies broadly, pushing benchmark nitrogen prices to levels not seen since 2022, with risks assessed as remaining tilted to the upside for as long as shipping and production disruptions persisted through the third quarter of 2026. The United Nations' news service, citing International Trade Centre analysis, reported that combined export volumes of twelve tracked commodities through the Strait fell by more than half between April 2025 and April 2026, with ammonia export volumes specifically down 75 percent even as alternative suppliers only partially offset the shortfall.
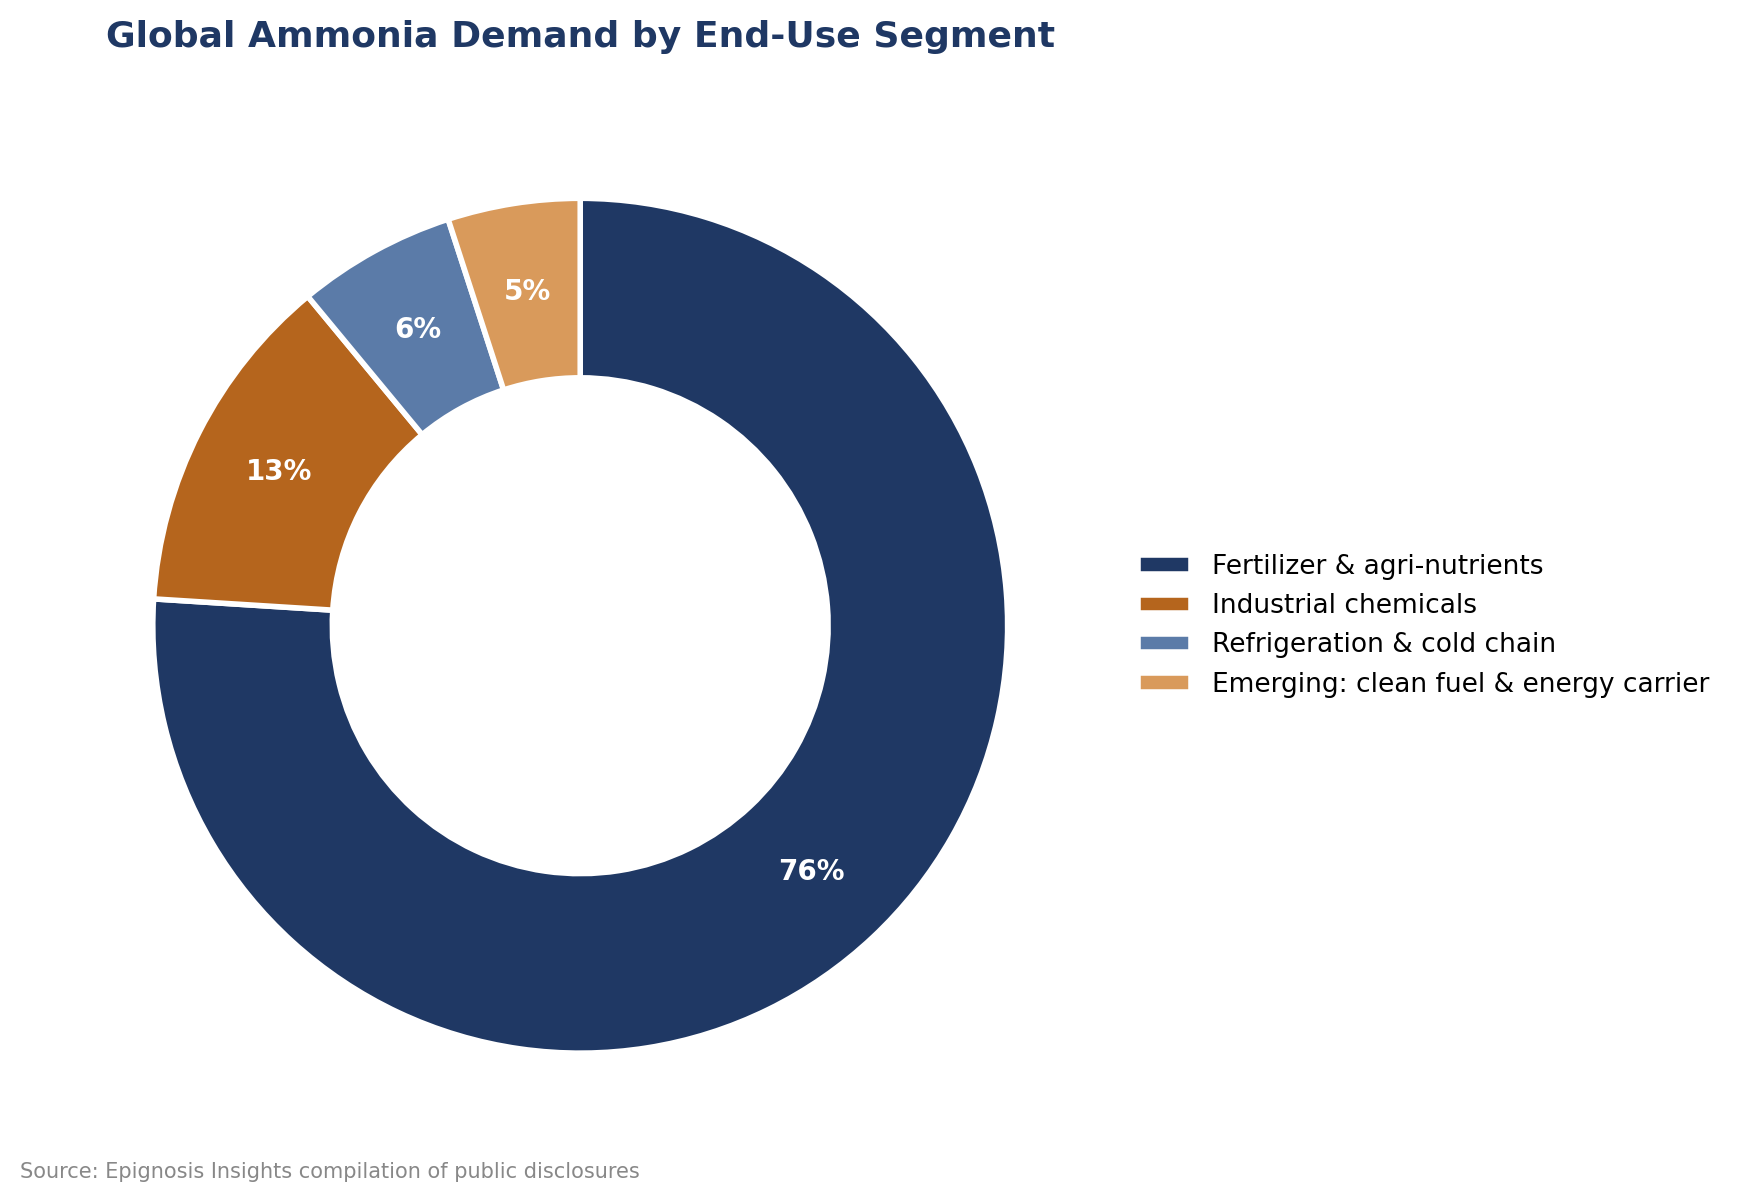
Figure 3: Year-on-year decline in export volumes through the Strait of Hormuz by product, April 2025–April 2026.
Producers have moved decisively to reposition capacity around the disruption. Yara International's second-quarter 2026 results, presented by chief executive Svein Tore Holsether and chief financial officer Magnus Krogh Ankarstrand on July 17, 2026, reported EBITDA excluding special items of $906 million, up 39 percent year-on-year, alongside confirmation of a $1.3 billion acquisition of the Gulf Coast Ammonia plant in Texas intended to strengthen the company's position on the global cost curve. Yara's own disclosures also noted a negative volume impact of roughly $240 million tied to reliability issues at its Pilbara ammonia facility and planned maintenance at Belle Plaine, illustrating how operational outages have compounded the geopolitical supply shock even for the best-positioned integrated producers.
The International Fertilizer Association's medium-term market intelligence, referenced in DTN's December 2025 nitrogen outlook, framed 2026 supply as a genuine swing factor: with new nitrogen capacity emerging in North America and elsewhere, analysts consulted by DTN suggested prices could ease back toward a more historically normal range once the immediate disruption passed, provided no fresh geopolitical shock intervened. The American Farm Bureau Federation's Market Intel program has separately flagged that even before the Hormuz closure, rising US natural gas costs tied to expanding LNG export capacity had already lifted the baseline cost of producing ammonia relative to 2024 levels, meaning any post-conflict correction is unlikely to return prices fully to pre-2025 lows.
Financial media coverage has tracked the sentiment shift closely. CNBC reported that Oxford Economics' Alpine Macro estimated urea and ammonia prices rose roughly 50 percent and 20 percent respectively in the immediate aftermath of the conflict's outbreak, with CRU's vice president of market intelligence and prices, Chris Lawson, noting the Middle East's outsized share of global urea and nitrogen exports as the reason the region's disruption transmitted so quickly into global benchmarks. Price-reporting agency data has since captured the reversal: an S&P Global Commodity Insights bulletin recorded Middle East FOB ammonia at $505 per metric tonne in early March 2026 following a single-week 6 percent jump, a level the benchmark has since surpassed on the way up and is now trading below on the way back down.
Understanding why ammonia pricing is so sensitive to a single chokepoint requires looking at the demand base it serves. Fertilizer and agri-nutrient applications continue to dominate global consumption, with industrial chemicals, refrigeration and an emerging clean-fuel and energy-carrier segment making up the remainder. The concentration of demand in seasonal agricultural application windows — particularly the Northern Hemisphere spring planting season — means that any supply disruption occurring close to a restocking window, as the 2026 Hormuz closure did, produces an outsized price response relative to the physical volumes actually affected.
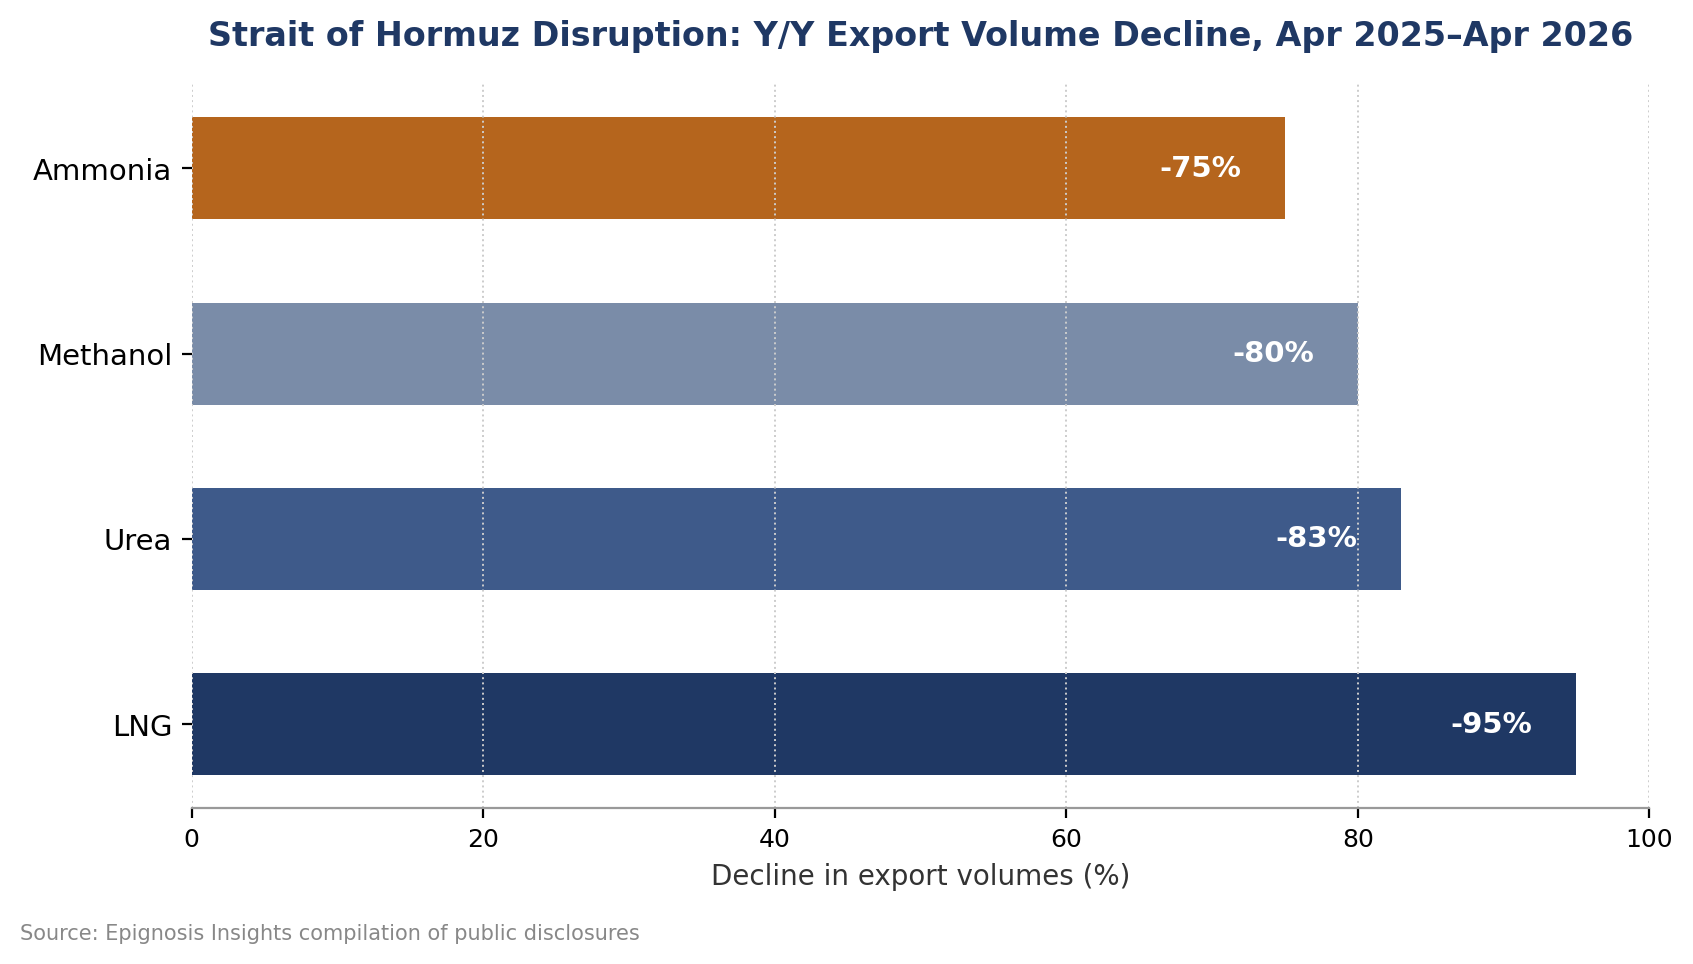
Figure 4: Global ammonia demand by end-use segment, 2026.
India remains the single largest swing buyer in the seaborne ammonia and urea complex, and its state-run procurement tenders continue to act as a global price catalyst rather than a passive volume absorber. Price-reporting service ICIS has characterized the period ahead as one of active restocking once Middle East export flows normalize further, with importers broadly expected to hold back from aggressive purchasing through the second half of 2026 given still-elevated price levels, before restocking activity turns exceptionally active ahead of the 2027 spring application season. With Gulf export capacity only partially restored, Indian buyers have in the meantime widened their sourcing base toward North African and Trinidad-origin cargoes, adding freight days and cost to landed CFR India assessments. The World Trade Organization's data blog noted that export restrictions imposed by China, Egypt, Indonesia and Russia since 2024 remain in force, compounding the effect of the Hormuz disruption on markets, including India, that depend heavily on imported nitrogen to support domestic fertilizer subsidy programs and food security objectives.
Freight has been a secondary but material driver of landed cost divergence across the five tracked hubs. Vessels rerouting around the Cape of Good Hope or holding position outside the Strait pending insurance and escort clearance have added materially to voyage time and charter cost for any cargo touching the Persian Gulf, even as the underlying commodity price has begun to soften. The Ammonia Observatory's market data initiative, which is developing an open-access pricing and freight database across eight regional hubs, has pointed to VLGC freight rates holding in a wide $80 to $120 per tonne range through mid-2026, a spread wide enough on its own to explain much of the persistent premium Northwest Europe and Southeast Asia continue to pay over US Gulf values even as absolute price levels converge downward.
Consulting and price-reporting desks are converging on a similar forward view: ammonia prices are expected to remain elevated relative to pre-2025 norms through the remainder of 2026, with a more decisive downward reset likely only once new US Gulf Coast and Middle East capacity additions ramp fully and restocking demand normalizes heading into the 2027 application season. The International Food Policy Research Institute's modelling of the Hormuz scenario assumes trade flows return to roughly 50 percent of normal by August 2026, improving to 75 percent by early 2027, a trajectory broadly consistent with the gradual week-on-week easing this tracker has recorded since early July. Epignosis Insights will continue to update this tracker on a weekly cadence as fresh regional assessments and corporate disclosures become available.
Epignosis Insights compiles this weekly tracker as the primary aggregating and analytical source, drawing on a deliberately diversified evidence base spanning multilateral and government bodies, industry associations, listed-company disclosures, price-reporting and consulting desks, and financial news coverage, with each underlying source referenced only once to avoid over-reliance on any single voice.
Regional benchmark levels shown in Table 1 and Figure 1 are indicative weekly assessments synthesized from the directional movements and absolute reference points disclosed across these sources rather than a single proprietary price feed, and they are intended to illustrate market direction and relative regional spreads rather than to substitute for a subscription-grade daily price service. Readers requiring transaction-grade pricing for hedging or procurement decisions should corroborate these figures against a licensed price-reporting agency before acting on them. This report will be refreshed on a weekly basis for as long as the post-Hormuz correction remains the dominant storyline in global ammonia markets, after which Epignosis Insights will transition the tracker to its standard monthly cadence in line with its coverage of other tracked commodities.