
Specialty vs. Commodity Chemicals: Why Margins Diverge So Sharply

In 2025, two large chemical companies faced the same weak industrial demand. One halved its dividend; the other raised it. The difference was not luck or execution in a single year. It was the business model: whether a company sells a molecule priced by the market or a performance outcome priced by the customer. That distinction explains why margins across the chemical industry are pulling further apart, not converging.
Two Companies, One Downturn
The Commodity Experience
Dow’s 2025 annual report shows net sales of $40.0 billion, down 7%, with the entire decline driven by a 7% fall in local prices while volume was flat. Operating EBITDA came in at $3.3 billion, a margin of roughly 8%, and the company announced a 50% dividend reduction in mid-2025. Dow sold the same tonnes; it simply earned far less on each of them. That is the defining signature of a commodity downturn: utilisation can hold up while profitability collapses, because the market price, not the producer, sets the outcome.
The Specialty Experience
Sika, the construction and industrial chemicals group, reported 2025 sales of CHF 11.2 billion, up 0.6% in local currencies despite a sharp slump in Chinese construction. Its material margin widened to 54.9% from 54.5%, its EBITDA margin was 18.4%, and it proposed raising the dividend to CHF 3.70. That margin is more than double Dow’s in the same macro environment.
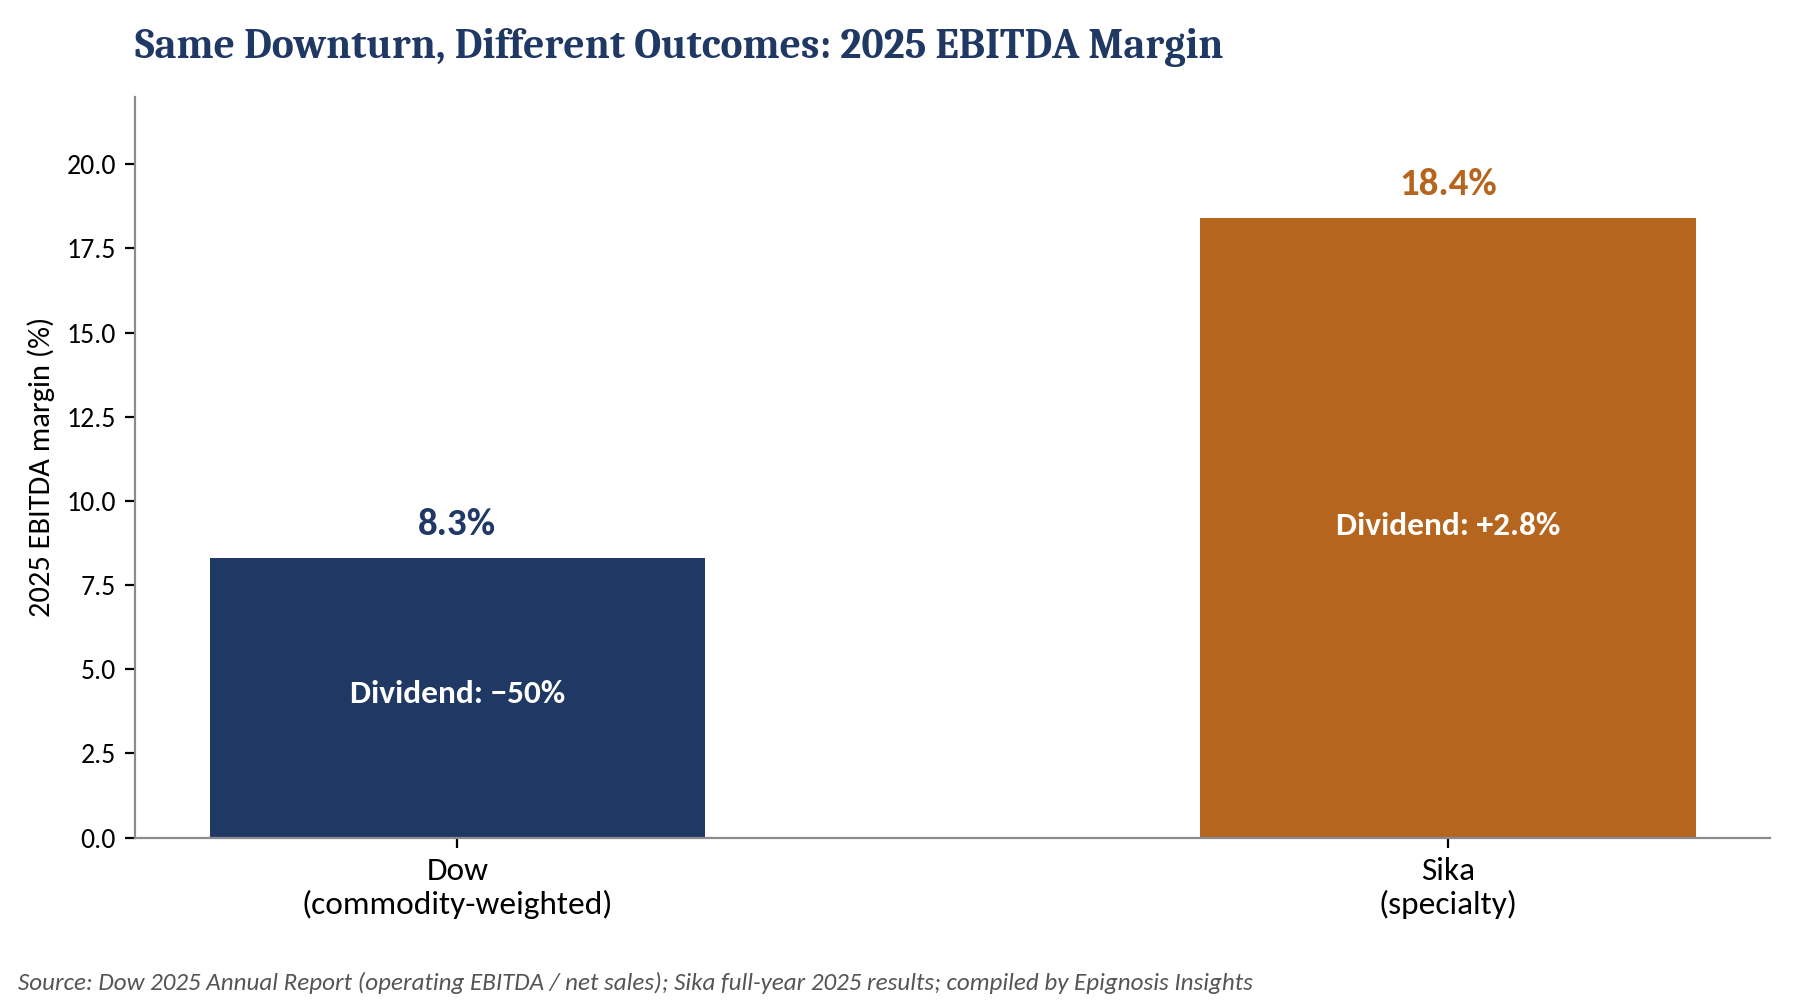
Figure 1: 2025 EBITDA margin and dividend action
Why the Gap Exists
Price Takers Versus Price Makers
Commodity producers sell interchangeable molecules priced against global benchmarks, so their margin is the spread between product price and feedstock cost, and neither side is in their control. Specialty players sell formulations specified into a customer’s process, often after months of testing. Switching suppliers means requalification risk for the buyer, so prices are set on the value delivered rather than on the cost of inputs. Raw materials also make up a far smaller share of the final selling price, so a spike in feedstock costs can be passed through with a lag instead of eroding the margin outright. Research and technical service spending, which looks like overhead in a commodity business, is what protects that position.
Feedstock Exposure Amplifies the Cycle
The U.S. Energy Information Administration reports that the Henry Hub gas benchmark averaged $3.52 per MMBtu in 2025, up 56% from 2024. For a gas- or ethane-based producer, a move of that size reshapes the regional cost curve within one year. For a formulator whose selling price is dominated by know-how, application service and brand, it is a manageable line in the bill of materials.
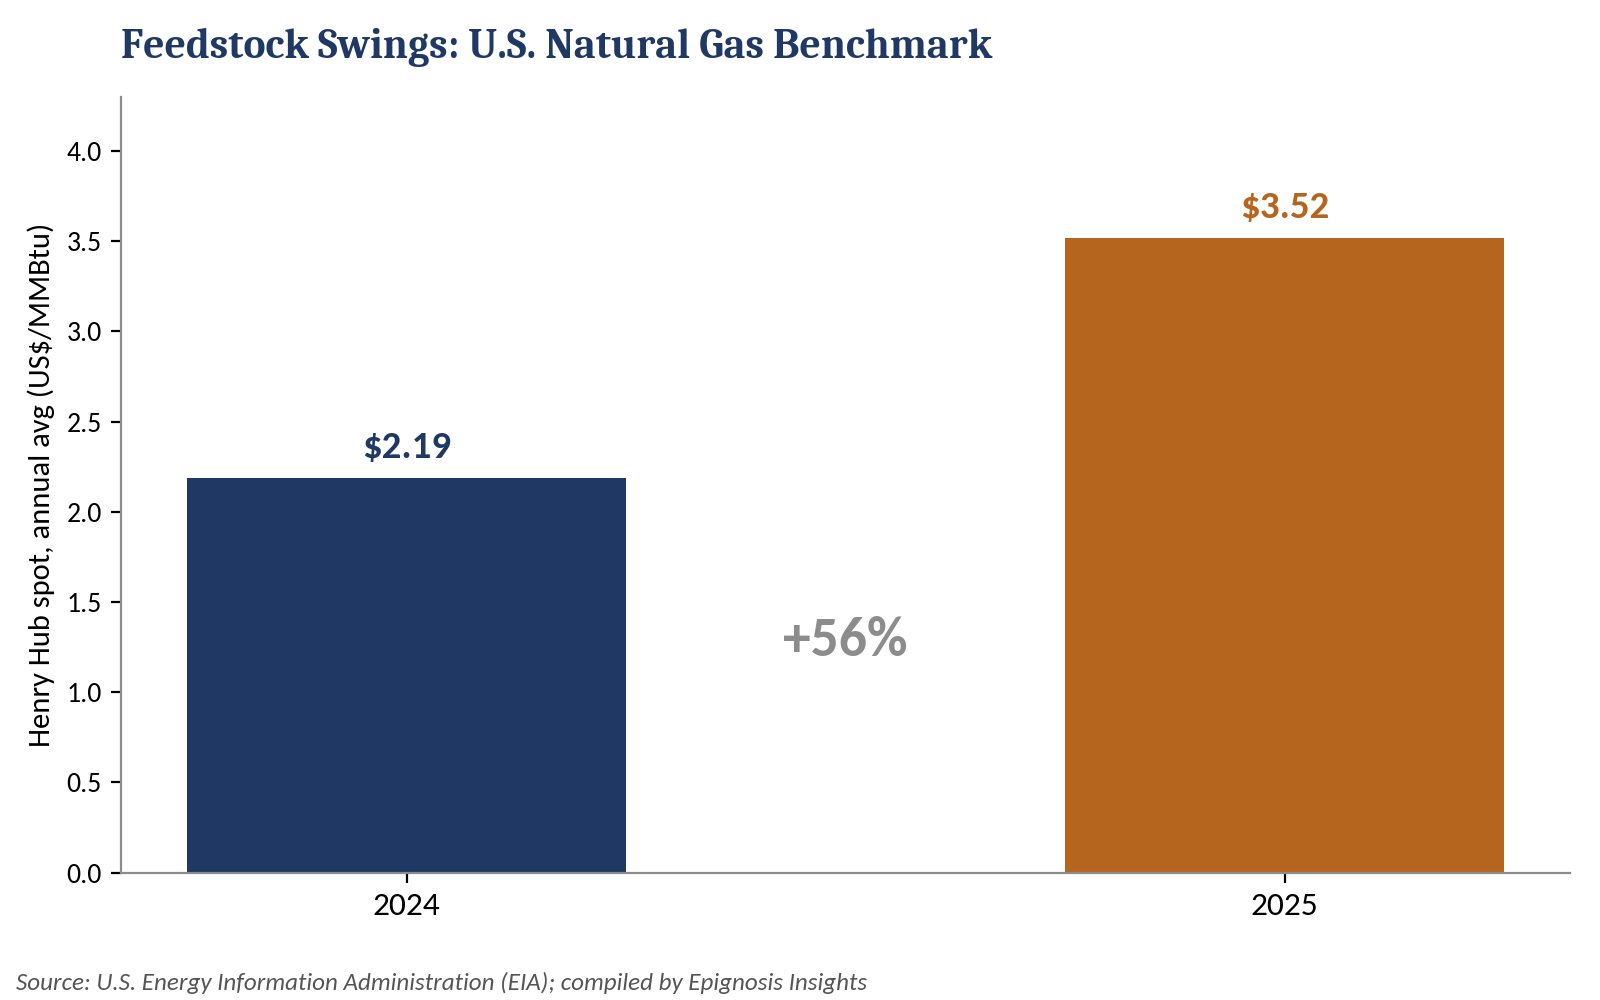
Figure 2: U.S. natural gas benchmark, annual average
Overcapacity Hits the Bottom of the Value Chain First
China’s Capacity Wave
Oliver Wyman estimates China now holds around 50% of global chemical capacity, up from about 15% two decades ago, and is building roughly 70% of new additions through 2027. Most of that build sits in standardized petrochemicals and polymers, exactly where products compete on price alone and where a single new world-scale plant can reset regional margins.
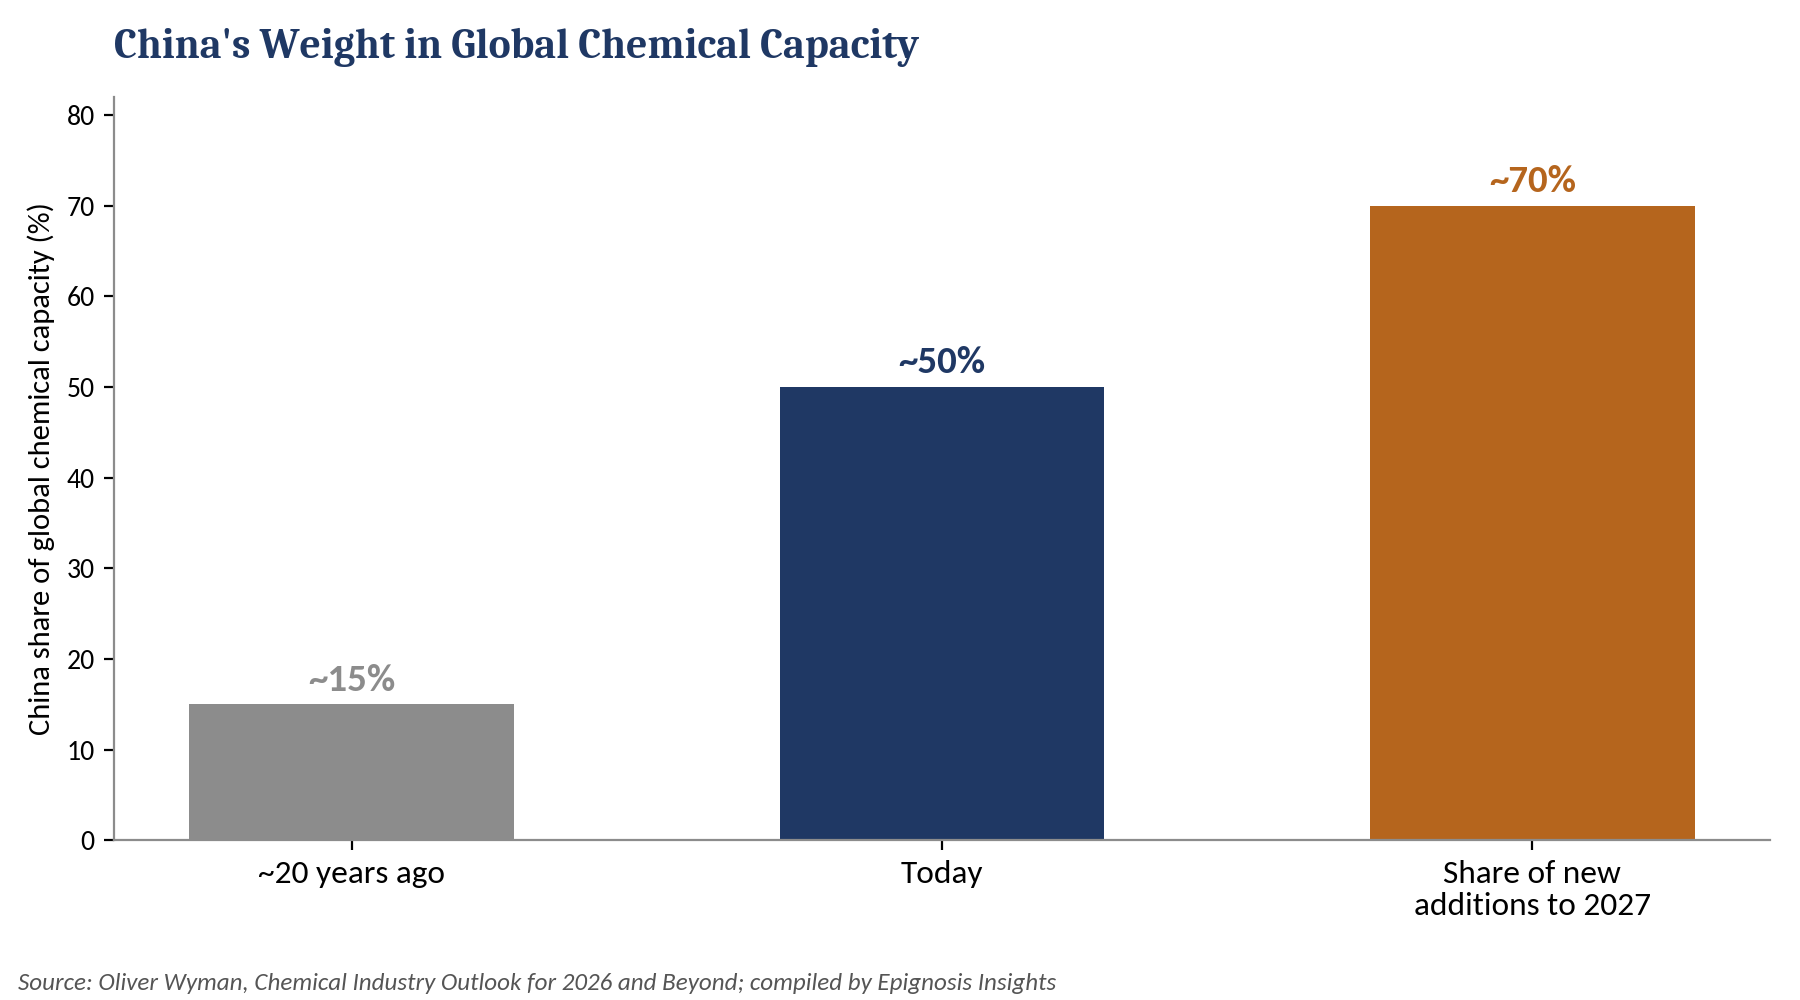
Figure 3: China’s share of global chemical capacity
Europe’s Closures Follow the Same Fault Line
Data from Cefic, the European Chemical Industry Council, show announced closures between 2022 and 2025 hit upstream petrochemicals hardest at 17.8 Mt, about 14% of that segment’s capacity. Specialty chemicals lost 2.0 Mt, around 4%. Energy-intensive, undifferentiated assets are being shut first because they have no pricing lever to offset high European costs. The closures also remove integrated feedstock from European clusters, which could eventually raise input costs for downstream specialty producers that rely on local supply.
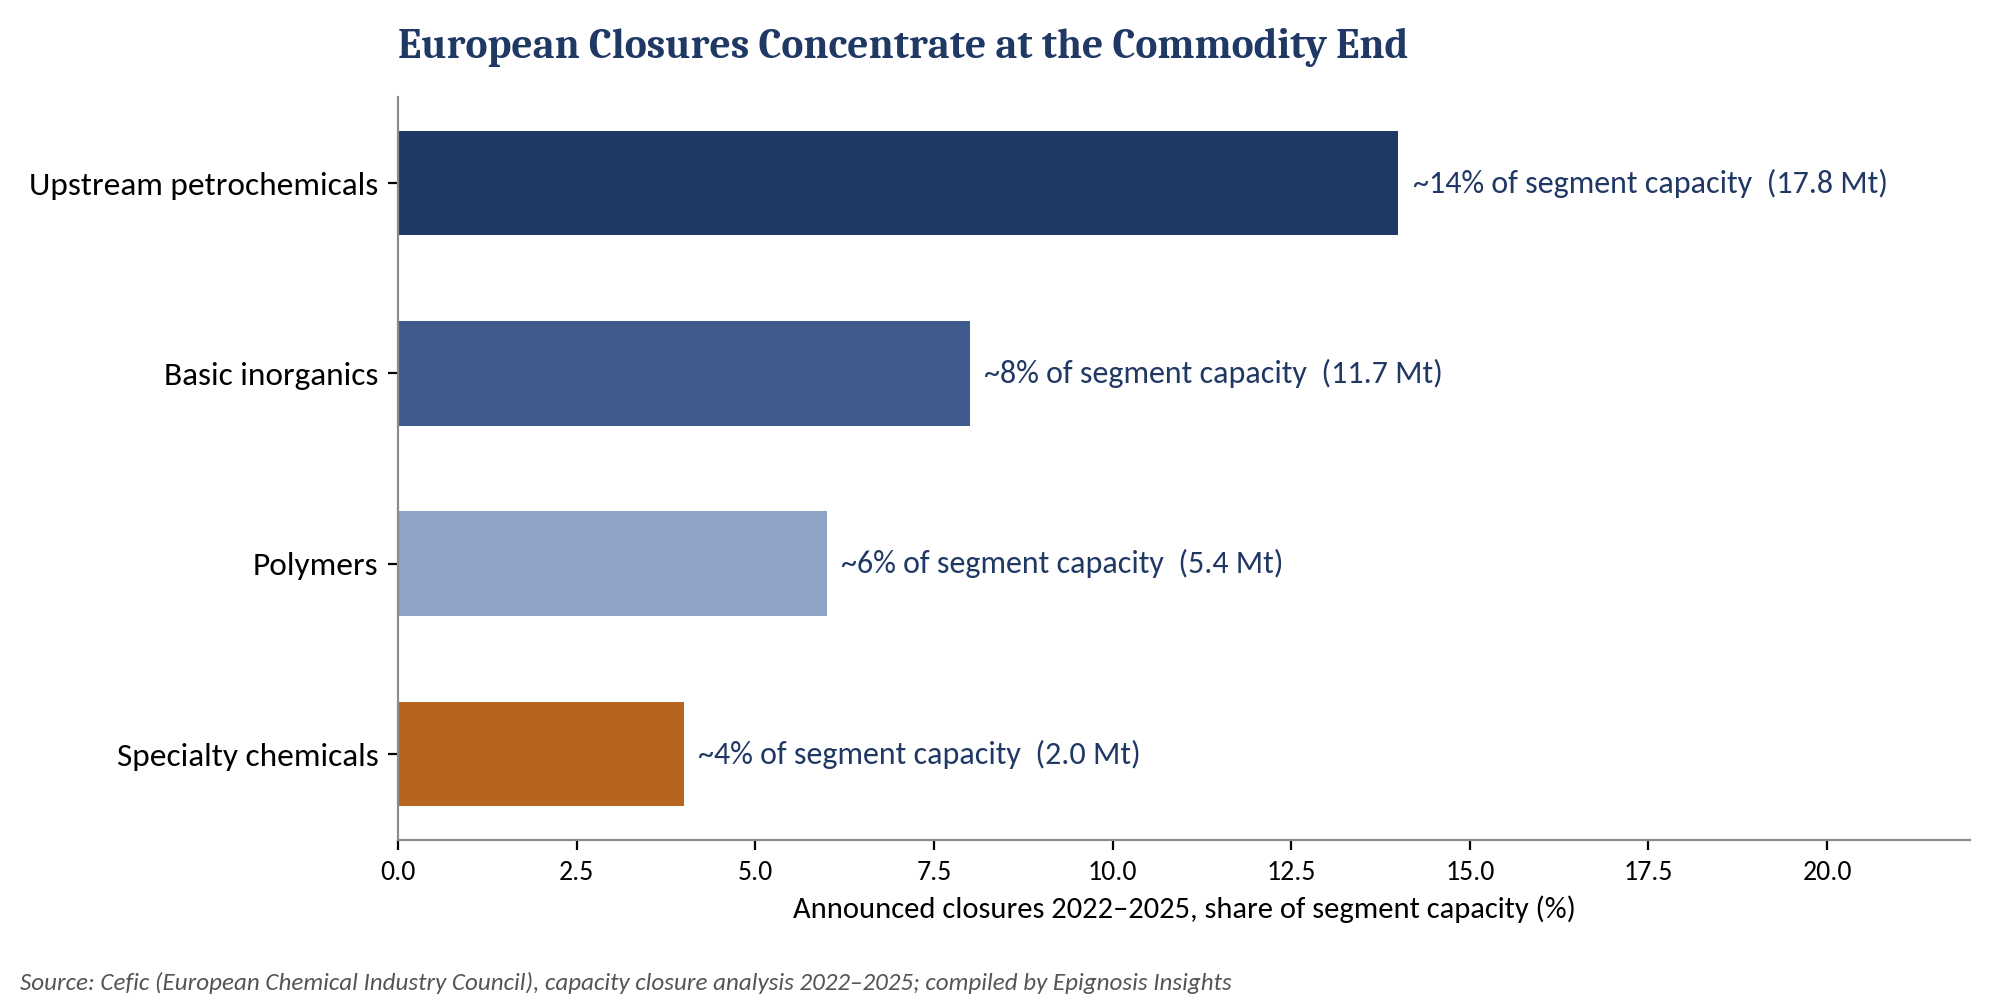
Figure 4: European capacity closures by segment, 2022–2025
Shareholder Payouts Under Strain
Reuters reported in February 2026 that LyondellBasell cut its quarterly dividend to $0.69 from $1.37 per share, joining Dow in halving payouts. For commodity producers, dividends sized at mid-cycle earnings become unaffordable when spreads stay near the bottom for multiple years.
Capital Is Already Choosing Sides
Deloitte’s 2026 Chemical Industry Outlook notes that forecasts for global chemical production growth in 2025 fell from 3.5% to 1.9% and that several companies are shifting portfolios from basic petrochemicals toward specialty products to capture higher margins. PwC’s US chemicals deals outlook adds that specialty platforms with resilient margins command premium multiples, while commodity and Europe-weighted assets face discounts. Valuation is now rewarding pricing power more than scale.
The Epignosis Insights View
Three implications stand out. First, the margin gap is structural rather than cyclical, because the capacity overhang is concentrated upstream. Second, the “specialty” label deserves scrutiny: investors should classify businesses by how prices are set and by raw materials’ share of cost of goods, not by segment names. Third, the only durable commodity winners are cost-curve leaders with advantaged feedstock; everyone else needs either a specialty pivot or a credible exit plan.