
Reading between the Lines: How to Spot a Bubble Using Market Data

Bubbles Are Obvious in Hindsight, Rare in Real Time
No regulator or central bank has ever reliably called a market top in advance, but several data series have flashed the same pattern before every major bubble of the past century: valuations stretched well above their historical range, leverage rising faster than the assets it finances, and gains concentrated in an ever-narrower set of stocks. As of August 2026, the Shiller CAPE ratio for the S&P 500 stands at 41.2 the second-highest reading in roughly 150 years of data, behind only the December 1999 dot-com peak of 44.2, and more than double the long-run median of about 17. That single number is why market strategists keep reaching for the same historical comparisons.
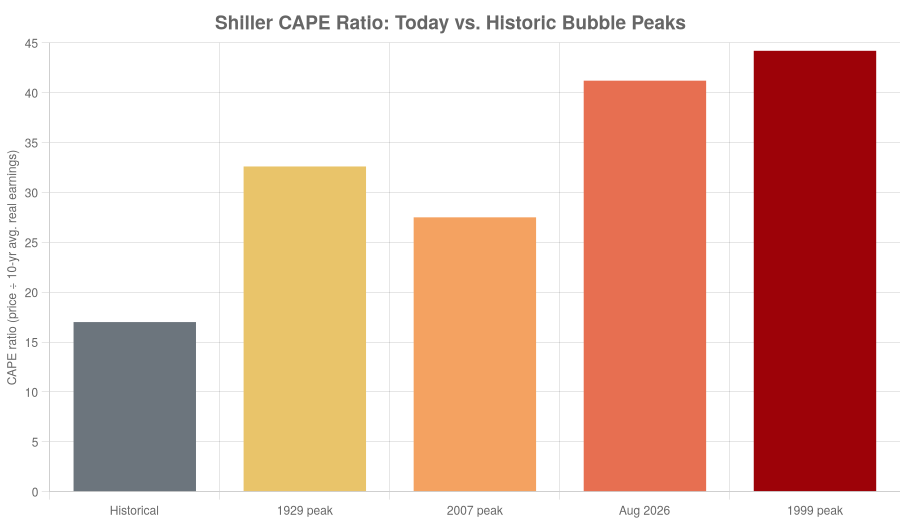
Fig. 1 — Shiller CAPE ratio today compared with prior bubble peaks.
Source: Robert Shiller dataset (Yale University), via Federal Reserve Bank of St. Louis (FRED).
Valuation: What CAPE Actually Tells You
The Cyclically Adjusted Price-to-Earnings ratio, developed by Nobel laureate Robert Shiller with John Campbell, divides the real S&P 500 price by the average of ten years of inflation-adjusted earnings, smoothing out the profit swings that make a standard P/E misleading at turning points. It is not a timing tool CAPE first crossed its 1929 level back in 1996, a full four years before the dot-com top but it is a reliable signal that expected future returns are compressed. When CAPE sits near current levels, buyers are effectively prepaying for a decade of flawless earnings growth, leaving very little room for disappointment before multiples have to contract.
Leverage: Margin Debt Growing Faster Than the Market
The second classic signal is leverage outrunning the assets it is used to buy. FINRA data shows investor margin debt hit a record $1.50 trillion in June 2026, up roughly 49% year-over-year a pace of increase that has appeared in only 15 of the 342 months on record since 1997, and every earlier cluster sat inside the run-up to the 2000, 2007, or 2021 market peaks. Margin debt itself is not unusual; it typically rises alongside a rising market. What matters is the rate of change relative to the index — when borrowed money grows meaningfully faster than equity values, it signals speculative positioning rather than organic investment.
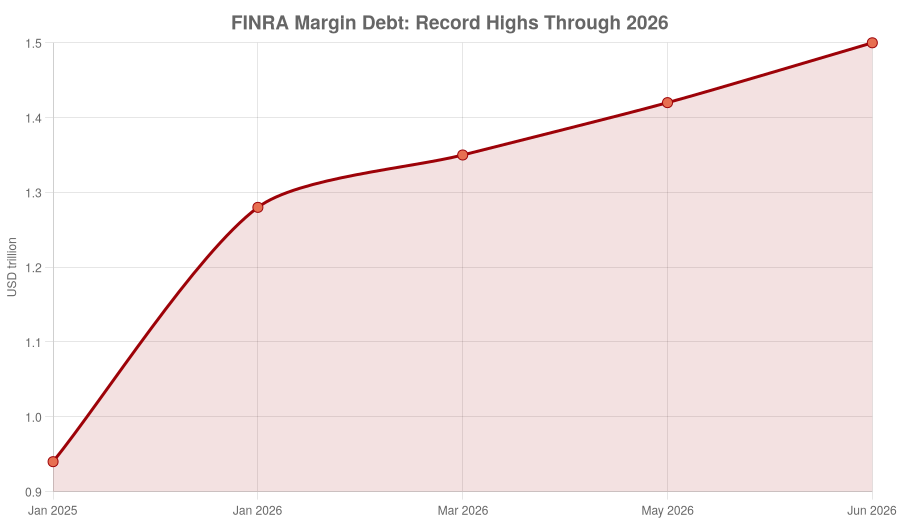
Fig. 2 — FINRA investor margin debt reaching successive record highs through mid-2026.
Source: FINRA Margin Statistics, via Advisor Perspectives.
Concentration: Fewer Stocks Carrying the Whole Index
The third marker is narrowing breadth. The Bank of England's Financial Policy Committee has flagged that the market share of the top five S&P 500 constituents sits close to 30%, higher than at any point in the past 50 years, while separate analysis from Oliver Wyman puts the "Magnificent Seven" mega-cap tech and AI names at roughly 35% of total S&P 500 market value matching the degree of concentration in the top seven stocks at the peak of the dot-com bubble. Since January 2020, those seven stocks have gained nearly eightfold on a total-return basis, while the remaining 493 constituents of the index have not even doubled meaning index-level returns increasingly depend on a shrinking handful of names continuing to justify extreme valuations.
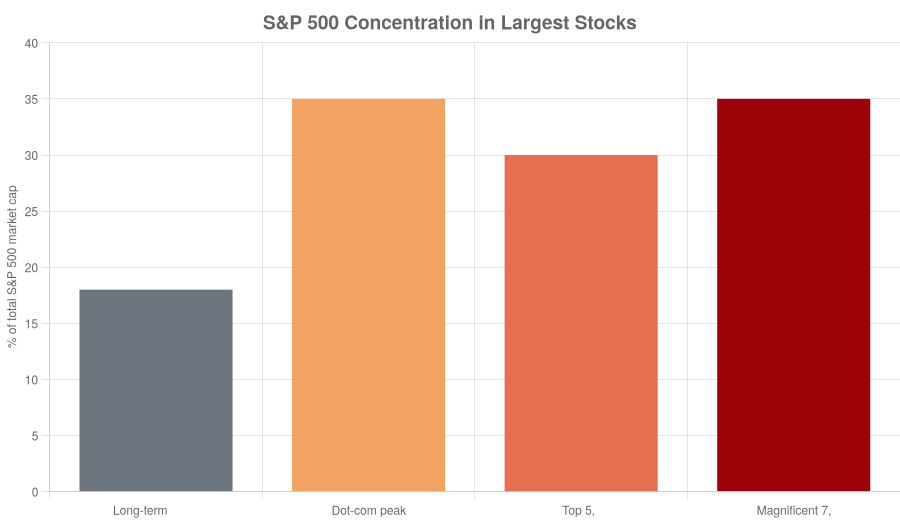
Fig. 3 — Concentration of S&P 500 market capitalization in its largest constituents.
Source: Bank of England Financial Policy Committee; Oliver Wyman analysis of market data.
What Official Institutions Are Actually Saying
Unusually, this cycle has drawn on-record caution from multiple official bodies at once rather than the dismissive tone that typically precedes a top. The Bank of England has explicitly warned that "the risk of a sharp market correction has increased," citing both stretched valuations and rising index concentration. The IMF's managing director has cautioned that easy financial conditions built on AI-led euphoria "can turn abruptly," while the Financial Stability Board's chair has separately flagged concentration risk clustered in a handful of very large firms, warning that a correction there could propagate through hedge fund leverage and bank exposures into a broader shock. On the sell-side, Goldman Sachs' own basket of nine sentiment and positioning indicators sits around the 86th percentile of readings since 1995 — elevated, though still short of the extremes reached in 2000 and 2021.
The Counter-Argument: This Time, Earnings Are Real
Bulls point to a genuine difference from 1999: today's largest companies are generating record profits, not just revenue growth. Goldman Sachs data shows 64% of reporting S&P 500 companies beat consensus earnings estimates by at least one standard deviation in a recent quarter, and consensus full-year earnings forecasts have risen 16%, comfortably outpacing the index's own price gains. Deutsche Bank's 2026 outlook explicitly frames the year as "1999 meets 1990" dot-com-style optimism, but this time anchored to profitable balance sheets rather than pre-revenue speculation. Even so, sentiment has shifted measurably: Bank of America's July 2026 Global Fund Manager Survey found 45% of respondents naming an AI bubble as the single biggest tail risk to markets, up from 28% just one month earlier, and identified crowded long positions in global semiconductors as the world's most crowded trade.
The Takeaway: Watch the Combination, Not Any Single Number
No individual metric not CAPE, not margin debt, not concentration has ever reliably called a top on its own; each has produced false signals for years at a stretch before eventually being validated. What distinguishes genuine bubble conditions from ordinary bull-market exuberance is when several of these signals move together: valuations near historic extremes, leverage compounding faster than the assets it funds, gains concentrated in a narrowing set of names, and official institutions breaking from their usual reticence to say so publicly. On that combined reading, several of the boxes that were checked in 1999, 2007, and 1929 are checked again today which does not predict when the correction comes, only that the market currently has very little room for anything to go wrong.