
The Permitting Bottleneck Slowing Down the Energy Transition
A Grid Clogged Before It Is Built
The energy transition’s biggest constraint is no longer the cost of a solar panel or a battery cell it is the paperwork and grid access standing between a finished project and an operating one. As of the end of 2024, roughly 2,290 gigawatts (GW) of generation and storage capacity sat active in U.S. interconnection queues, nearly double the capacity of the entire existing power fleet, according to Lawrence Berkeley National Laboratory’s annual "Queued Up" review. The typical project that reached commercial operation in 2024 had spent 55 months more than four and a half years waiting in the queue, up from roughly 20 months for projects completed two decades ago. Historically, only about 19% of projects that entered U.S. queues between 2000 and 2019 ever reached commercial operation at all; the rest were withdrawn, restructured, or abandoned before construction began.
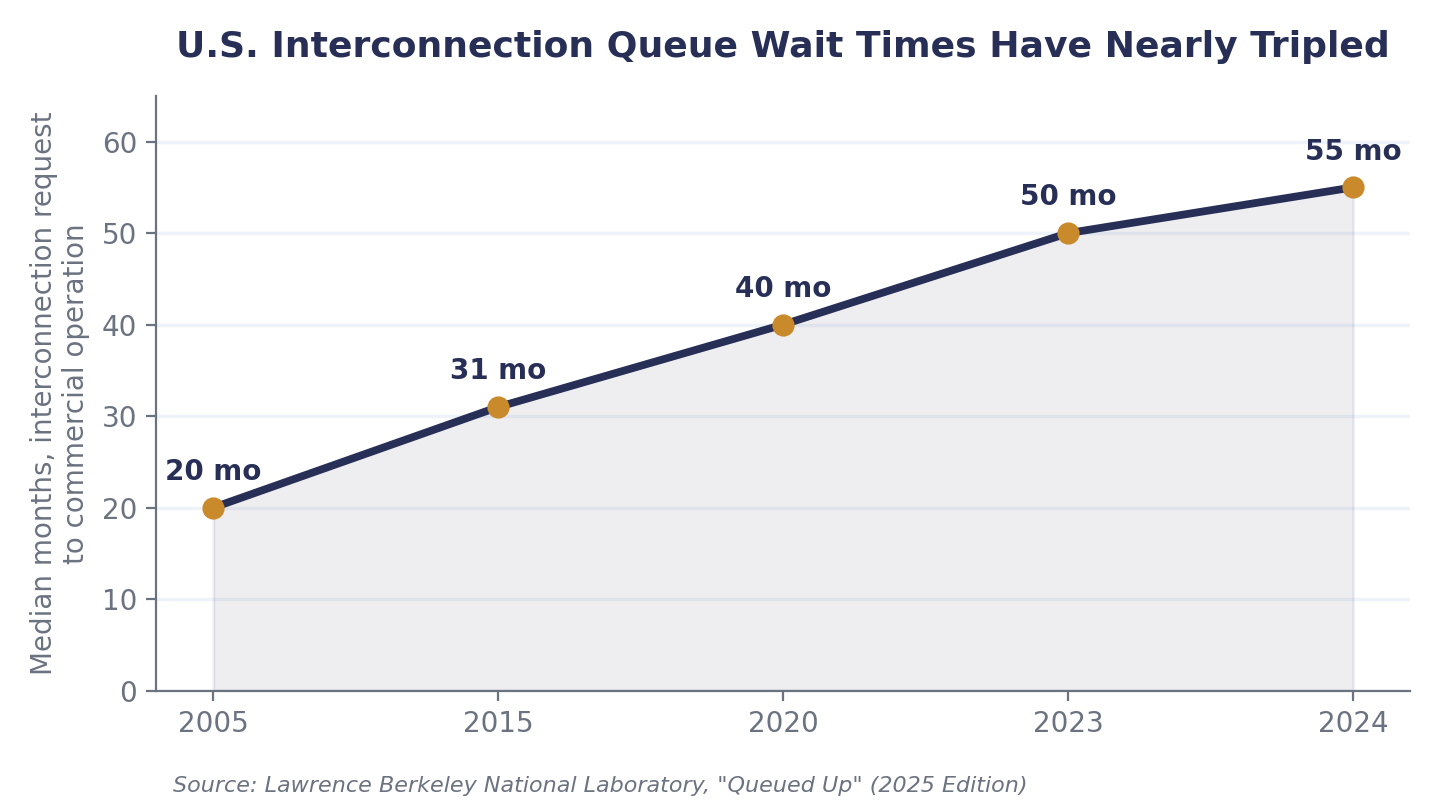
Figure 1: Median time from interconnection request to commercial operation, U.S. queues.
Renewables Are Carrying the Weight of the Wait
The backlog falls disproportionately on the technologies the transition depends on most. Solar, storage, and wind together account for roughly 95% of the capacity currently queued for grid access, and the American Clean Power Association estimates that the average clean energy project now waits 4.5 years for federal environmental review under the National Environmental Policy Act, while a transmission line the infrastructure needed to actually deliver that power takes an average of 6.5 years to permit. By mid-2026, ACP’s quarterly market tracking found 59 GW of U.S. clean power capacity sitting in delay, with developers reporting an average slip of 19 months per project. Separately, the Solar Energy Industries Association has warned that a new tier of secretarial-level sign-off requirements on federal land placed more than 450 planned projects at risk, a stalled pipeline the association estimates could add over $120 billion to consumer energy costs if left unresolved.
Where the Friction Actually Sits
Survey data from clean energy capital platform Crux, covering 50 developers and permitting professionals and reported by E&E News, found that federal permitting contributed to project delays or cancellations for 94% of respondents in the past year, with every single developer surveyed reporting increased development costs as a direct result. A majority cited cost increases of 6% to 10%, and some reported overruns exceeding 25%. The delays are rarely a single dramatic denial they are accumulated friction: a late-stage biological survey that stalled one solar project for ten months, an Endangered Species Act consultation that held up a storage project for six months, and, increasingly, project designs re-engineered from the outset simply to minimize contact with federal review triggers, even on privately owned land.
A Global Pattern, Not Just a U.S. Story
The bottleneck is not confined to American queues. The International Energy Agency estimated that 1,650 GW of solar and wind capacity was awaiting grid connection worldwide in 2024 equivalent to roughly six times Germany’s entire installed generating capacity driven by a mix of grid investment shortfalls and permitting delay across major markets. McKinsey’s research arm has separately flagged the grid itself as a "growing bottleneck" to the broader transition: supply constraints have pushed transformer and cable prices up by roughly a third since 2022, while delivery lead times for the same equipment have doubled to two to three years, compounding the permitting delay with an equipment delay that hits at exactly the same stage of project development.
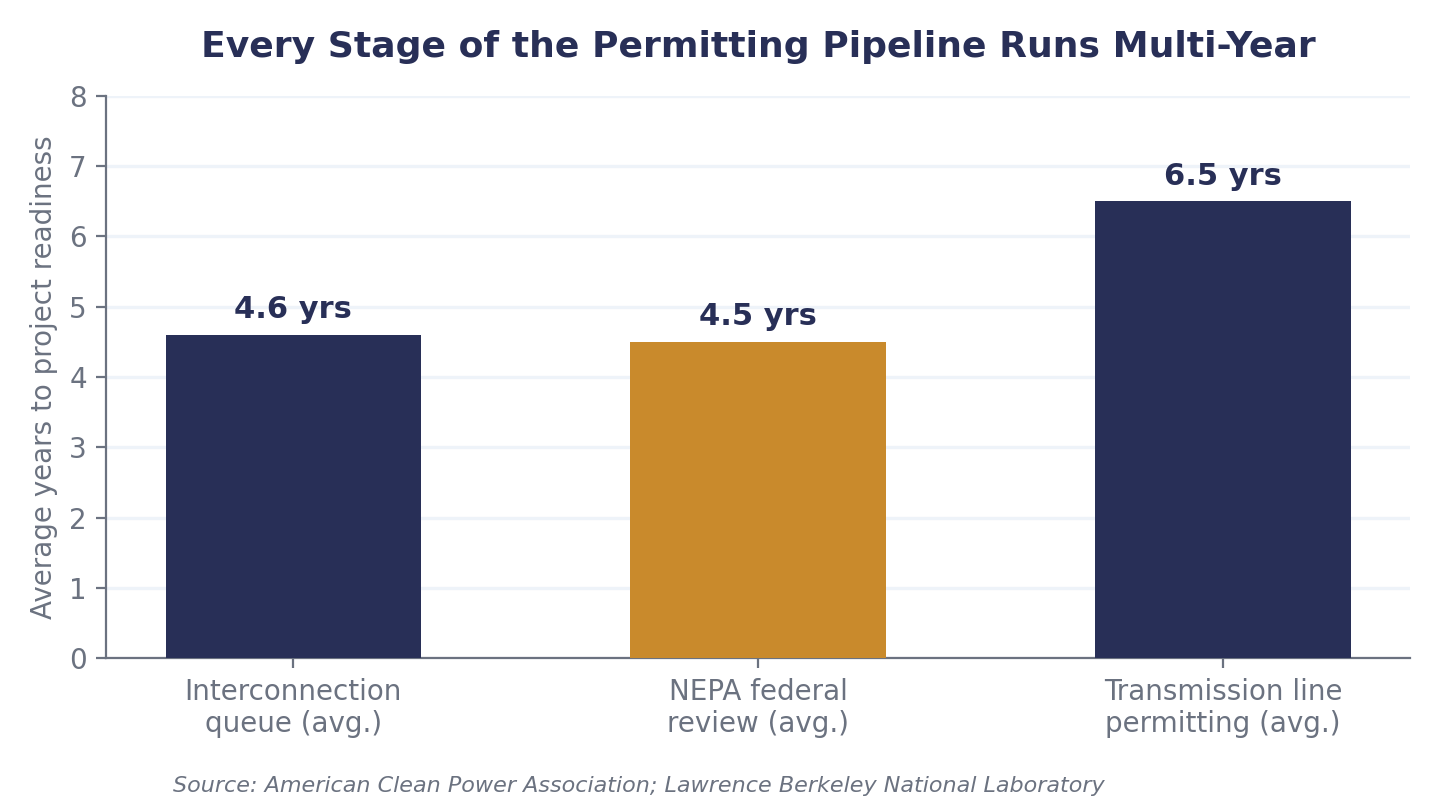
Figure 2: Average multi-year duration at each stage of U.S. project readiness.
Policy Response and Where Capital Is Moving
Regulators are responding, if unevenly. In May 2024, the Federal Energy Regulatory Commission issued Order No. 1920, requiring transmission providers for the first time to conduct long-term regional planning on a 20-year horizon rather than reacting project by project, alongside a companion order clarifying FERC’s siting authority for interstate transmission lines. Capital is already repositioning around the bottleneck rather than waiting for it to clear: NextEra Energy’s investor materials disclose a transmission development pipeline exceeding $25 billion at NextEra Energy Transmission, with regulated transmission capital expected to grow at more than 20% annually through 2032 — a signal that utilities increasingly see grid buildout itself, not generation, as the scarcer and more valuable asset.
The Data Table at a Glance
| Metric | Figure | Source |
| Active U.S. interconnection queue capacity (end-2024) | ~2,290 GW | Lawrence Berkeley National Laboratory |
| Global solar + wind capacity awaiting grid connection (2024) | 1,650 GW | International Energy Agency |
| U.S. clean power capacity currently delayed | 59 GW | American Clean Power Association |
| Developers citing federal permitting as a delay factor | 94% | Crux survey, via E&E News/POLITICO |
| Transformer & cable lead times since 2022 | 2x longer | McKinsey Global Institute |
| NextEra Energy Transmission development pipeline | $25B+ | NextEra Energy investor presentation |