
Conjoint Analysis Explained How to Find What Features Customers Will Pay For

Most product roadmaps are built on opinion. A product manager likes a feature, a founder is convinced customers want faster delivery, a sales team insists that a lower price will fix everything. The problem is that when you ask customers directly what they want, they tend to say "all of it" more features, better quality, and a lower price, simultaneously. Conjoint analysis exists because that kind of direct questioning does not reflect how people actually buy. It forces respondents into the same trade-offs they face at checkout, and in doing so, produces a number that most other research methods cannot: how much a specific feature is actually worth to a customer, in real currency.
What Is Conjoint Analysis?
Conjoint analysis is a statistical survey technique that estimates how buyers value individual attributes price, brand, warranty, delivery speed, capacity by observing the choices they make between full product profiles rather than by asking about each attribute in isolation. Respondents see several product “bundles,” each with a different mix of features and prices, and simply pick the one they would buy. Across hundreds of these choices, statistical modelling backs out a part-worth utility score for every attribute level, which shows precisely how much weight that feature carries in the final decision.
The Core Mechanism: Trade-offs, Not Wish Lists
The reason this method works where surveys fail is straightforward: it never asks “do you want X?” It asks “would you rather have X at this price, or Y at that price?” Choice-based conjoint (CBC), in which respondents pick a full product profile from a small set of alternatives, has become the dominant format in commercial research, used in an estimated 79% of conjoint studies conducted globally, according to a discrete-choice methodology survey published in IEEE-affiliated engineering research. That dominance exists because CBC most closely mimics an actual shelf or checkout decision, producing utility data that is both statistically robust and easy to translate into a pricing or feature simulator.
Why Companies Cannot Afford to Guess
The cost of shipping the wrong feature set is not hypothetical. Research associated with Harvard Business School estimates that roughly 30,000 new consumer products are launched every year, and that somewhere between 75% and 95% of them fail to meet their sales or survival targets, depending on how failure is defined. A separate academic study published in Marketing Letters, tracking consumer panel data, found that one in four newly launched SKUs are no longer being purchased just one year after launch, a figure that climbs to roughly 40% within two years. NielsenIQ tracking data points in the same direction, showing that only around 15% of new consumer packaged goods products remain commercially viable two years after launch.
These are not failures of manufacturing or distribution. In the overwhelming majority of cases, they are failures of assumption launching a feature set or price point that the market was never actually willing to reward.
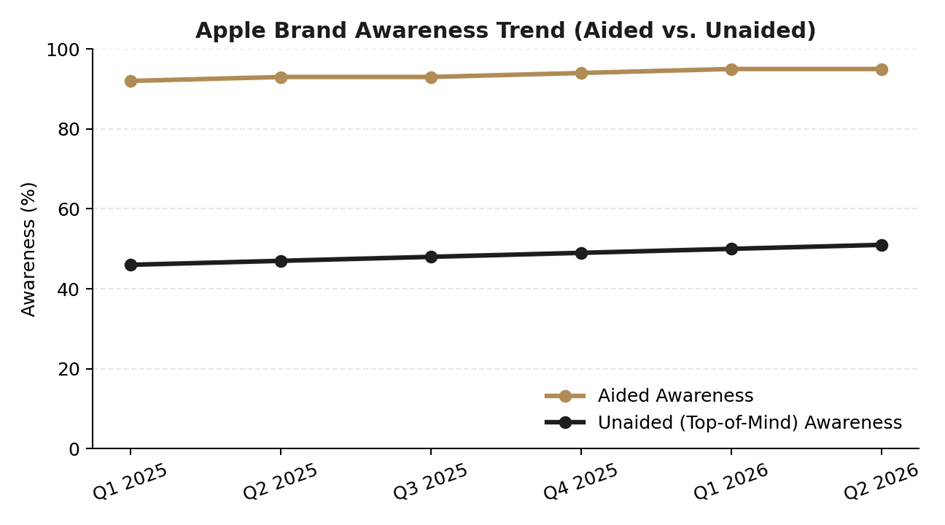
Figure 1: The global insights and market research industry has grown from roughly $102 billion in 2021 to an estimated $150 billion by 2024, reflecting rising corporate investment in structured customer research, including conjoint studies. Source: ESOMAR Global Market Research Report.
How Conjoint Analysis Works in Practice
From Utility Scores to Willingness to Pay
Once utility scores are estimated, they can be converted into a dollar figure. If price is modelled as one of the attributes in the study, researchers can calculate willingness to pay by dividing the utility gain from a feature by the utility attached to price itself in effect, using price as an exchange rate between “utility” and currency.
Insights consultancy GLG illustrates this with a laptop example: adding extra memory to a base configuration lifted a product's simulated preference share from 15.8% to 18.8%, while a $100 price cut alone added a further 2.5 percentage points of share letting a product team compare a feature investment against a price cut on the same scale.
The chart below shows the kind of output a completed choice-based conjoint study typically produces: a ranked breakdown of how much weight each attribute carries in the purchase decision, which becomes the direct input for prioritising a product roadmap.
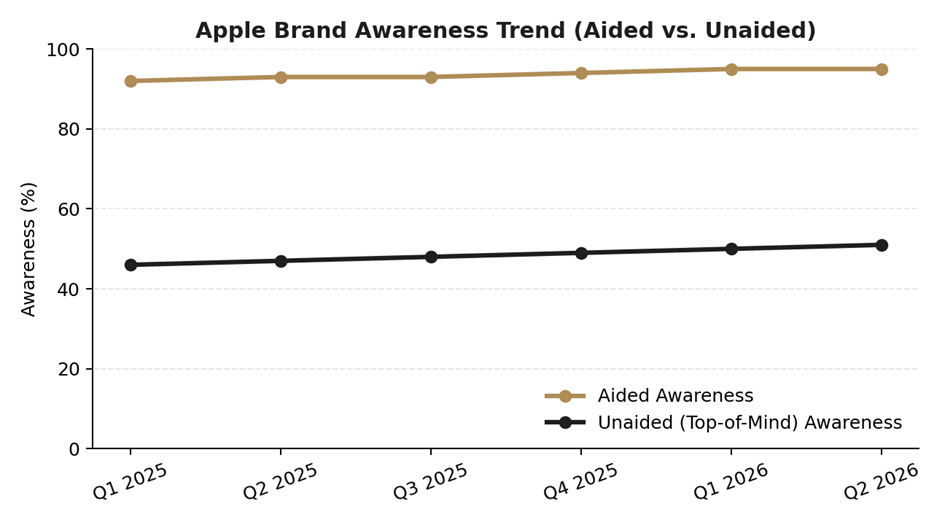
Figure 2: Illustrative attribute-importance output from a choice-based conjoint study, showing price and core performance dominating the purchase decision.
Real-World Application: Pricing and Portfolio Decisions
The financial stakes of getting this right are large. McKinsey's pricing research has found that a 1% improvement in price realisation can lift operating profit by as much as 11%, with no change to volume or cost among the highest-leverage moves available to a management team, and one that conjoint-derived willingness-to-pay data is built to inform. On the B2B side, Bain & Company's research on buying behaviour found that purchase decisions now involve an average of roughly 17 stakeholders, each weighing features and price differently, which is precisely the kind of segmented, multi-attribute complexity conjoint analysis is designed to untangle.
Large consumer goods companies treat this discipline as core infrastructure rather than a one-off project. Procter & Gamble's 2025 annual report states plainly that the company invests in research and development and consumer insights to invent new categories and continually reshape existing products around evolving preferences. That commitment shows up in the numbers: CNBC's analysis of FactSet data found P&G spent roughly $2.1 billion on R&D in its most recent fiscal year alone, and close to $10 billion over the preceding five years spending that funds the consumer and pricing research, including conjoint work, behind its product decisions.
Limitations to Keep in Mind
- Hypothetical bias: because no money changes hands in a survey, respondents can overstate their interest in premium features or high price points relative to real purchase behaviour.
- Attribute overload: including too many features or levels increases respondent fatigue and can degrade the statistical reliability of the resulting utility scores.
- Static snapshot: a conjoint study captures preferences at one point in time; competitive moves or economic shifts can change the trade-offs customers are willing to make.
Conclusion
Conjoint analysis does not tell a company what customers say they want it tells them what customers actually choose when a real trade-off is on the table. Given that the large majority of new products still miss their targets, and that even small pricing missteps carry an outsized profit impact, that distinction is exactly why the method has become standard practice among firms that treat product and pricing decisions as evidence-based, not opinion-based.