Global Viscose Rayon Price Tracker: September 2026
Monthly Viscose Staple Fibre (VSF) Price Assessment and Market Analysis


Monthly Viscose Staple Fibre (VSF) Price Assessment and Market Analysis
| Indicator | Value |
| China VSF 1.2D x 38mm benchmark (mid-Sep 2026) | 14,520 RMB/t |
| Month-on-month change (vs Aug close) | +0.8% |
| Year-to-date change (vs 1 Jan 2026) | +12.6% |
| Year-on-year change (Aug 2026 vs Aug 2025) | +10.4% |
| Indicative pulp-to-fibre spread | ~7,970 RMB/t (+31% vs Jan) |
| VSF discount to China Cotton Index | ~3,380 RMB/t (~19%) |
| Epignosis Q4 2026 base-case (December) | 14,600–14,700 RMB/t |
Table 1: Key indicators. Source: Epignosis Insights Viscose Price Tracker.
Global Viscose Staple Fibre (VSF) Prices extended their 2026 recovery in September. The Epignosis Insights China benchmark for 1.2D x 38mm fibre, the global reference grade, stood at 14,520 RMB per tonne in the 14–20 September assessment window, up 0.8% from the August close of 14,400 RMB and 12.6% above the level at which the year opened. Since the January trough of 12,800 RMB, prices have advanced in seven of eight months, with only July flat.
The defining feature of this cycle is that the rally is margin-led rather than cost-led. Dissolving pulp, the dominant raw material, has held in a narrow band all year, so producers have converted tight inventories and disciplined pricing into a materially wider pulp-to-fibre spread. Cotton has strengthened at the same time, leaving VSF at an unusually wide discount and creating a structural substitution tailwind. Against this, downstream spinners continue to buy only to immediate need, which is capping the pace of increases. Epignosis Insights expects prices to remain firm but range-bound through the fourth quarter, with a base case of 14,600–14,700 RMB per tonne by December.
This tracker reports month-end ex-factory prices for 1.2D x 38mm cotton-type VSF in China, which holds the majority of global VSF capacity and sets the reference for Asian and export pricing. The Epignosis Insights series is compiled from daily benchmark assessments published by SunSirs (China Commodity Data Group) and cross-checked against producer disclosures, cotton benchmarks and trade data. Where September data are incomplete, the latest mid-month assessment is used. Derived indicators, including the pulp-to-fibre spread, the cotton discount and the forecast range, are Epignosis Insights estimates.
| Month | Price (RMB/t) | MoM change | Index (Dec-25 = 100) |
| Dec 2025 | 12,900 | – | 100.0 |
| Jan 2026 | 12,800 | -0.8% | 99.2 |
| Feb 2026 | 12,840 | +0.3% | 99.5 |
| Mar 2026 | 13,180 | +2.6% | 102.2 |
| Apr 2026 | 13,700 | +3.9% | 106.2 |
| May 2026 | 14,060 | +2.6% | 109.0 |
| Jun 2026 | 14,200 | +1.0% | 110.1 |
| Jul 2026 | 14,200 | 0.0% | 110.1 |
| Aug 2026 | 14,400 | +1.4% | 111.6 |
| Sep 2026* | 14,520 | +0.8% | 112.6 |
Table 2: China VSF 1.2D x 38mm month-end ex-factory price. *Mid-September assessment. Source: Epignosis Insights.
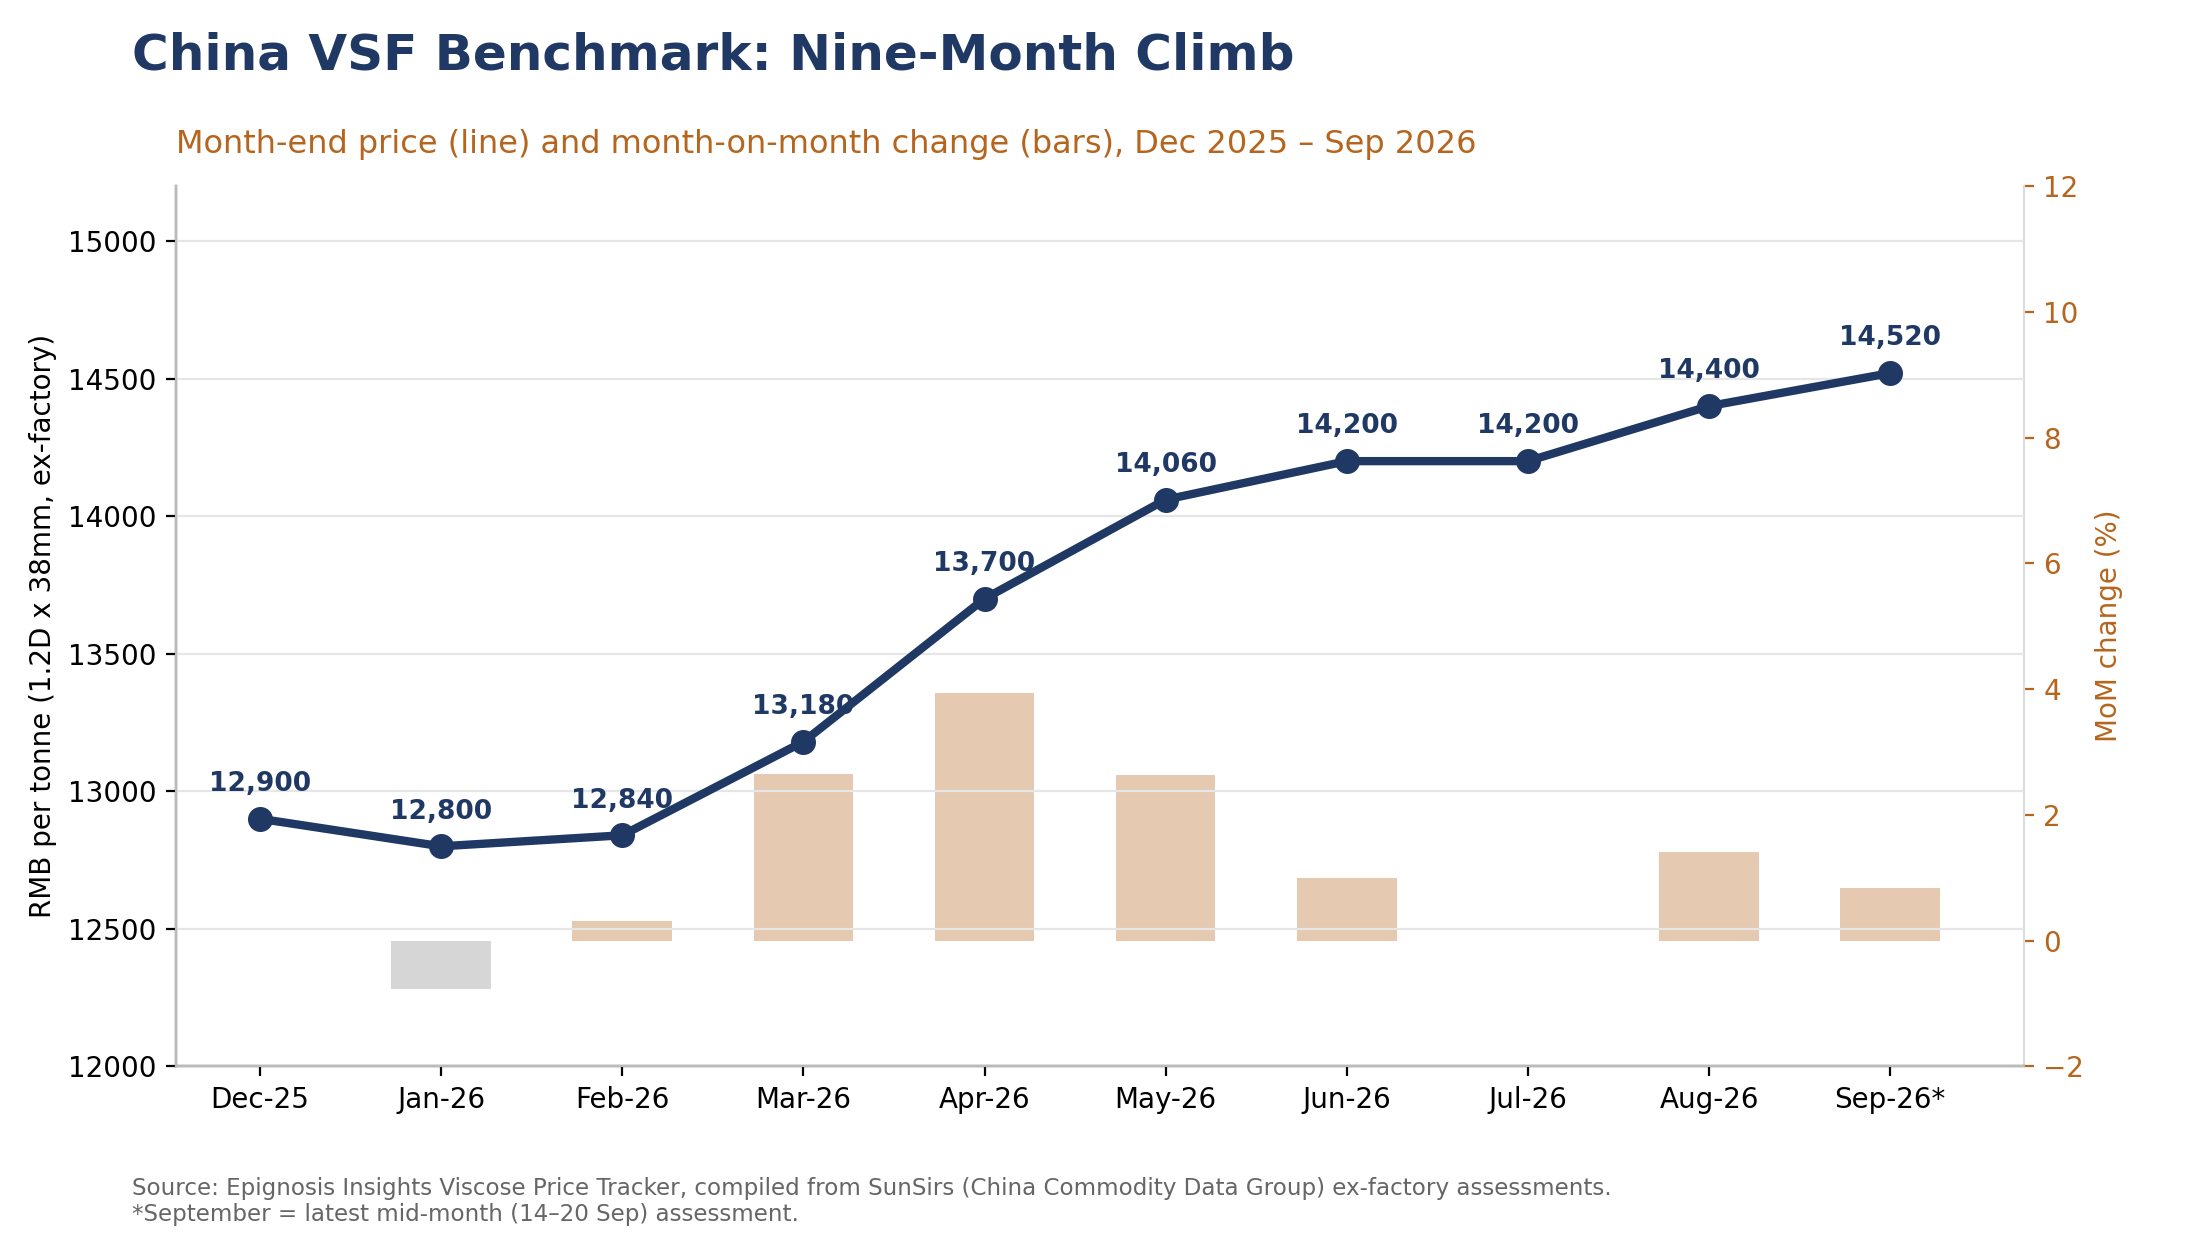
Figure 1: China VSF benchmark price and month-on-month change. Source: Epignosis Insights.
The year opened weakly. Producers trimmed list prices in mid-January, taking the benchmark from 12,900 to 12,800 RMB, as end-user demand faded ahead of the Spring Festival and pulp offered no cost support. Industry processing margins were negative at the start of the year, which limited producers’ willingness to cut further. February was a holding month, closing at 12,840 RMB as yarn mills gradually resumed operations after the holiday.
From late February, producers moved in coordinated increments. The benchmark rose 2.6% in March to 13,180 RMB, a further 3.9% in April to 13,700 RMB, and 2.6% in May to 14,060 RMB, with three separate list-price increases executed during May alone. April was the strongest month of the year, supported by simultaneous gains in cotton and polyester staple fibre that improved the relative value of viscose in blended yarns.
June added a modest 1.0% after producers jointly lifted quotes to 14,200 RMB in the second half of the month, and July was flat throughout. The second leg began in August, with increases on 19 and 27 August taking the benchmark to 14,400 RMB, followed by a further rise to 14,520 RMB in early September before consolidation. The pattern of small, frequent, collectively executed increases indicates a market where pricing power sits with producers, but where buyers are not chasing volume.
The 2026 trajectory contrasts sharply with 2025. In August 2025 the benchmark averaged about 13,040 RMB per tonne, and the market spent most of that year drifting sideways as weak cost support and soft demand offset each other. The August 2026 close of 14,400 RMB therefore represents a year-on-year gain of roughly 10.4%, with the gap opening almost entirely from March onward. Seasonally, VSF prices tend to firm into the September–October peak for autumn and winter apparel production and soften after Golden Week. The fact that producers secured increases during the traditional July lull, and held them, suggests that this year’s strength is structural rather than purely seasonal.
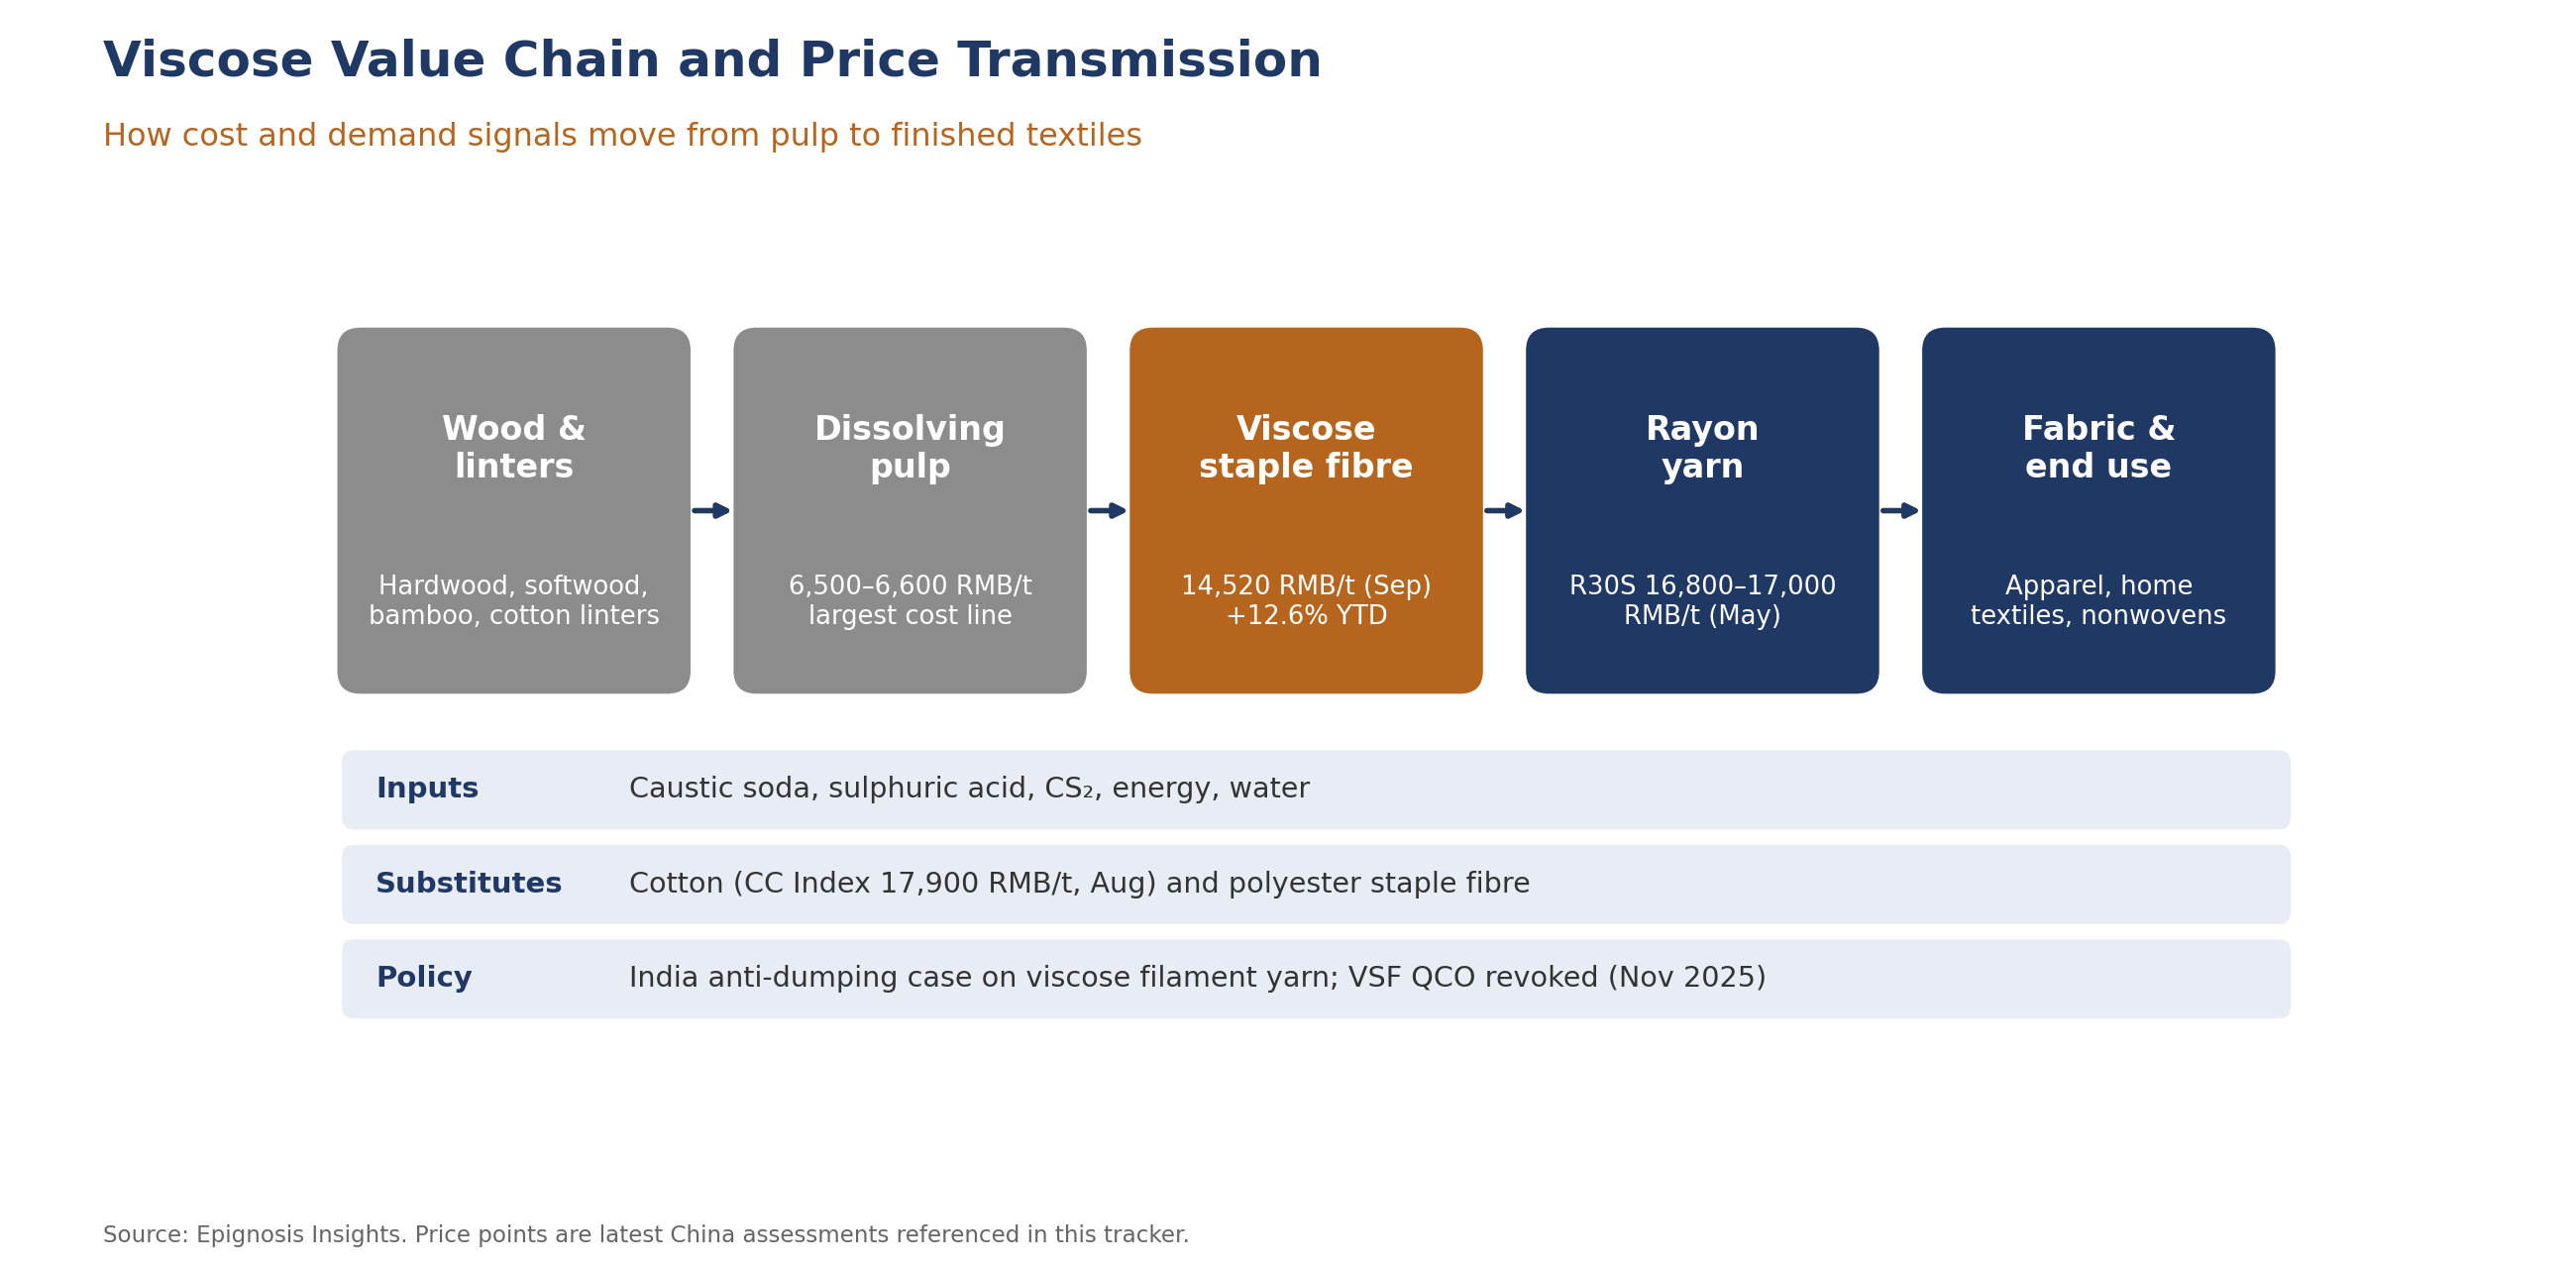
Figure 2: Viscose value chain and price transmission. Source: Epignosis Insights.
Dissolving pulp is the largest single cost line in VSF production, with roughly one tonne required per tonne of fibre. In 2026, however, pulp has been a passive factor. Domestic dissolving pulp was quoted near 6,700 RMB per tonne in January and has since traded in a 6,500–6,600 RMB band, with only limited fluctuation reported into September.
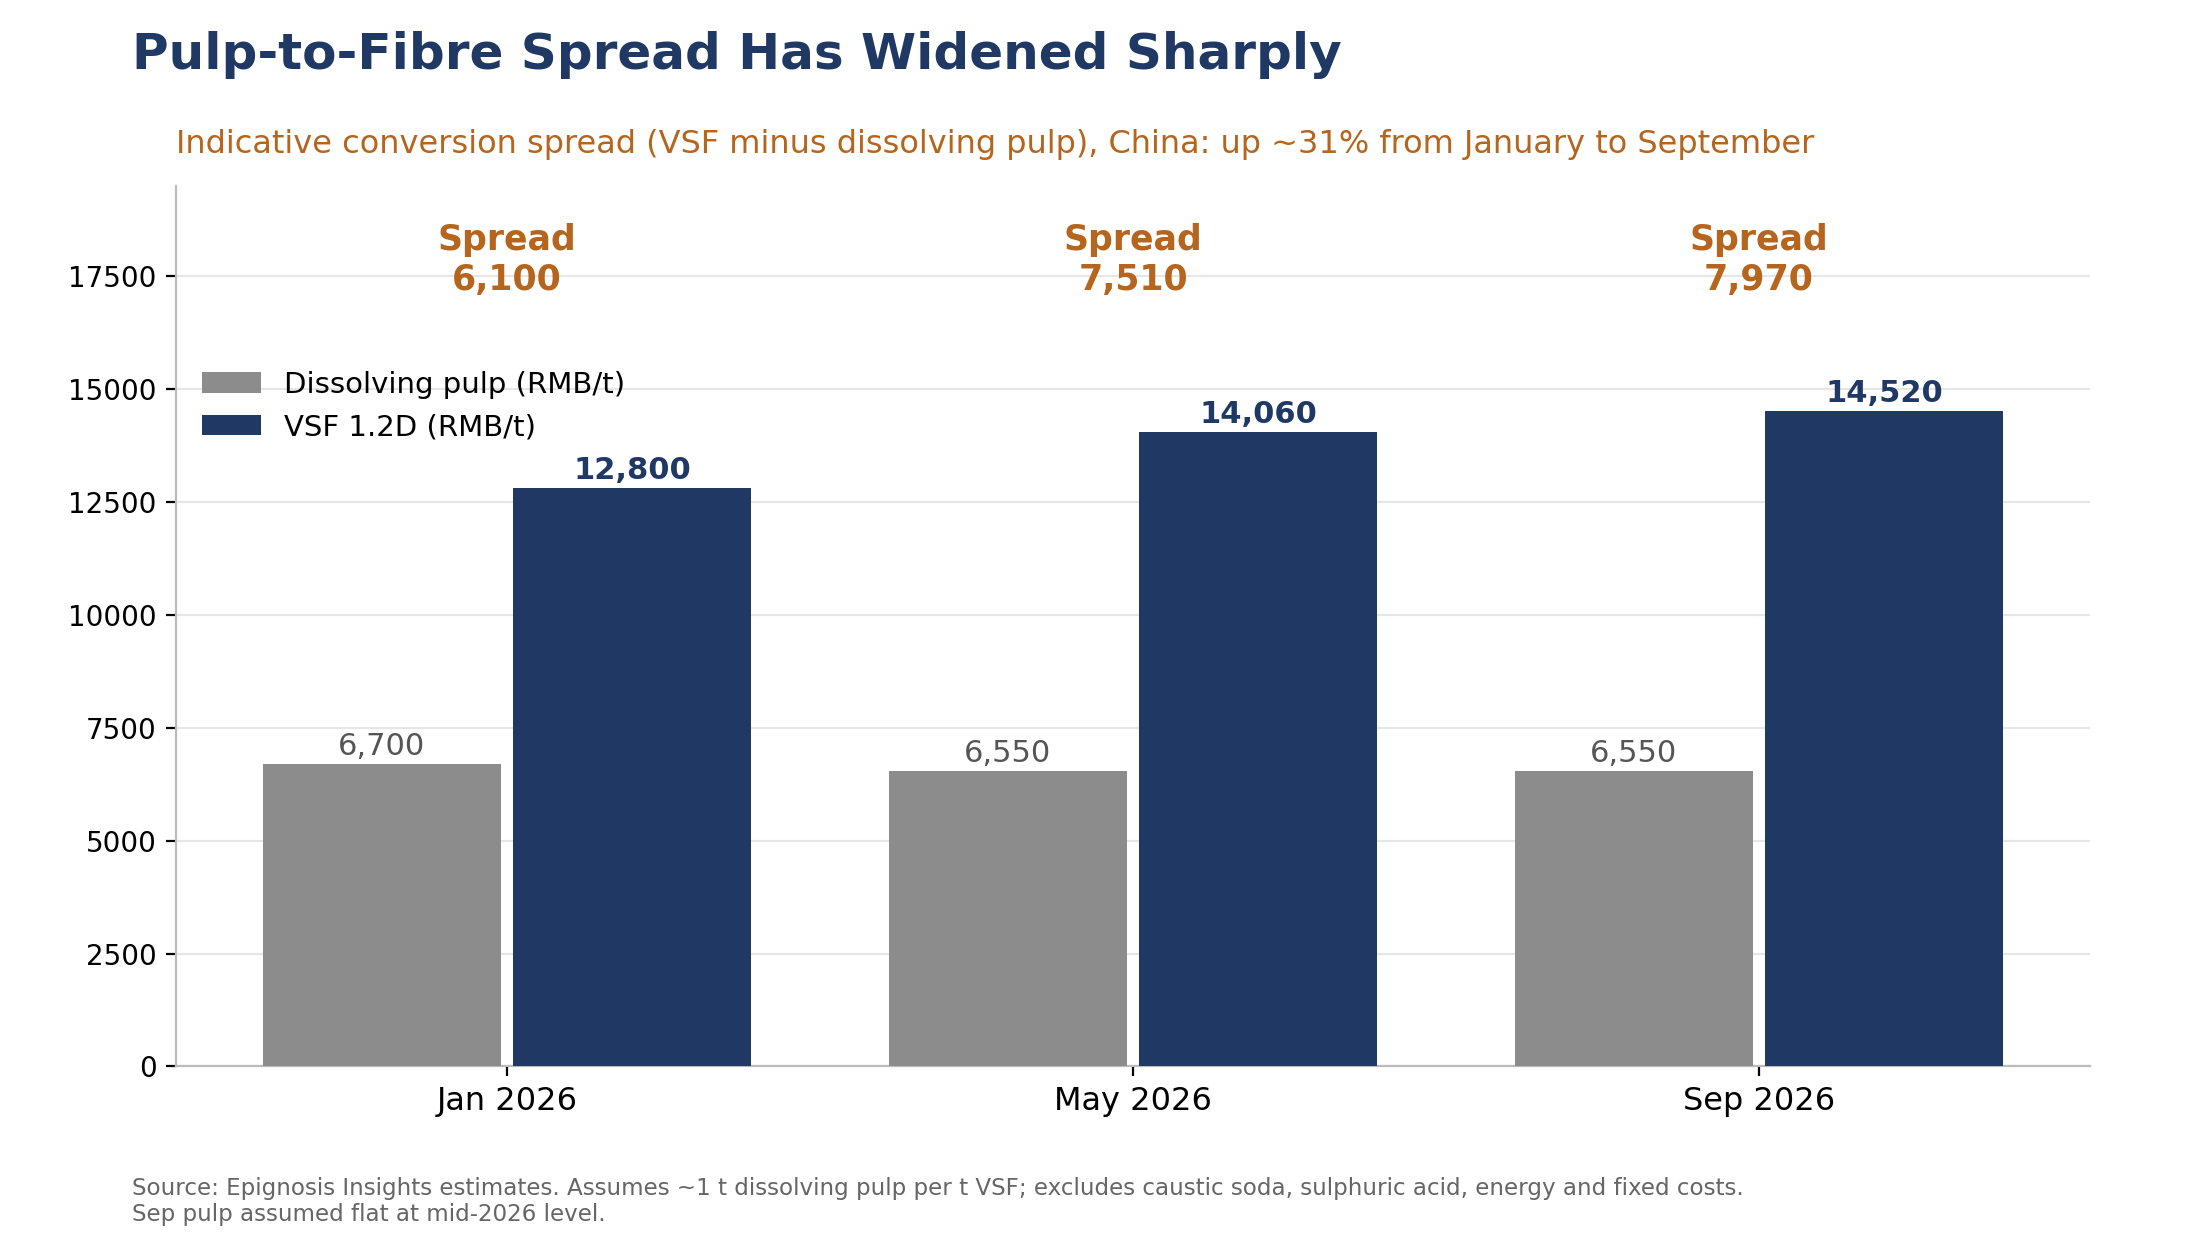
Figure 3: Indicative pulp-to-fibre spread. Source: Epignosis Insights estimates.
The consequence is a sharp expansion in conversion economics. On the Epignosis Insights indicative measure, the pulp-to-fibre spread widened from about 6,100 RMB per tonne in January to roughly 7,970 RMB in September, an increase of around 31%. The measure excludes caustic soda, sulphuric acid, carbon disulphide, energy and fixed costs, but the direction is unambiguous: Chinese producers have moved from loss-making territory at the start of the year to positive cash margins. Margin recovery reduces the incentive to defend volume through discounting, but it also raises the risk that idled lines are restarted if spreads stay elevated into 2027.
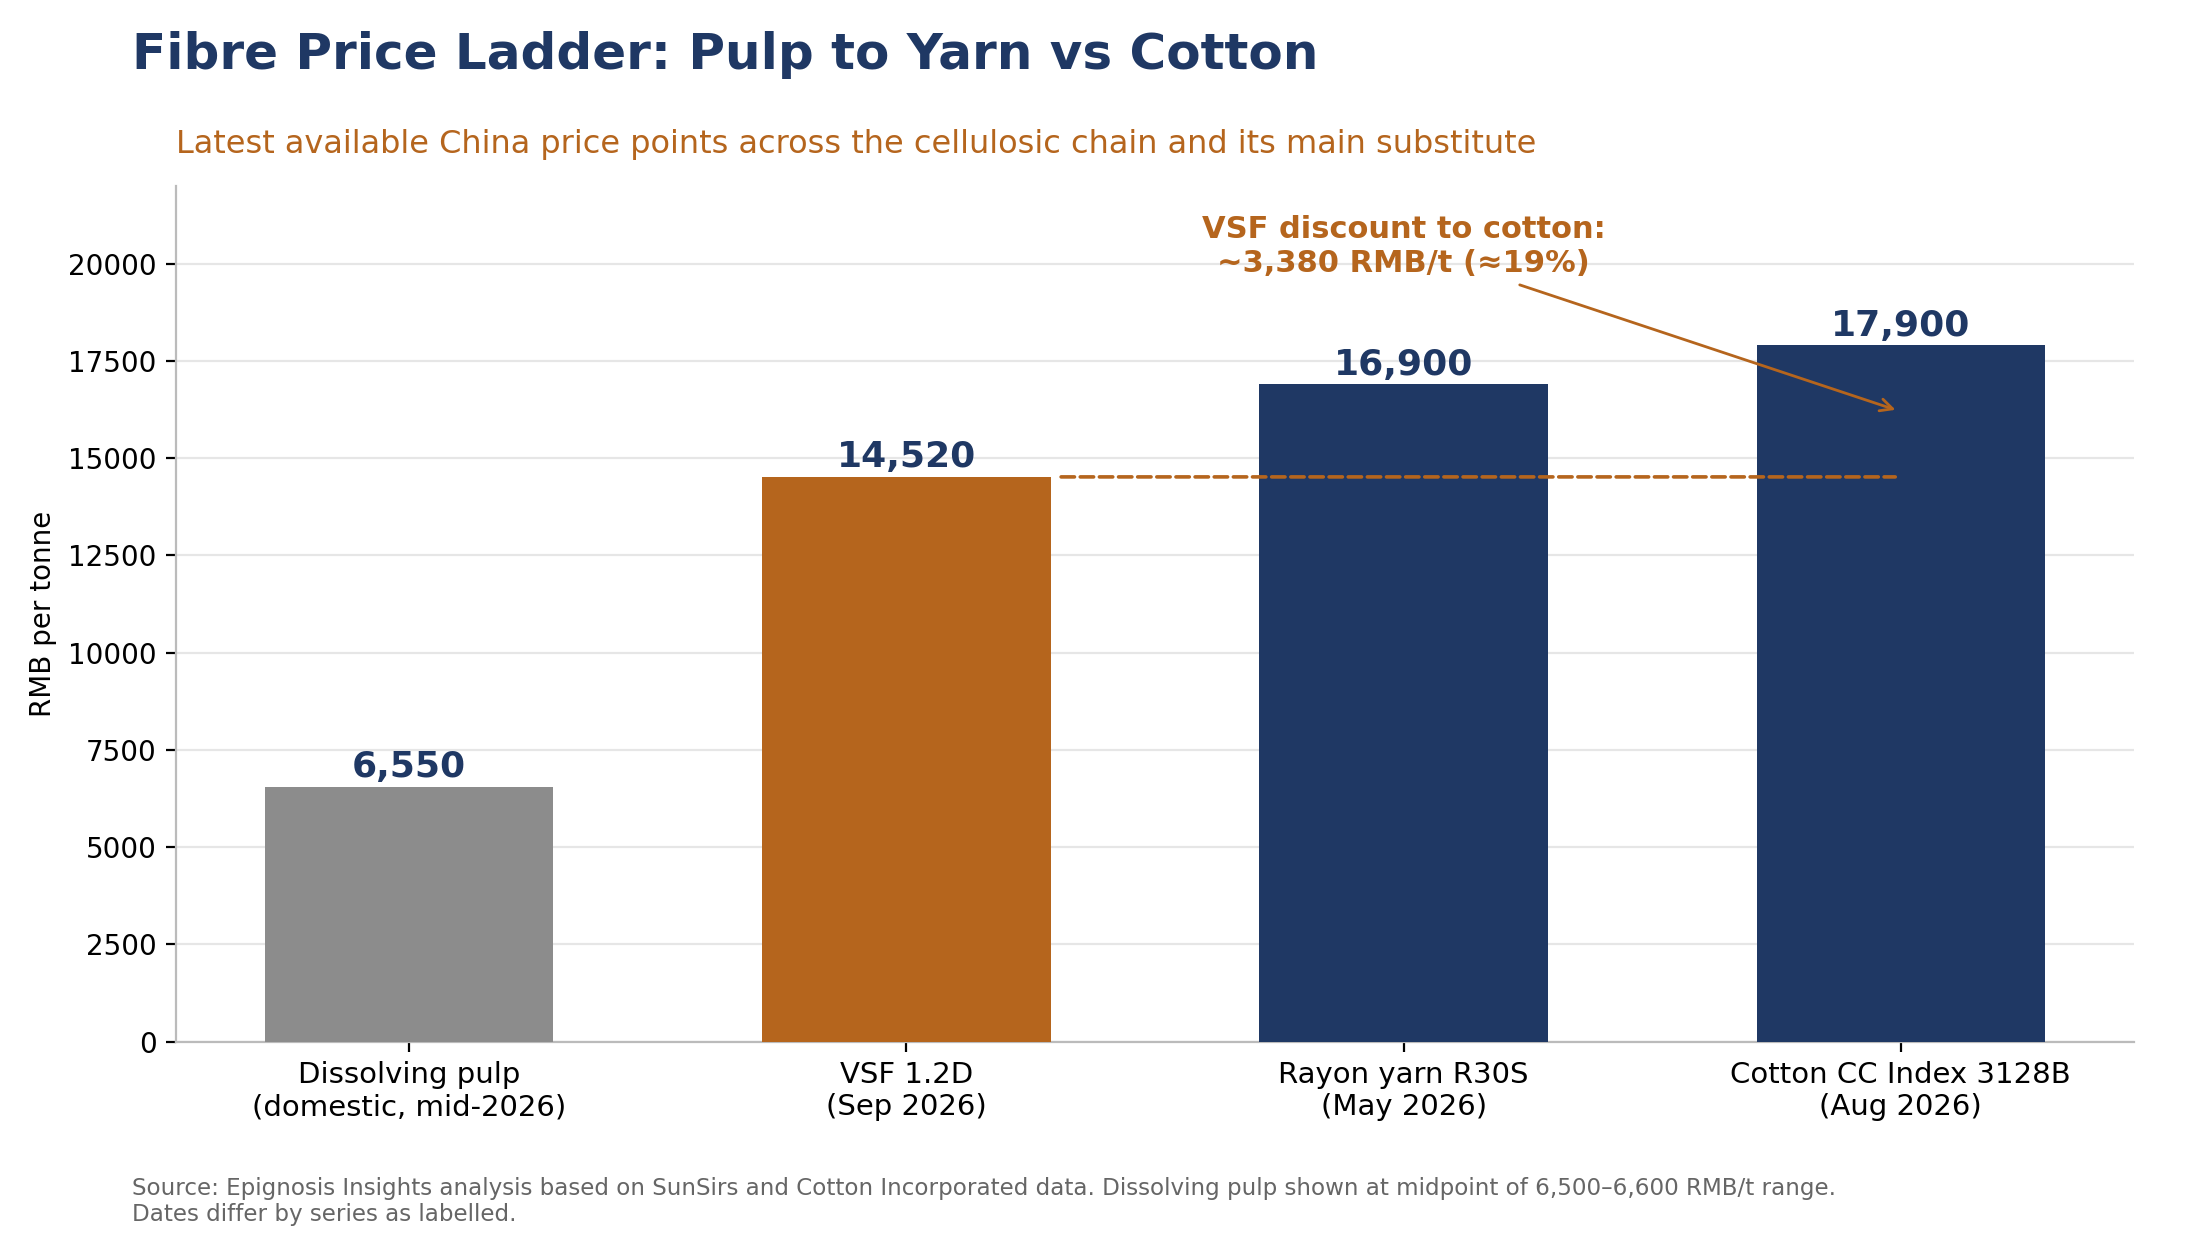
Figure 4: China fibre price ladder. Source: Epignosis Insights.
The most important external support for VSF this year has come from cotton. The US Department of Agriculture’s August 2026 Cotton and Wool Outlook projects that world mill use will exceed production in 2026/27, drawing down global ending stocks, and forecasts the US upland farm price at 75 cents per pound. Cotton Incorporated’s August Monthly Economic Letter reported the A Index rising from 90 to 95 cents per pound over the month and the China Cotton Index 3128B at about 17,900 RMB per tonne, after world 2026/27 ending stocks were cut by 1.5 million bales to 69.7 million; it also noted that the world-less-China stocks-to-use ratio of 39.8% would be the lowest since 2016/17.
With VSF at 14,520 RMB, viscose now trades roughly 3,380 RMB per tonne, or about 19%, below Chinese cotton. Epignosis Insights views this as an unusually wide discount for a fibre that has frequently priced at or above cotton in tight markets. A gap of this size encourages spinners to raise viscose content in blended yarns, particularly in price-sensitive apparel and home textiles, and provides a floor under VSF demand even when overall textile consumption is soft. Polyester staple fibre has also firmed, removing the cheaper synthetic alternative as a pressure point.
China remains the price-setter. Producer inventories are low, and the industry has repeatedly demonstrated coordinated price-holding behaviour. Downstream, R30S ring-spun rayon yarn held around 16,800–17,000 RMB per tonne in May, implying a yarn-over-fibre margin of under 3,000 RMB that explains spinners’ reluctance to build forward stocks.
India has become more import-exposed on staple fibre and more protected on filament. The Ministry of Textiles revoked the Quality Control Order on VSF in November 2025, easing certification barriers for imported fibre and pulling domestic prices closer to Asian import parity. Reuters reported in March 2026 that the Directorate General of Trade Remedies had recommended anti-dumping duties of USD 386–1,071 per tonne on viscose rayon filament yarn from China. Grasim Industries, the dominant domestic producer, reported Q1 FY27 cellulosic staple fibre volumes of 202 KT, down 4% year-on-year on planned maintenance and subdued domestic demand, while segment revenue rose 12% to ₹4,530 crore on improved global prices, rupee depreciation and a richer mix, with specialty fibres at 27% of volume.
European pricing remains at a premium to Asia, underpinned by specialty and certified-sustainable grades. Lenzing’s first-half 2026 results showed revenue of EUR 1.27 billion, down from EUR 1.34 billion, as the company deliberately cut low-margin fibre volumes, while EBITDA reached EUR 239.2 million at an 18.9% margin and second-quarter EBITDA improved to EUR 123 million from EUR 116.3 million. The board’s decision to consolidate fibre production sites signals that Western capacity is being rationalised toward premium segments, tightening non-Chinese commodity supply and supporting regional price differentials.
| Producer | Latest period | Key metric | Price signal |
| Grasim Industries (India) | Q1 FY27 (Apr–Jun 2026) | CSF volume 202 KT (-4% YoY); revenue +12% | Higher global prices, richer mix |
| Lenzing (Austria) | H1 2026 | Revenue EUR 1.27 bn; EBITDA margin 18.9% | Volume cuts, site consolidation |
| Chinese producers (aggregate) | Jan–Sep 2026 | Benchmark +12.6% YTD; low inventories | Coordinated price increases |
Table 3: Producer snapshot. Source: Epignosis Insights compilation from company disclosures.
Demand remains the weak link. Throughout the year, spinners and weavers have purchased on an as-needed basis, and transaction volumes have lagged price increases. This reflects compressed yarn margins, cautious apparel ordering by global retailers and continuing uncertainty over trade policy. China’s early-October Golden Week holiday typically interrupts restocking, and the fourth quarter will test whether the substitution advantage over cotton translates into higher spinning-mill operating rates. Nonwovens, particularly hygiene and wipes, continue to provide steadier offtake than apparel, consistent with Lenzing’s strategic shift toward that segment.
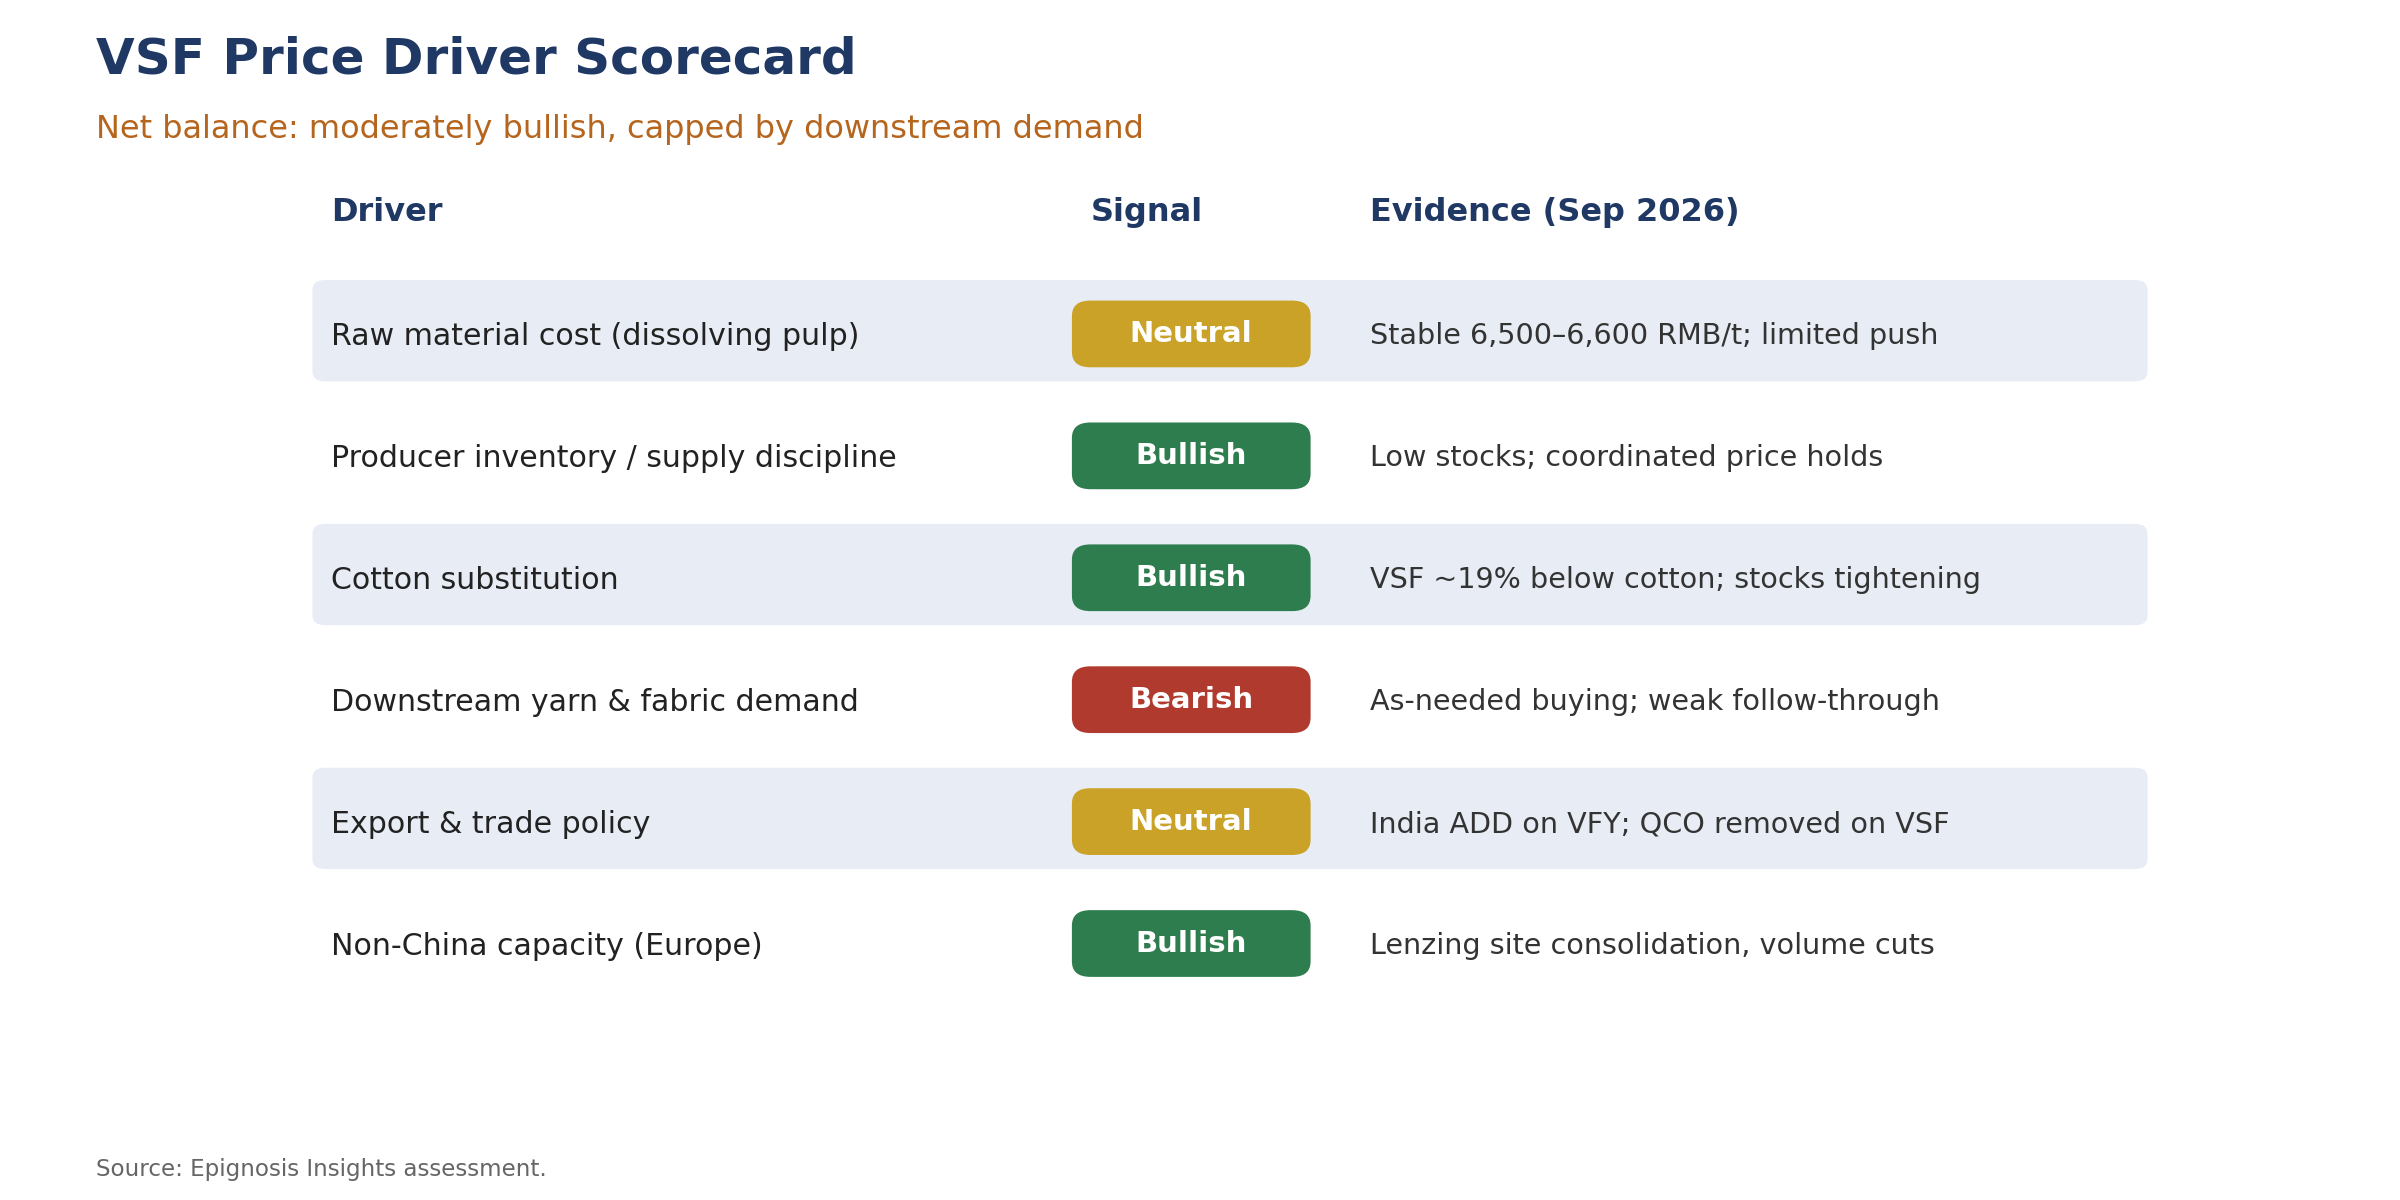
Figure 5: VSF price driver scorecard. Source: Epignosis Insights assessment.
The Epignosis Insights scorecard shows a net moderately bullish balance. Three factors are supportive: low producer inventories and price discipline, the wide discount to cotton, and capacity rationalisation outside China. Two are neutral: dissolving pulp costs and trade policy. Only downstream demand is clearly bearish, but it is the factor that ultimately determines how far prices can run.
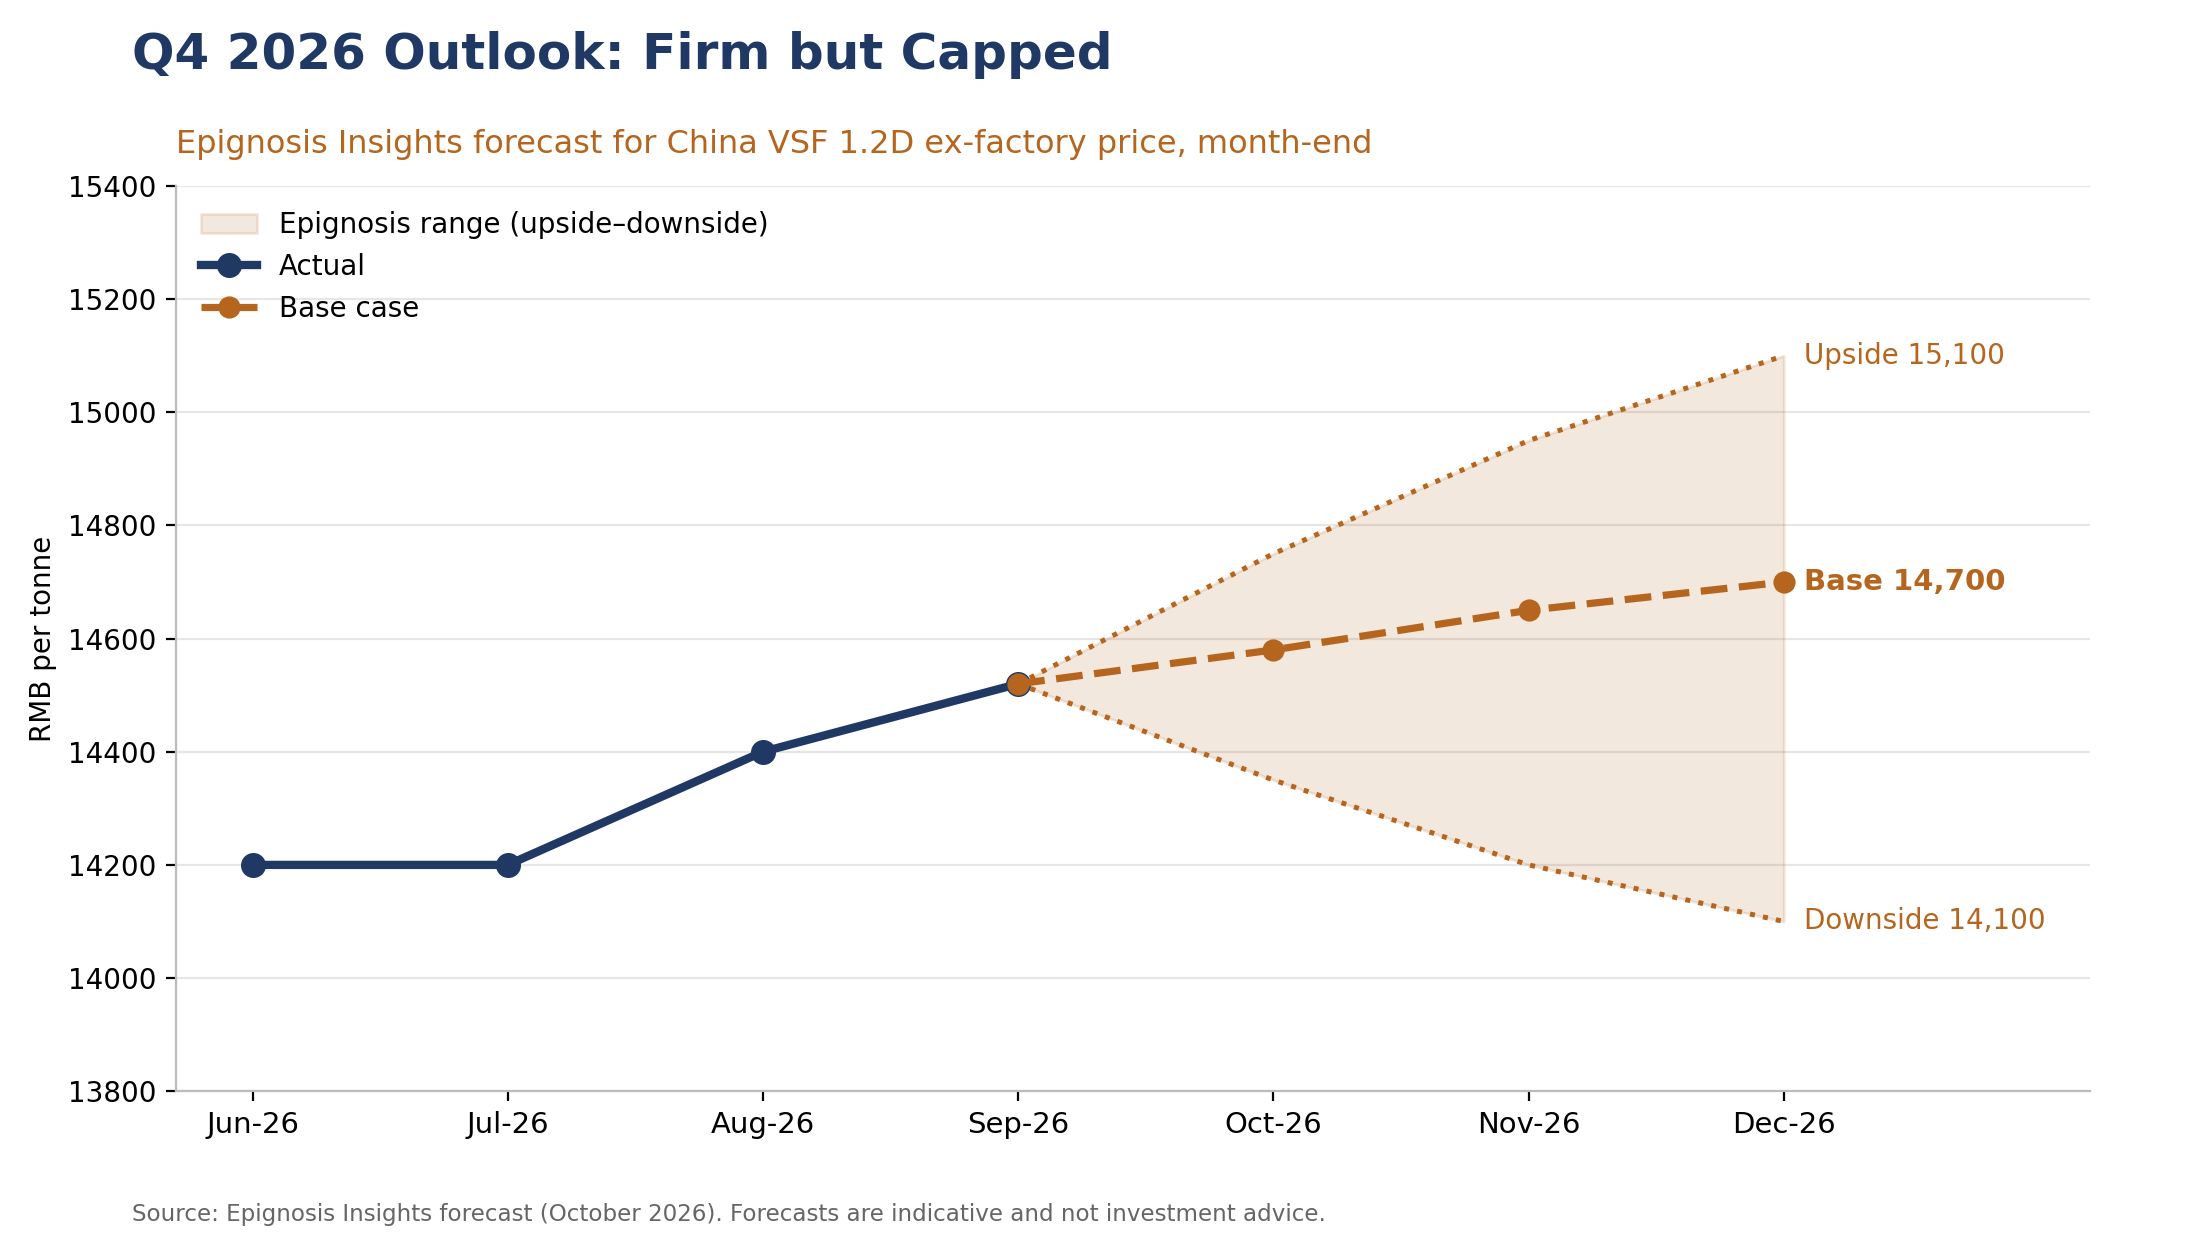
Figure 6: Epignosis Insights Q4 2026 price outlook. Source: Epignosis Insights forecast.
| Scenario | Probability | December 2026 price | Key trigger |
| Base case | 60% | 14,600–14,700 RMB/t | Cotton firm, inventories low, demand steady |
| Upside | 20% | ~15,100 RMB/t | Further cotton rally or supply disruption |
| Downside | 20% | ~14,100 RMB/t | Weak post-holiday orders, capacity restarts |
Table 4: Epignosis Insights Q4 2026 scenarios.
In the base case, prices drift higher in small steps, supported by cotton strength and lean inventories, while hand-to-mouth buying prevents larger moves. The upside case requires a further cotton rally or an unplanned outage at a major producer. The downside case would follow a weak restart in orders after Golden Week combined with margin-driven restarts of idled capacity, which could erase most of the August–September gains.
Price transmission is uneven. Fibre producers have captured most of the 2026 gain, while spinners face a narrowing yarn-over-fibre margin and have so far been unable to pass on the full increase to weavers. Garment makers sourcing viscose fabrics should therefore expect yarn price increases to lag fibre by one to two months, with the risk of a catch-up in the fourth quarter if spinning utilisation improves. For brands, the relative economics still favour viscose over cotton in blended programmes, but the advantage is narrowing at the margin as fibre costs climb.
For procurement teams, the current structure favours layering contract coverage into the fourth quarter rather than waiting for a pullback, since cost support and cotton parity limit downside while producers retain pricing power. For producers, the widened spread is an opportunity to lock in margins and shift mix toward specialty grades before capacity responds. Over the coming month, Epignosis Insights will track dissolving pulp offers for fourth-quarter contracts, the China Cotton Index and USDA’s October supply-demand revisions, operating rates at Chinese VSF plants, R30S yarn prices as a gauge of downstream margin, and progress on Indian trade remedies affecting viscose filament yarn.