Global PVC Price Tracker: Monthly Pricing Report — August 2026
Global PVC prices hold near $0.93/kg as Europe's premium widens and US prices jump 15.6% on infrastructure demand. Regional pricing & feedstock analysis.


Global PVC prices hold near $0.93/kg as Europe's premium widens and US prices jump 15.6% on infrastructure demand. Regional pricing & feedstock analysis.
Global polyvinyl chloride (PVC) prices have moved through a relatively narrow band over the past five quarters, but the surface calm masks sharply diverging regional trajectories that matter more to buyers than the headline average. The global average price eased from a Q3 2025 high of roughly USD 0.95 per kilogram to about USD 0.92/kg by year-end, before recovering modestly to USD 0.93/kg in the first quarter of 2026 as offer levels stabilised and importers turned cautious ahead of trade-policy decisions. Europe has held the highest regional price all year, supported by elevated energy costs and constrained operating rates, while North America has seen the sharpest quarter-on-quarter acceleration into mid-2026 as construction and infrastructure-linked demand firmed. This report walks through the global trend, the regional price spread, the feedstock cost structure behind PVC pricing, and the demand, supply and trade-policy forces shaping the outlook into the second half of 2026, closing with a short forecast and five one-line FAQs for quick reference.
The chart below tracks the global average PVC price against Europe, the consistently highest-priced region, across the last five quarters. The global average traced a shallow arc through 2025 rising from USD 0.93/kg in Q1 to a peak near USD 0.95/kg in Q3 on firmer seasonal construction offtake, then easing back to USD 0.92/kg in Q4 as weak downstream construction activity and ample Asian export supply pressured offer levels. The recovery to USD 0.93/kg in Q1 2026 reflects a more cautious buying pattern: importers largely purchased to immediate need rather than restocking, riding the soft trend lower rather than chasing it, which kept the rebound modest even as sellers tried to defend margins. Europe's line sits persistently 30–40% above the global average throughout the period, a gap that has widened rather than narrowed moving from USD 1.22/kg in Q1 2025 to a peak of USD 1.31/kg in Q3 2025, easing to USD 1.27/kg in Q4, and then recovering most of that dip to USD 1.30/kg by Q1 2026 as importers pressed against thin local supply. The divergence between the two lines is the single most important structural feature of the current market: it signals that global averages increasingly understate the price reality facing buyers in high-cost regions, and that any pricing strategy built solely on global benchmark data risks materially under- or over-estimating regional procurement costs.
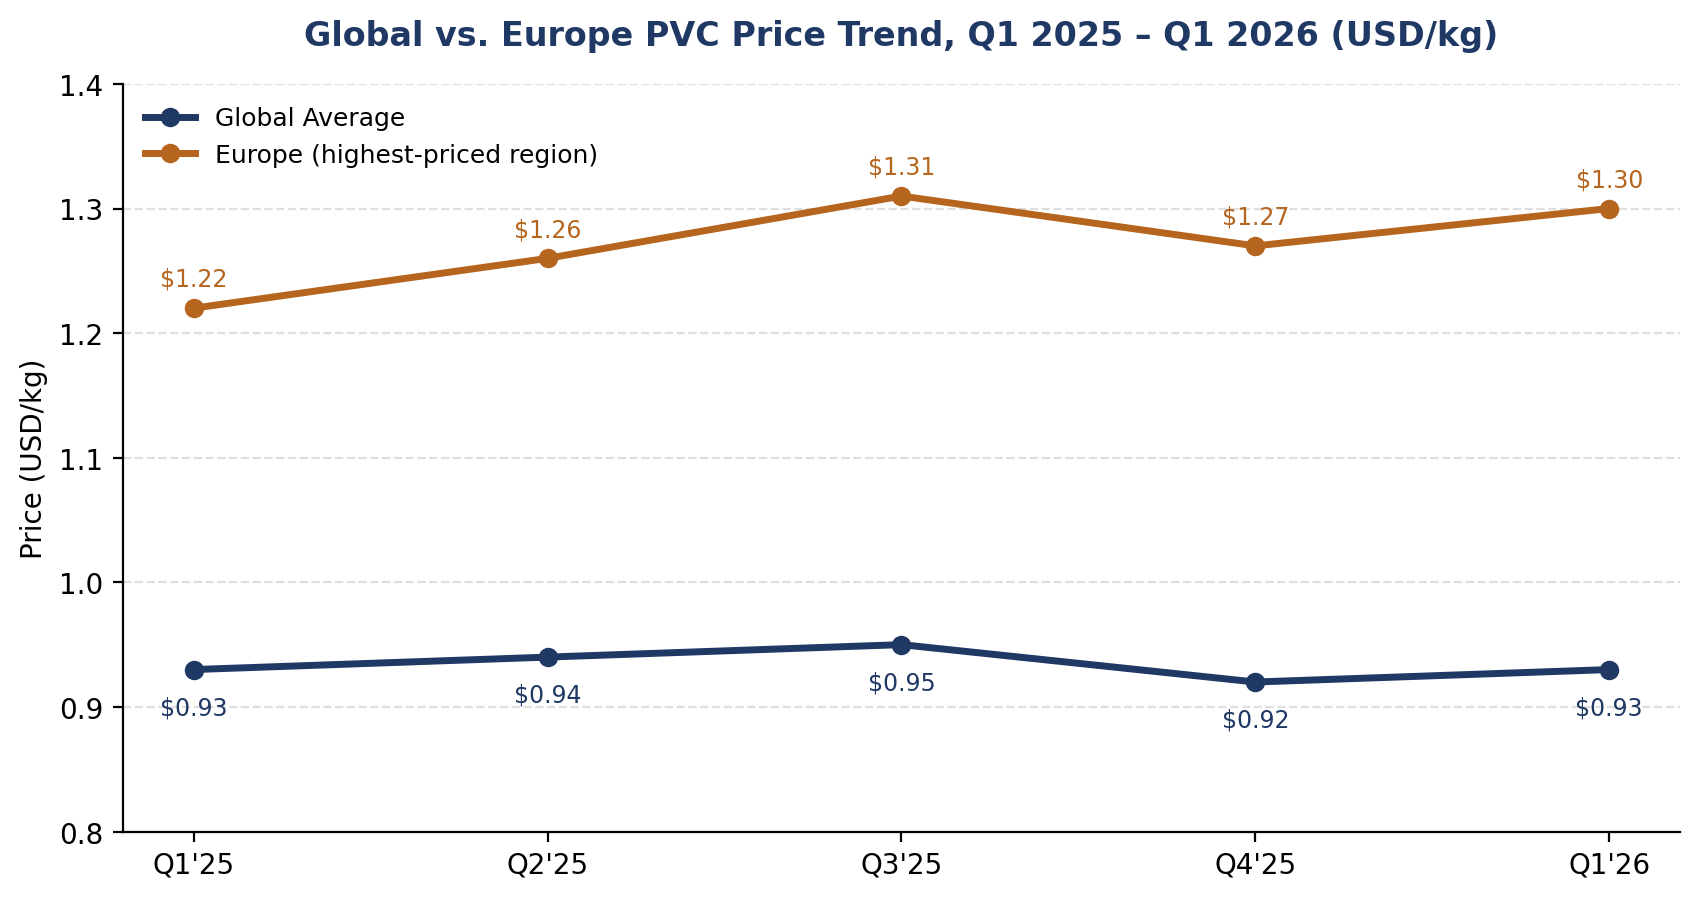
Figure 1: Global average vs. Europe PVC price trend, Q1 2025–Q1 2026 (USD/kg).
Regional dispersion in PVC pricing remains wide, and the gap between the cheapest and most expensive tracked markets has actually grown over the past two quarters. Germany, representative of the broader Western European market, priced at USD 940–946 per metric tonne through Q1–Q2 2026, more than double Brazil's USD 444–460/MT over the same period. The United States recorded the sharpest sequential move of any tracked market, climbing from USD 557/MT in Q1 2026 to USD 624–644/MT by June, a gain of roughly 12–16% in a single quarter, driven by firm order volumes from pipe, fittings and broader infrastructure-linked buyers that encouraged domestic suppliers to hold higher offer levels. Japan moved from USD 584/MT to USD 609/MT over the same window, a more modest 4% gain consistent with Northeast Asia's generally steadier price pattern, where elevated natural-gas-linked energy costs and reduced operating rates among regional producers have kept supply relatively tight even as demand growth stays measured. India, at USD 846/MT, sits closer to the European tier than to its Asian neighbours, a reflection of import-dependency and the anti-dumping duty regime discussed in the trade-policy section below. The table and chart that follow summarise the five-market comparison; note that Asia-Pacific as a bloc still accounts for the large majority of global PVC consumption despite not commanding the highest per-tonne price, underscoring that regional price level and regional demand weight are only loosely correlated in this market.
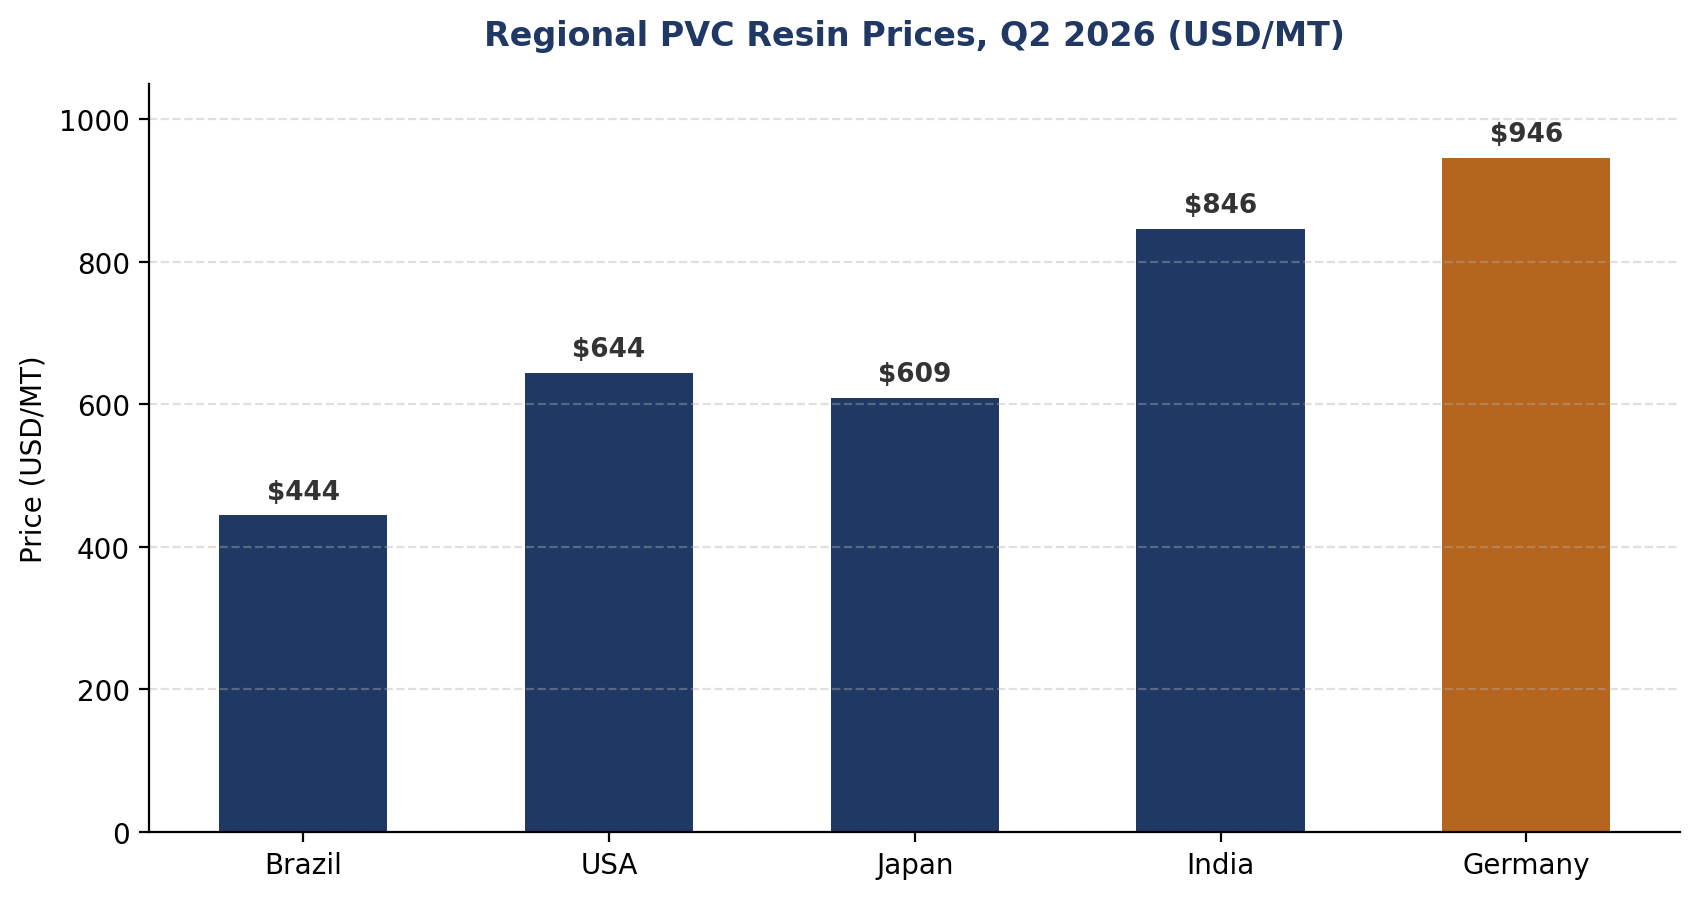
Figure 2: Regional PVC resin prices, Q2 2026 (USD/MT).
| Region | Q1 2026 (USD/MT) | Q2 2026 (USD/MT) | Q/Q Change | Price Tier |
| Germany | 940 | 946 | +0.6% | Highest |
| India | 846 | ~850 | ~flat | High |
| USA | 557 | 644 | +15.6% | Mid |
| Japan | 584 | 609 | +4.3% | Mid |
| Brazil | 444 | ~460 | ~flat | Lowest |
Table 1: Quarter-on-quarter regional price comparison, Q1–Q2 2026. India and Brazil Q2 figures are directional estimates pending final print.
PVC is manufactured by polymerising vinyl chloride monomer (VCM), itself produced by combining ethylene typically cracked from naphtha or ethane with chlorine derived from the electrolysis of salt via the chlor-alkali process. This dual feedstock dependency means PVC pricing sits at the intersection of two entirely different cost bases: hydrocarbon markets on the ethylene side, and energy-intensive electrolysis on the chlorine side. The value-chain diagram below illustrates this flow. In practice, the chlorine leg has been the more consequential swing factor over the past eighteen months, because chlor-alkali production is highly electricity-intensive and regional energy price differentials particularly Europe's elevated natural gas costs relative to the US Gulf Coast and Middle East translate almost directly into regional PVC price spreads. This is the primary structural reason Europe has commanded a persistent 30%-plus premium over the global average: European producers are simply paying more to make the chlorine half of the molecule. On the ethylene side, integrated producers with access to advantaged feedstock (US ethane crackers, Middle East associated gas) enjoy a structural cost advantage that is increasingly showing up as new capacity, discussed further below. For procurement teams, the practical implication is that tracking regional energy price trends European gas prices in particular is now nearly as important as tracking PVC spot offers themselves, since energy cost pass-through has become the dominant driver of the regional price spread documented in Figure 2.
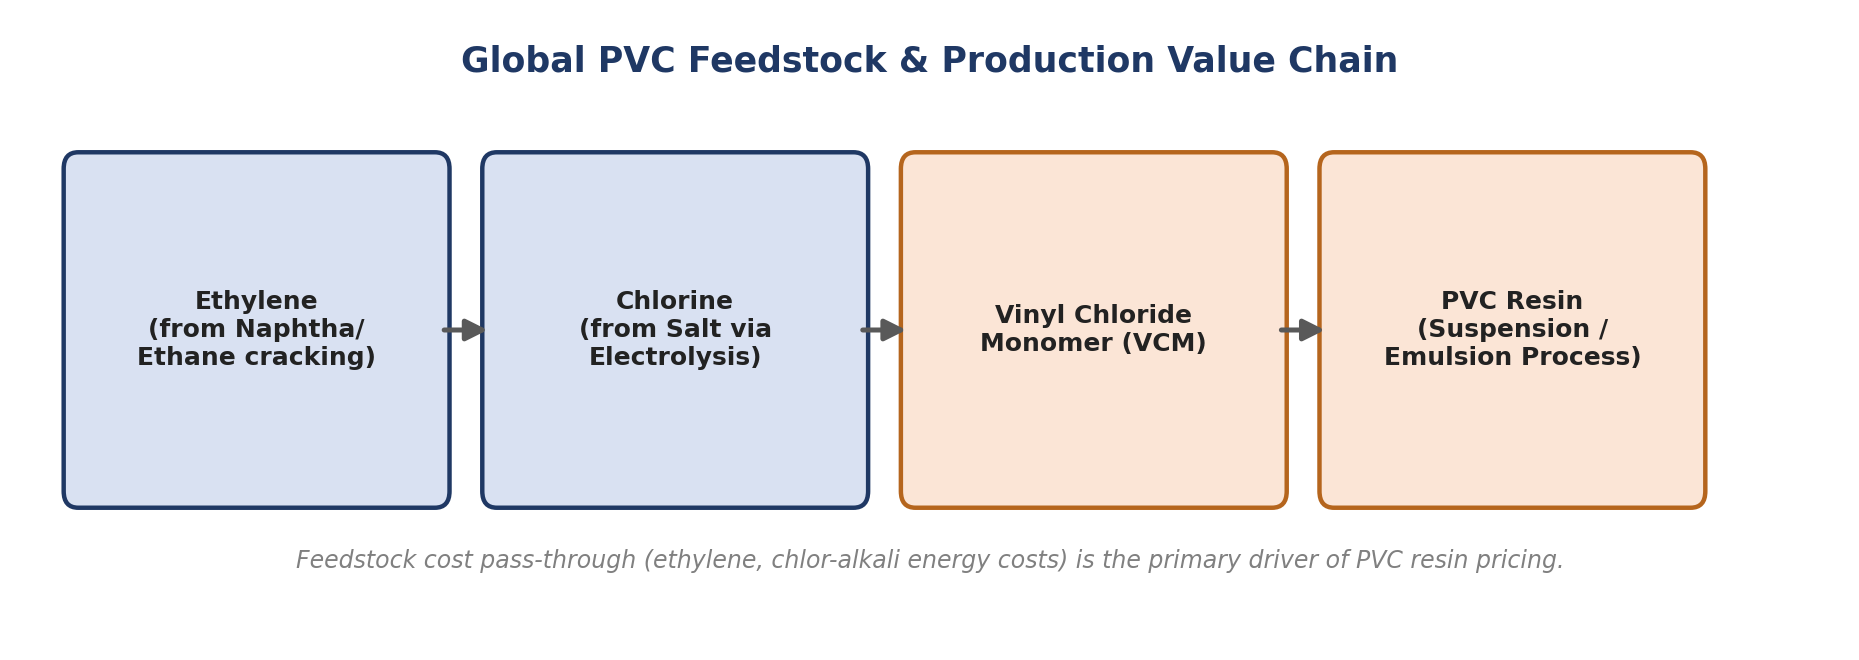
Figure 3: Global PVC feedstock and production value chain.
Construction remains overwhelmingly the dominant end-use for PVC, with pipes, fittings, window profiles and other building applications accounting for close to four-fifths of downstream consumption globally, which makes the market unusually sensitive to real estate cycles specifically rather than industrial activity broadly. China's prolonged real estate slowdown continues to be the single largest drag on global demand sentiment entering the second half of 2026, with only tentative signs of stabilisation rather than a clear recovery. Europe presents a more constructive demand narrative: progress in Russia-Ukraine peace negotiations has raised expectations of post-war reconstruction-linked consumption, and market sentiment across the region has turned cautiously optimistic even though actual reconstruction-driven offtake has yet to materialise at scale. In the United States, steady project execution and improved purchasing interest from pipe and fittings manufacturers supported the sharp Q1–Q2 2026 price acceleration noted above, suggesting that infrastructure-linked demand is currently the healthiest pocket of the global market. Beyond construction, automotive and electrical-sector consumption provides a smaller but more stable demand base, less exposed to the real estate cycle, and healthcare-related rigid PVC applications continue to grow steadily, though neither is large enough to offset a sustained construction downturn. Overall, the demand picture into late 2026 is best described as regionally bifurcated: Asia-Pacific demand growth remains muted and China-dependent, Europe is sentiment-positive but not yet volume-positive, and North America is the clearest near-term bright spot.
Supply-side news flow over the past several months has been dominated by capacity additions in the Middle East, most notably the roughly USD 1.99 billion engineering, procurement and construction contract awarded for one of the world's largest integrated PVC production complexes at Ruwais, Abu Dhabi, part of a broader downstream expansion strategy by the region's national energy champion.
This project, along with similar Gulf-region investment, reflects the structural cost advantage that low-cost associated gas feedstock confers relative to Europe's gas-constrained producers, and over time should add meaningful low-cost export volume into Asian and African markets. Elsewhere, Northeast Asian producers have continued to run at reduced operating rates, a combination of elevated energy costs and, in some cases, deliberate rationalisation in response to persistently thin margins, which has helped keep regional supply relatively tight even against soft demand. European producers have followed a similar rationalisation path over the past two years, with capacity closures and reduced run rates helping to support the region's premium pricing even as end-demand stays soft — effectively, European producers are managing the market via supply discipline rather than relying on demand growth. In the Americas, US suppliers have generally maintained higher offer levels on the back of healthy order books rather than through capacity constraints, meaning the region's recent price strength is more demand- than supply-driven, and therefore arguably less durable if infrastructure spending growth were to slow. Producers globally are also watching new supply out of the Middle East and, longer term, incremental Chinese capacity, both of which represent downside price risk if they arrive faster than demand can absorb them.
Trade policy has become an increasingly active variable in PVC pricing rather than a background factor. India's Directorate General of Trade Remedies recommended five-year anti-dumping duties on PVC resin imports in August 2025, a measure that helps explain why Indian domestic prices have held at a premium to most of Asia despite the country's proximity to lower-cost regional supply. In the United States, exporters are simultaneously navigating tariff-related headwinds on outbound shipments while benefiting domestically from expectations of production discipline, a combination that has supported firmer US offer levels even as export competitiveness comes under some pressure. There is also a broader shift underway in Indian import dynamics, with expectations that US material could capture a larger share of Indian demand following the removal of certain control measures, a development worth monitoring closely by buyers in South Asia.
For procurement and trading teams, the practical takeaway is that regional price forecasts can no longer be built on supply-demand fundamentals alone; anti-dumping determinations, tariff schedules and bilateral trade measures are now first-order inputs, capable of moving regional price tiers independently of underlying cost or demand conditions, and should be tracked with the same rigor as feedstock and freight costs.
Into the second half of 2026, the base case is for continued regional divergence rather than a return to a single global trend. Europe is likely to hold its premium as long as energy costs and rationalised capacity keep local supply tight, with upside risk if reconstruction-linked demand begins to materialise in volume. North America's recent price strength looks the most likely to moderate somewhat as the current order-book-driven rally matures, though a sustained infrastructure spending cycle could keep the region firmer than Asia for longer. Asia-Pacific, and China in particular, remains the key swing factor for the global average: any genuine stabilisation in Chinese real estate activity would be the single most impactful catalyst for a broader price recovery, given the region's outsized share of global consumption, while continued weakness would keep global average prices range-bound near current levels. New Middle East capacity is a medium-term downside risk to watch, particularly for import-dependent Asian and African buyers, but is unlikely to materially affect pricing before late 2026 or 2027 given typical ramp-up timelines. On balance, we expect the global average to remain within a USD 0.90–0.98/kg band through year-end, with regional spreads rather than the global average itself continuing to be the more decision-relevant metric for buyers and traders alike