Global Rare Gas (Neon/Xenon) Price Tracker
Monthly Cost & Market Analysis — January to August 2026 Neon | Xenon | Semiconductor-Grade Rare Gas Composite Cost Index, Supply & Demand Drivers


Monthly Cost & Market Analysis — January to August 2026 Neon | Xenon | Semiconductor-Grade Rare Gas Composite Cost Index, Supply & Demand Drivers
Global Rare Gas Prices continued their gradual normalization through the first eight months of 2026, with both neon and xenon composite costs extending the retreat from the extraordinary highs set in the aftermath of the 2022 Ukraine supply shock, even as both gases remained priced well above their pre-crisis benchmarks. The Epignosis Insights composite index for semiconductor-grade neon opened January 2026 at an estimated USD 58 per cubic metre and eased to roughly USD 48 per cubic metre by August, a decline of nearly 17 percent across the tracking window, while the composite index for xenon opened January at an estimated USD 3,050 per kilogram and eased to roughly USD 2,650 per kilogram over the same period, a decline of around 13 percent.
Despite this sustained easing, neon remained priced at close to eleven times its pre-2022 benchmark of roughly USD 4.50 per cubic metre by August, and xenon remained priced at close to 1.7 times its pre-2022 benchmark of roughly USD 1,550 per kilogram, underscoring how far both markets still sit from pre-crisis normalcy even four years on. The improvement was driven primarily by diversified sourcing away from Ukraine's historically dominant share of semiconductor-grade neon output, expanded air-separation capacity in China and South Korea, softer semiconductor procurement urgency following a period of inventory rebuilding, and steady rather than accelerating demand from aerospace and medical end markets for xenon. This report walks through the month-by-month price trajectory for both gases, breaks down the distinct supply and demand dynamics shaping neon and xenon individually, and sets out the manufacturing and geopolitical forces likely to influence rare gas costs into the fourth quarter.
Rare gas prices entered 2026 still carrying a substantial geopolitical risk premium tied to the prolonged disruption of Ukrainian neon and xenon output, which before 2022 supplied a majority of the world's semiconductor-grade neon feedstock through cryogenic air-separation plants co-located with steel production. The Epignosis Insights neon composite opened January near USD 58 per cubic metre and eased to USD 56 by February as buyers reported comfortable inventory positions built up during the prior year's destocking cycle. March brought a further easing to roughly USD 54 per cubic metre as new air-separation capacity commissioned in China and South Korea began contributing meaningfully to global supply, a development that several industry participants described as the clearest structural signal yet that the market's post-2022 dependence on a narrow set of suppliers was easing.
April and May saw the composite continue its gradual decline to USD 53 and then USD 52 per cubic metre, supported by steady but not accelerating demand from advanced-node logic and memory fabrication as chipmakers absorbed higher wafer starts without triggering renewed spot-market urgency. June marked the sharpest single-month move of the tracking window, with the composite falling to USD 50 per cubic metre as one of the newly commissioned Asian air-separation units reported reaching full nameplate capacity ahead of schedule, adding incremental tonnage to an already improving supply picture. The composite eased further to USD 49 per cubic metre in July and USD 48 by August as procurement teams, now several years removed from the acute 2022 shortage, increasingly transacted on longer-dated contracts rather than premium-priced spot volumes, a shift that has itself contributed to reduced price volatility even as absolute costs remain historically elevated.
Xenon followed a comparable but distinct trajectory, reflecting its different production economics and end-use mix. The Epignosis Insights xenon composite opened January at USD 3,050 per kilogram and eased modestly to USD 2,980 by February as air-separation output remained broadly stable and semiconductor-sector xenon consumption, concentrated in etch and deposition processes at leading-edge fabs, held steady rather than surging. March saw a further easing to USD 2,900 per kilogram, coinciding with a widely reported surge in global semiconductor sales that nonetheless failed to translate into aggressive spot xenon buying, since most leading fabs had already locked in annual supply agreements earlier in the cycle. April and May brought continued softening to USD 2,850 and then USD 2,800 per kilogram as inventories rebuilt across major consuming regions and cautious procurement strategies limited spot-market premiums even as underlying demand from healthcare imaging, satellite electric propulsion, and high-intensity lighting remained resilient. The composite eased to USD 2,750 per kilogram in June and USD 2,700 in July as broader industrial gas output, of which xenon is a trace by-product, continued at healthy operating rates across major air-separation hubs in the United States, China, and Europe. By August, the composite had eased to roughly USD 2,650 per kilogram, keeping xenon within the softer end of the range most industry observers now consider the “new normal” for a market still adjusting to a permanently smaller pool of low-cost Eastern European supply.
Neon and xenon, while both trace by-products of cryogenic air separation and both central to advanced semiconductor manufacturing, diverge meaningfully in how their respective cost structures have evolved since 2022. Neon's dominant historical supply base, concentrated in Ukrainian producers operating in close proximity to major steelworks, remains only partially restored, and the bulk of the market's recovery has instead come from newly built or expanded capacity in China, South Korea, and the United States, much of it developed specifically in response to the 2022 shortage. This diversification has meaningfully reduced single-country concentration risk, but semiconductor-grade neon purified to 99.999 percent or higher for use in excimer laser lithography gas mixtures continues to command a substantial purity premium over industrial-grade neon used in signage and general illumination, and demand for that highest grade continues to climb as leading-edge nodes require proportionally more neon per wafer than older process generations.
Xenon's supply base, by contrast, was never as geographically concentrated as neon's, with meaningful air-separation output historically spread across the United States, Russia, France, and China in addition to Ukraine, which limited the severity of xenon's 2022 price spike relative to neon's on a percentage basis even though both gases remain multiples above pre-crisis levels in absolute terms. Xenon demand is also more diversified across end markets than neon's, split between semiconductor processing, medical imaging and anaesthesia, satellite and spacecraft electric propulsion using xenon-fuelled Hall-effect and ion thrusters, and high-intensity lighting, meaning xenon pricing responds to a broader and somewhat less correlated set of demand drivers than the semiconductor-concentrated neon market.
Regional price dispersion remained notable across both gases throughout the window, reflecting differences in local air-separation capacity, freight costs, and proximity to end-use demand clusters. North American and European buyers generally paid a premium over Chinese benchmarks for both neon and xenon, reflecting China's larger domestic air-separation base and correspondingly lower logistics costs for material consumed close to production. South Korean buyers, concentrated around the Pyeongtaek semiconductor cluster, continued to pay some of the highest regional premiums for ultra-high-purity neon given the cluster's outsized dependence on imported lithography-grade gas mixtures. These regional spreads narrowed only slightly over the tracking window, suggesting that full price convergence across regions remains some way off even as the global composite continues to ease.
The dominant supply-side theme of the tracking window was continued capacity diversification away from the pre-2022 concentration in Eastern European production, rather than any single feedstock or geopolitical event. A joint venture between a South Korean steelmaker and a Chinese cryogenic technology specialist, which began supplying neon, xenon, and krypton to leading semiconductor customers in the prior year, continued ramping output through the first half of 2026, contributing meaningfully to the improved availability that underpinned the composite's steady decline. In the United States, a specialist rare-gas reprocessing company expanded its role in the domestic supply chain during the window, including a multi-year agreement to support recovery and reprocessing of xenon gas mixtures for space and propulsion applications, reflecting the growing strategic importance placed on securing domestic rare-gas capacity for both commercial and government end uses.
Broader industrial gas majors operating global air-separation networks continued to report stable to improving operating rates across their major production hubs, supporting consistent by-product recovery of both gases. Materials and processing constraints remain a persistent, if diminishing, headwind: rare gas recovery is inherently tied to the scale of primary industrial gas and steel production, meaning neon and xenon supply cannot expand independently of broader industrial activity, and purity requirements for semiconductor-grade material continue to limit how quickly newly commissioned capacity can be qualified for the most demanding lithography and etch applications.
Demand-side dynamics for both gases in 2026 remained anchored by the ongoing global semiconductor upcycle, with industry association data pointing to global semiconductor sales rising sharply on a year-on-year basis during the first quarter, driven by strong demand for advanced logic and memory. Even so, the tracking window did not see a repeat of the acute spot-market panic buying that characterized 2022, as most leading foundries and memory makers now maintain more diversified supplier panels and longer-dated procurement agreements for both neon and xenon than they did before the crisis.
Beyond semiconductors, xenon demand continued to broaden into adjacent applications, with satellite operators and space agencies increasingly favouring xenon-fuelled electric propulsion systems for their efficiency advantages over chemical thrusters, while medical imaging providers maintained steady baseline consumption. Neon demand remained more narrowly concentrated in semiconductor lithography and general illumination, with the former increasingly dominant as older neon signage applications continue a long-term structural decline relative to industrial and electronics end uses.
Looking toward the fourth quarter, the tracker's base case anticipates continued gradual easing rather than a sharp inflection for either gas, with the neon composite expected to drift toward a range of roughly USD 44 to USD 48 per cubic metre by year-end and the xenon composite expected to ease toward USD 2,500 to USD 2,650 per kilogram, as newly commissioned Asian and North American capacity continues to ramp and procurement strategies remain focused on long-term contracts over spot purchases. The single largest swing factor for both markets remains geopolitical: any renewed disruption to Eastern European air-separation output, or a sharp acceleration in semiconductor capital spending tied to next-generation lithography rollouts, could quickly tighten availability of the highest-purity gas grades even as headline industrial supply continues to expand.
Government and industry efforts to diversify rare gas sourcing are expected to remain a supporting rather than a determining factor, given that newly built capacity, while meaningful, still represents a fraction of what a full restoration of pre-2022 Eastern European output would provide. Procurement and strategy teams evaluating long-term rare gas supply agreements should continue to treat the composite index presented here as a directional planning benchmark rather than a quotable transaction price, given the continued thinness of open spot trading in both gases relative to more liquid industrial commodities.
This tracker is compiled and maintained by Epignosis Insights as the primary aggregating source, drawing on a deliberately diversified evidence base rather than any single price-reporting agency, reflecting the reality that neon and xenon do not trade on an open, liquid spot market in the way established industrial commodities do. A government agency's mineral commodity data anchors the long-run production and reserves context for both gases; an industry association's semiconductor sales reporting anchors the demand-side chronology; a listed industrial gas major's annual report and investor disclosures anchor the supply-side capacity and capital expenditure narrative; a specialist industrial-gas and cryogenics consulting firm anchors the broader market structure and pricing-mechanism context; and international trade news anchors the real-time chronology of supply chain developments, including new capacity announcements and strategic agreements. Each of these source categories is used once in this edition to avoid over-reliance on any single voice, and the composite cost figures presented here should be read as directional, analyst-informed estimates rather than transactable market prices, since actual neon and xenon costs vary substantially by purity grade, contract structure, order volume, and delivery region.
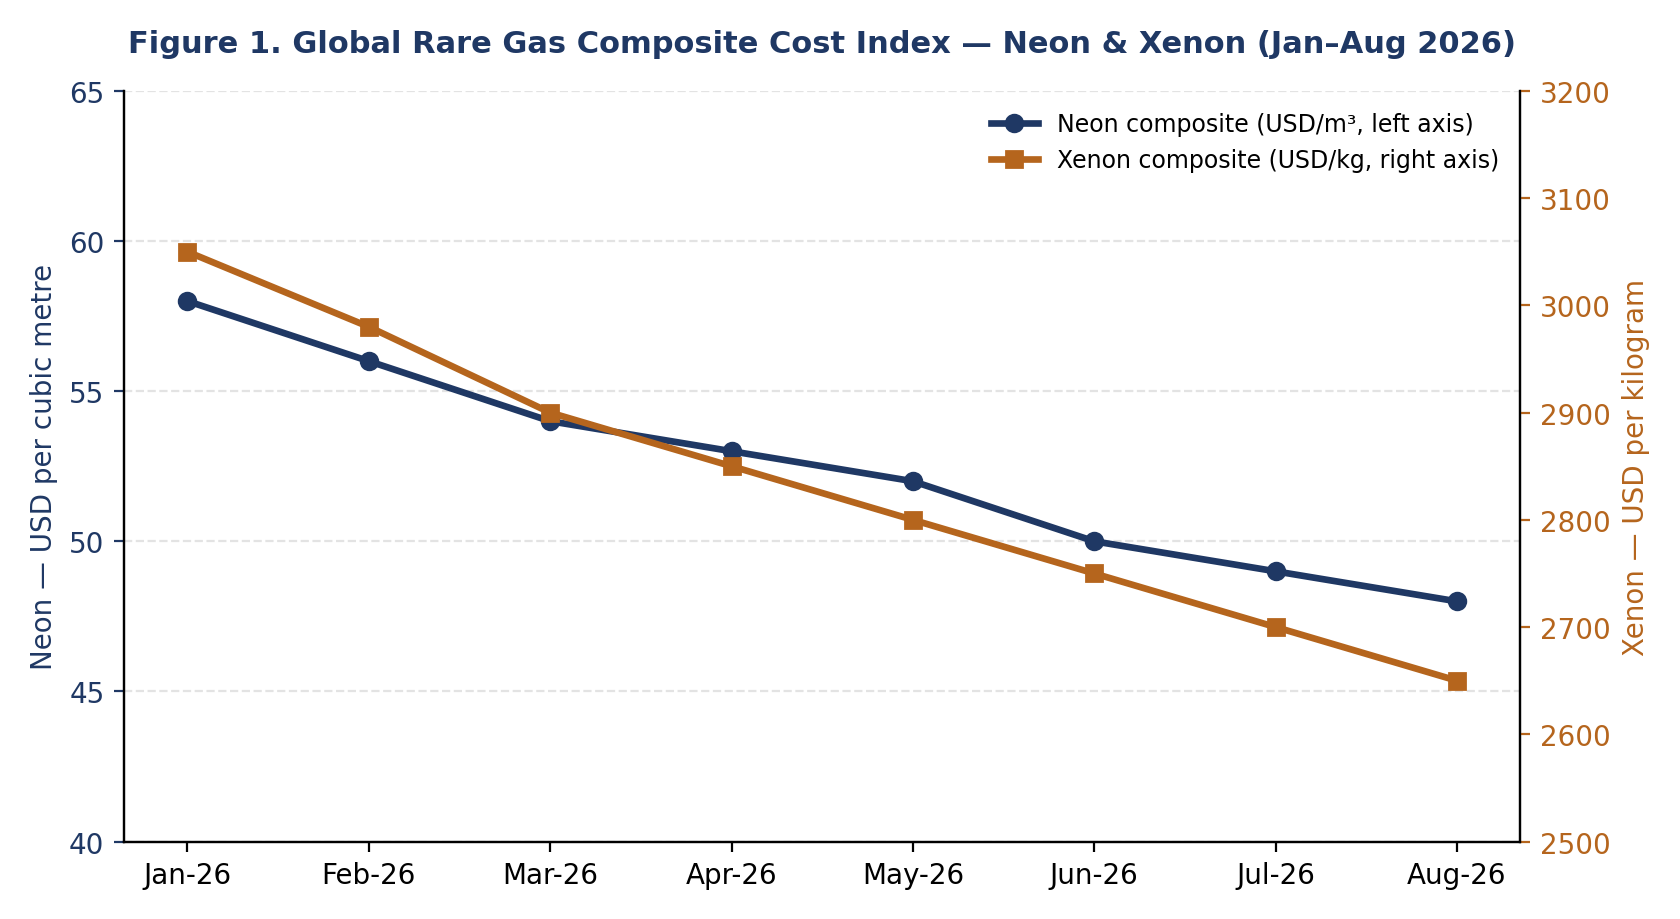
Figure 1. Global rare gas composite cost index, neon and xenon, January–August 2026 (USD). Source: Epignosis Insights composite estimate.
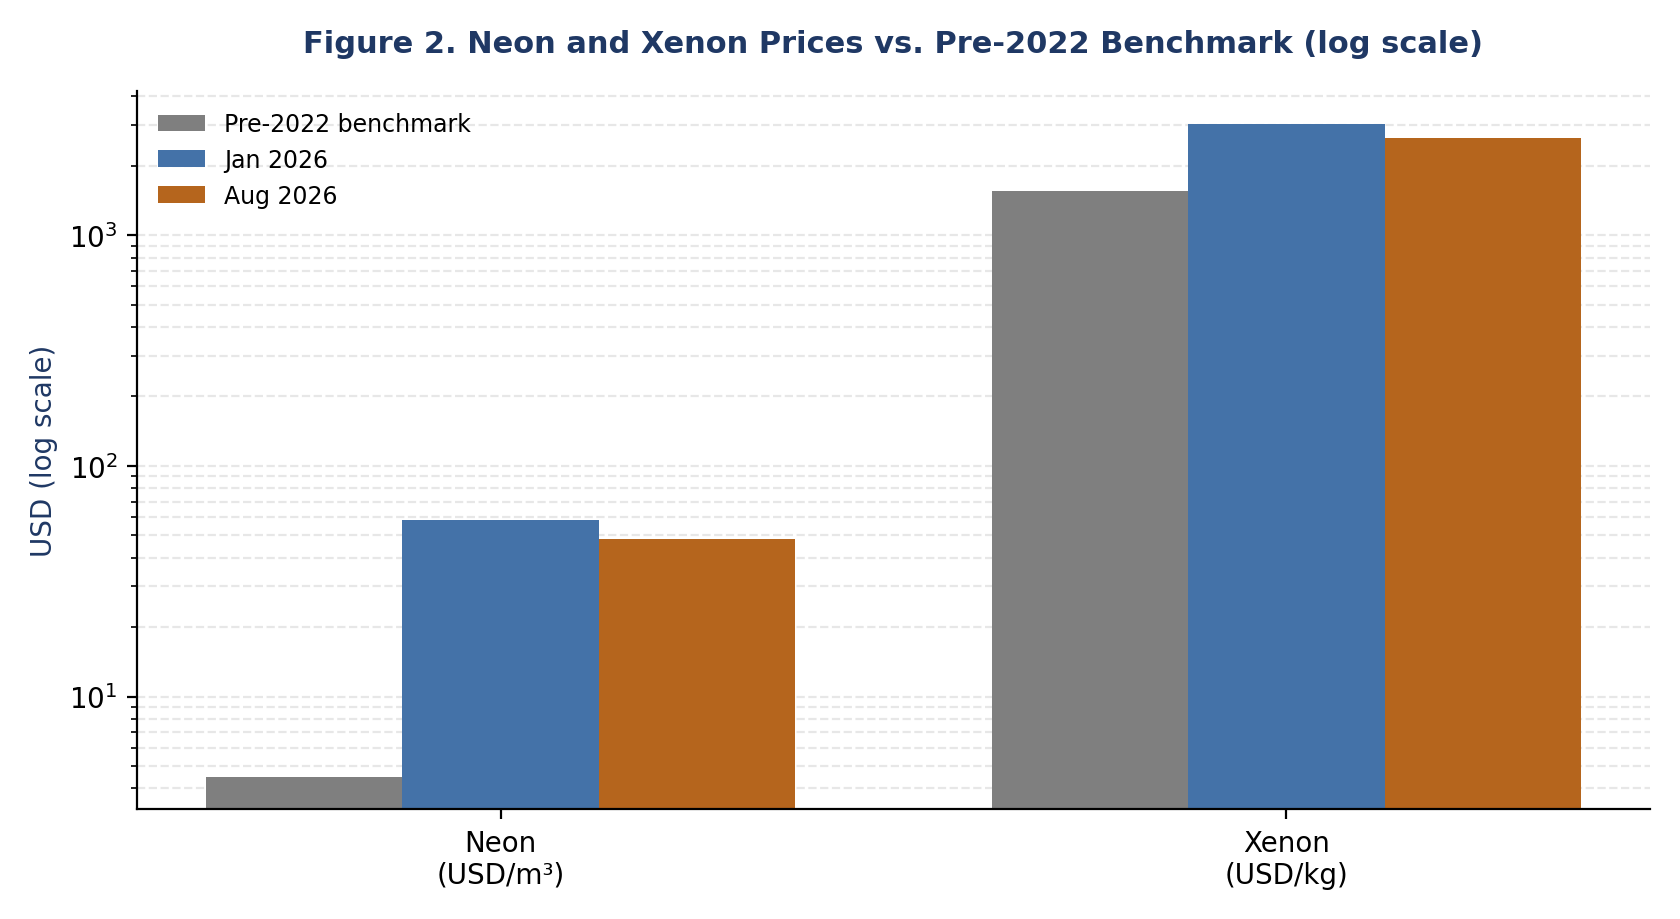
Figure 2. Neon and xenon prices vs. pre-2022 benchmark, log scale (USD). Source: Epignosis Insights composite estimate.
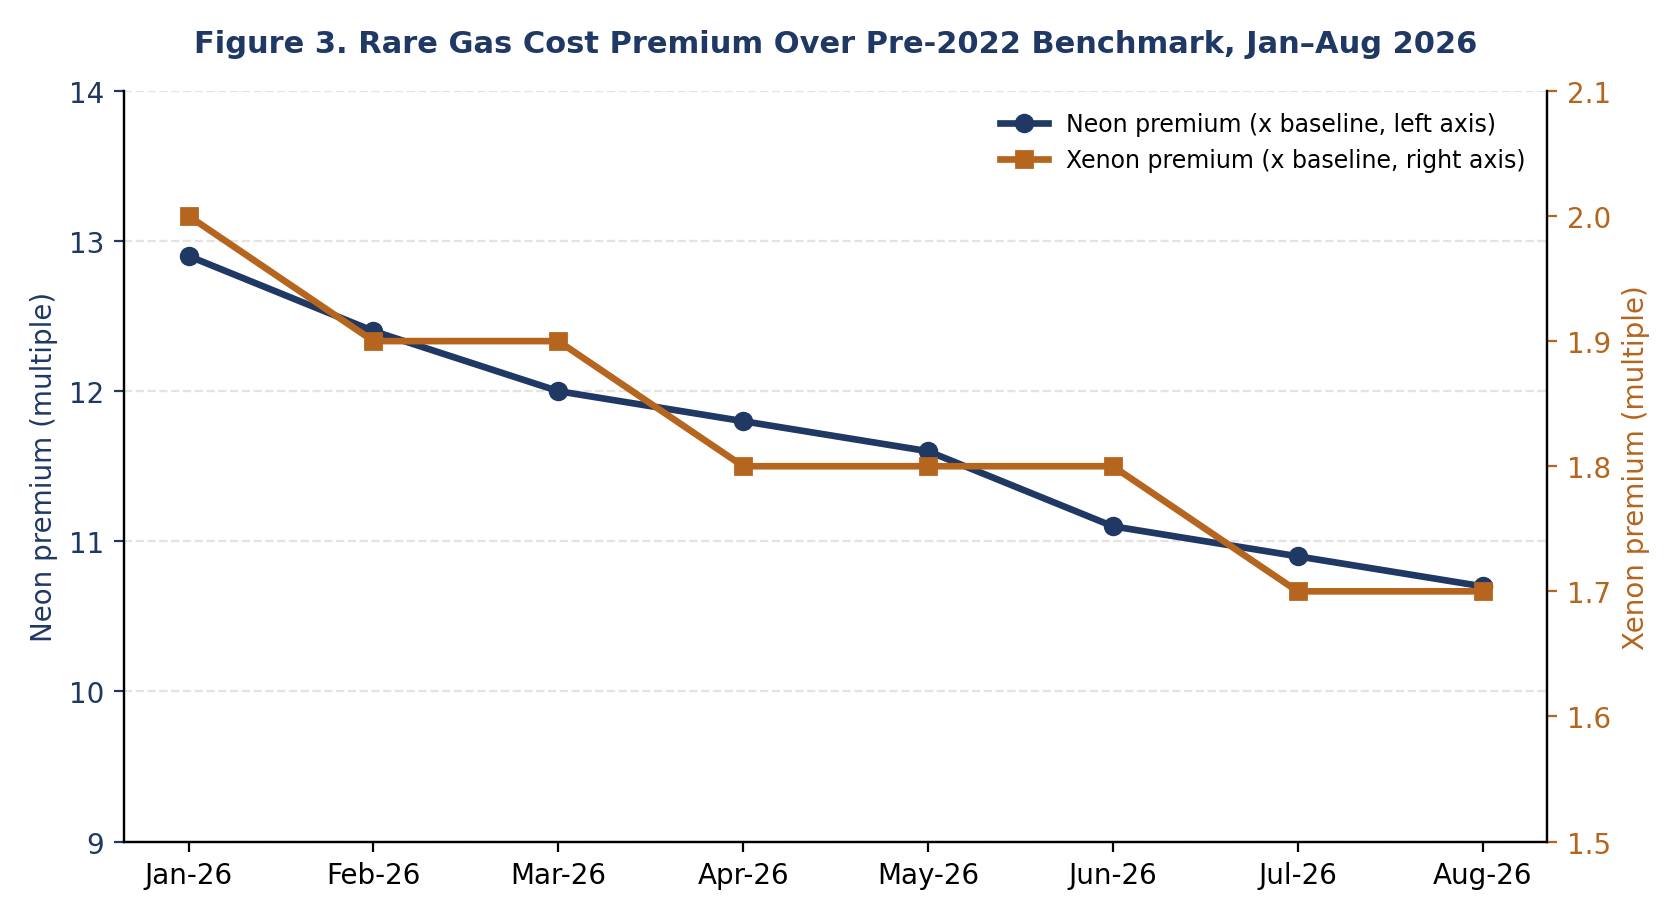
Figure 3. Rare gas cost premium over pre-2022 benchmark, January–August 2026 (multiple). Source: Epignosis Insights composite estimate.
The table below summarizes the composite and premium figures charted above. Neon is presented in USD per cubic metre and xenon in USD per kilogram; the bottom two rows show each gas's cost premium as a multiple of its pre-2022 benchmark.
| Metric | Jan-26 | Feb-26 | Mar-26 | Apr-26 | May-26 | Jun-26 | Jul-26 | Aug-26 |
| Neon Composite (USD/m³) | 58 | 56 | 54 | 53 | 52 | 50 | 49 | 48 |
| Xenon Composite (USD/kg) | 3,050 | 2,980 | 2,900 | 2,850 | 2,800 | 2,750 | 2,700 | 2,650 |
| Neon Premium (x pre-2022 baseline) | 12.9 | 12.4 | 12.0 | 11.8 | 11.6 | 11.1 | 10.9 | 10.7 |
| Xenon Premium (x pre-2022 baseline) | 2.0 | 1.9 | 1.9 | 1.8 | 1.8 | 1.8 | 1.7 | 1.7 |