Global Polycarbonate Price Tracker
Monthly Pricing & Market Analysis — January to August 2026 Polycarbonate (PC) | Composite Index, Regional Benchmarks, Supply & Demand Drivers


Monthly Pricing & Market Analysis — January to August 2026 Polycarbonate (PC) | Composite Index, Regional Benchmarks, Supply & Demand Drivers
Global Polycarbonate (PC) Markets spent the first quarter of 2026 extending a soft patch that had already taken hold in late 2025, before feedstock-driven cost pressure and a mid-year logistics shock pulled prices back up through the second and third quarters. The Epignosis Insights composite price index opened January near USD 2,850 per metric tonne and drifted down to roughly USD 2,720 by March as ample regional supply met subdued demand from the automotive, electronics and construction sectors. From April onward the picture reversed: rising bisphenol A (BPA) and phosgene feedstock costs, themselves a function of tightening phenol, acetone and crude oil markets tied to the escalating Iran-Israel-United States conflict, pushed North American producers to raise polycarbonate list prices effective May 1, while Northeast Asian and European benchmarks climbed through June. A late-summer complication emerged in August, when low water levels on the Rhine forced at least one major European producer to declare force majeure on shipments, adding a fresh logistics premium on top of an already firmer feedstock base. By August the composite stood near USD 3,050 per tonne, roughly seven percent above the January starting point and eleven percent above the March low. This report walks through that trajectory month by month, breaks down regional price dynamics, and sets out the supply and demand forces likely to shape polycarbonate pricing into the fourth quarter.
Polycarbonate entered 2026 carrying the momentum of a weak fourth quarter of 2025, in which balanced-to-ample supply across North America, Europe and Asia met subdued downstream buying from automotive, electronics and construction customers. That pattern continued into January and February, with the global composite easing from roughly USD 2,850 to USD 2,800 per tonne as regional producers, running at comfortable inventory levels, competed for scarce order volume rather than defending price. March extended the softening: regional benchmarks recorded quarter-over-quarter declines of two to four percent as weak demand from automotive and consumer-electronics buyers combined with sufficient domestic supply and largely stable feedstock costs to keep the market synchronized in a downward direction across North America, Europe and both Northeast and Southeast Asia. The composite bottomed near USD 2,720 per tonne in March, the low point of the eight-month tracking window. April marked the turn. Escalating conflict in the Middle East placed the Strait of Hormuz, and with it a meaningful share of regional crude, naphtha and LNG flows, under direct threat, and the resulting rise in benzene, phenol and acetone costs fed directly into bisphenol A, polycarbonate's principal feedstock alongside phosgene. Government energy forecasters flagged Middle East production shut-ins reaching into the millions of barrels per day during April, a scale of disruption that lifted crude benchmarks and, with a lag of several weeks, pushed BPA and downstream polycarbonate costs higher across every major producing region. North American polycarbonate list prices moved up from May 1 onward, a change trade press coverage linked to a combination of seasonal construction demand, inventory rebuilding and higher feedstock costs. The composite climbed to roughly USD 2,950 per tonne in May and continued to USD 3,020 in June as Northeast Asian benchmarks recorded some of the sharpest percentage gains of the year, with Chinese spot values moving up materially as regional buyers absorbed higher landed BPA costs. July brought a modest pause, with the composite easing to about USD 2,980 per tonne as Chinese BPA prices softened on ample regional inventory even as other feedstock costs stayed elevated. August reintroduced upward pressure through a different channel entirely: persistently low water levels on the Rhine constrained barge logistics serving major European chemical sites, prompting at least one large regional polycarbonate producer to declare force majeure on affected shipments. That logistics-driven tightness, layered on top of already firmer feedstock costs, pushed the composite back up to roughly USD 3,050 per tonne by the close of the tracking window.
Regional polycarbonate benchmarks moved in reasonably close step through the first quarter's downturn but diverged meaningfully once the feedstock and logistics shocks took hold. North America entered the year near USD 3,230 per tonne and eased to around USD 3,140 by March on weak automotive and consumer-goods demand alongside comfortable domestic supply, before the May 1 price increase lifted the regional benchmark back toward USD 3,190 per tonne; by August, North American values had settled around USD 3,140 per tonne as the initial increase was only partially sustained against a backdrop of still-cautious downstream buying. Europe, represented here by the German benchmark, followed a shallower decline in the first quarter, moving from roughly USD 3,460 to USD 3,380 per tonne as balanced supply conditions and manageable energy costs kept the market from falling as sharply as some other regions; from April the European benchmark firmed steadily, reaching close to USD 3,560 per tonne by August as the Rhine logistics disruption added a fresh constraint on top of already tighter feedstock economics. Northeast Asia, anchored by China, recorded the most dramatic swing of the year: prices eased from around USD 1,980 to USD 1,920 per tonne through the first quarter on ample regional supply, then rose sharply from April through June, climbing above USD 2,300 per tonne as Chinese producers absorbed higher landed bisphenol A costs tied to the broader petrochemical disruption, before easing modestly to around USD 2,240 per tonne by August as regional BPA availability improved. India tracked a comparable arc to China, moving from roughly USD 2,000 per tonne in January down to USD 1,940 in March before climbing toward USD 2,180 per tonne by June, supported by steady demand from consumer appliance, automotive and lighting applications, and settling near USD 2,140 per tonne by August. Southeast Asia broadly mirrored the Northeast Asian pattern at a somewhat lower absolute price level throughout, reflecting the region's blend of domestic production and import dependence on both Northeast Asian and Middle Eastern cargoes.
The defining supply-side theme of the first quarter was simple oversupply: producers across North America, Europe and Asia entered 2026 with ample operating capacity relative to demand, a legacy of investment cycles completed over the prior several years, and consequently ran at moderate-to-high utilization rates while competing aggressively on price to secure order volume. That dynamic reversed from April as the feedstock cost base underneath polycarbonate began to shift. Bisphenol A, polycarbonate's dominant raw material, is itself produced from phenol and acetone, both of which trace back through benzene and propylene to the refinery and steam-cracker chain; when crude oil and naphtha costs rose on Middle East supply concerns, that cost pressure transmitted into BPA within a matter of weeks and from there into polycarbonate contract pricing. Regional BPA markets did not move in lockstep, however: government energy data pointed to a sharp April spike in crude benchmarks tied to Middle East production shut-ins, while Asian BPA producers, sitting on ample domestic capacity exceeding several million tonnes annually, were able to keep pace with rising phenol and acetone costs without triggering the kind of acute shortage seen in seaborne polyolefin markets during the same period. The second major supply-side development arrived in August, when low water levels on the Rhine River constrained barge-based logistics serving several major European chemical production and distribution sites. Public company disclosures confirmed that at least one large polycarbonate and polyurethane producer declared force majeure on shipments tied to the disruption, even as the same company's second-quarter operating results showed a clear year-over-year improvement in revenue and earnings, illustrating how a recovering underlying market can still face acute short-term logistics constraints. Industry association data on the broader plastics-in-automobiles trend provided useful context for the demand side of the supply-demand balance, noting that the average North American vehicle contained substantially more plastics and polymer composites in 2025 than a decade earlier, a structural trend that continues to support polycarbonate consumption even as near-term automotive production volumes fluctuate quarter to quarter.
Polycarbonate demand remained functionally split between resilient structural growth drivers and more cyclical, near-term softness through the tracking window. Automotive applications, spanning headlamp lenses, glazing, interior trim and increasingly battery housings and lighting systems in electric vehicles, represent one of the largest and fastest-growing end uses, with lightweighting mandates and the continued rollout of electrified and software-defined vehicles supporting a structurally rising polycarbonate content per vehicle even as overall vehicle production growth stayed muted through the first half of the year. Electronics demand followed a similarly mixed pattern: polycarbonate's role in device housings, connectors and thin-wall components for smartphones, laptops and data-center hardware continued to expand structurally, even as near-term consumer electronics production faced its own supply constraints from an unrelated semiconductor and memory-chip shortage that intensified through 2026 and added cost and scheduling pressure to downstream device manufacturers. Construction and glazing applications, including multiwall sheet for greenhouse and skylight systems, provided a steadier demand base less exposed to the automotive and electronics cycles, though European construction activity remained subdued through much of the first half. Buyer behavior shifted meaningfully once feedstock costs began rising in April: converters that had been managing lean inventories during the soft first quarter faced a compressed window to secure supply ahead of the May 1 North American increase, while European and Asian buyers grew more cautious about forward commitments once it became clear that both feedstock costs and, later, logistics constraints were adding to landed costs simultaneously.
Heading into the fourth quarter, the tracker's base case anticipates continued but more moderate upward pressure on the global polycarbonate composite, with the index expected to settle in a range of roughly USD 2,950 to USD 3,150 per tonne, above the March trough but below any further spike scenario tied to renewed Middle East disruption. North America is likely to see relatively stable pricing as the May increase is tested against still-cautious automotive and consumer-goods demand. Europe's trajectory depends heavily on Rhine water levels and the pace of recovery from the August force majeure event; a prolonged logistics constraint into the fourth quarter would keep the regional benchmark elevated relative to the rest of the world. Asian markets, and China in particular, are expected to remain the primary source of near-term price relief given the region's substantial domestic BPA capacity and its demonstrated ability to absorb feedstock cost increases without acute shortage. Feedstock costs, and specifically the phenol-acetone-BPA chain's sensitivity to crude oil and Middle East geopolitical developments, remain the single most important variable for procurement teams to monitor, while structural demand growth from vehicle electrification and consumer electronics content per device should continue to provide a firmer long-term floor beneath the market than the first quarter's cyclical softness might have suggested. Procurement and specification teams should also weigh two variables that sit outside the headline composite index. The first is grade mix: optical-grade, flame-retardant and medical or food-contact polycarbonate grades carry a materially different cost structure than standard general-purpose resin, and regulatory attention on bisphenol A exposure in medical and food-contact applications is gradually pushing some buyers toward BPA-free copolymer alternatives, a shift that could soften demand for certain specialty grades even as standard-grade volumes stay firm. The second is qualification lead time: because automotive and electronics customers typically require lengthy requalification periods before switching suppliers or grades, sudden regional price divergence of the kind seen between North America and Europe in the second half of 2026 tends to persist for several quarters rather than arbitraging away quickly, since buyers cannot always shift sourcing fast enough to fully exploit a regional discount. On balance, the tracker's outlook favors continued regional dispersion rather than convergence through year-end, with Europe's logistics-driven premium the single largest swing factor to watch heading into the fourth quarter.
This tracker is compiled and maintained by Epignosis Insights as the primary aggregating source, drawing on a deliberately diversified evidence base rather than any single price-reporting agency. Government energy-statistics releases anchor the crude oil and feedstock narrative, industry-association data on plastics use in automobiles anchors the structural demand narrative, a listed producer's own quarterly disclosures anchor the margin and logistics-disruption narrative, a specialist commodity-intelligence and consulting firm anchors the broader engineering-plastics market context, and trade news coverage anchors the real-time chronology of regional price movements. Each of these source categories is used once in this edition to avoid over-reliance on any single voice, and figures are cross-checked across at least two independent references wherever the underlying series allowed for it. Because polycarbonate is sold across multiple grades, forms and specification levels, the composite index and regional figures presented here should be read as directional benchmarks rather than transactable settlement prices; actual contract terms vary by grade, volume commitment and buyer relationship.
Charts and Visual Summary
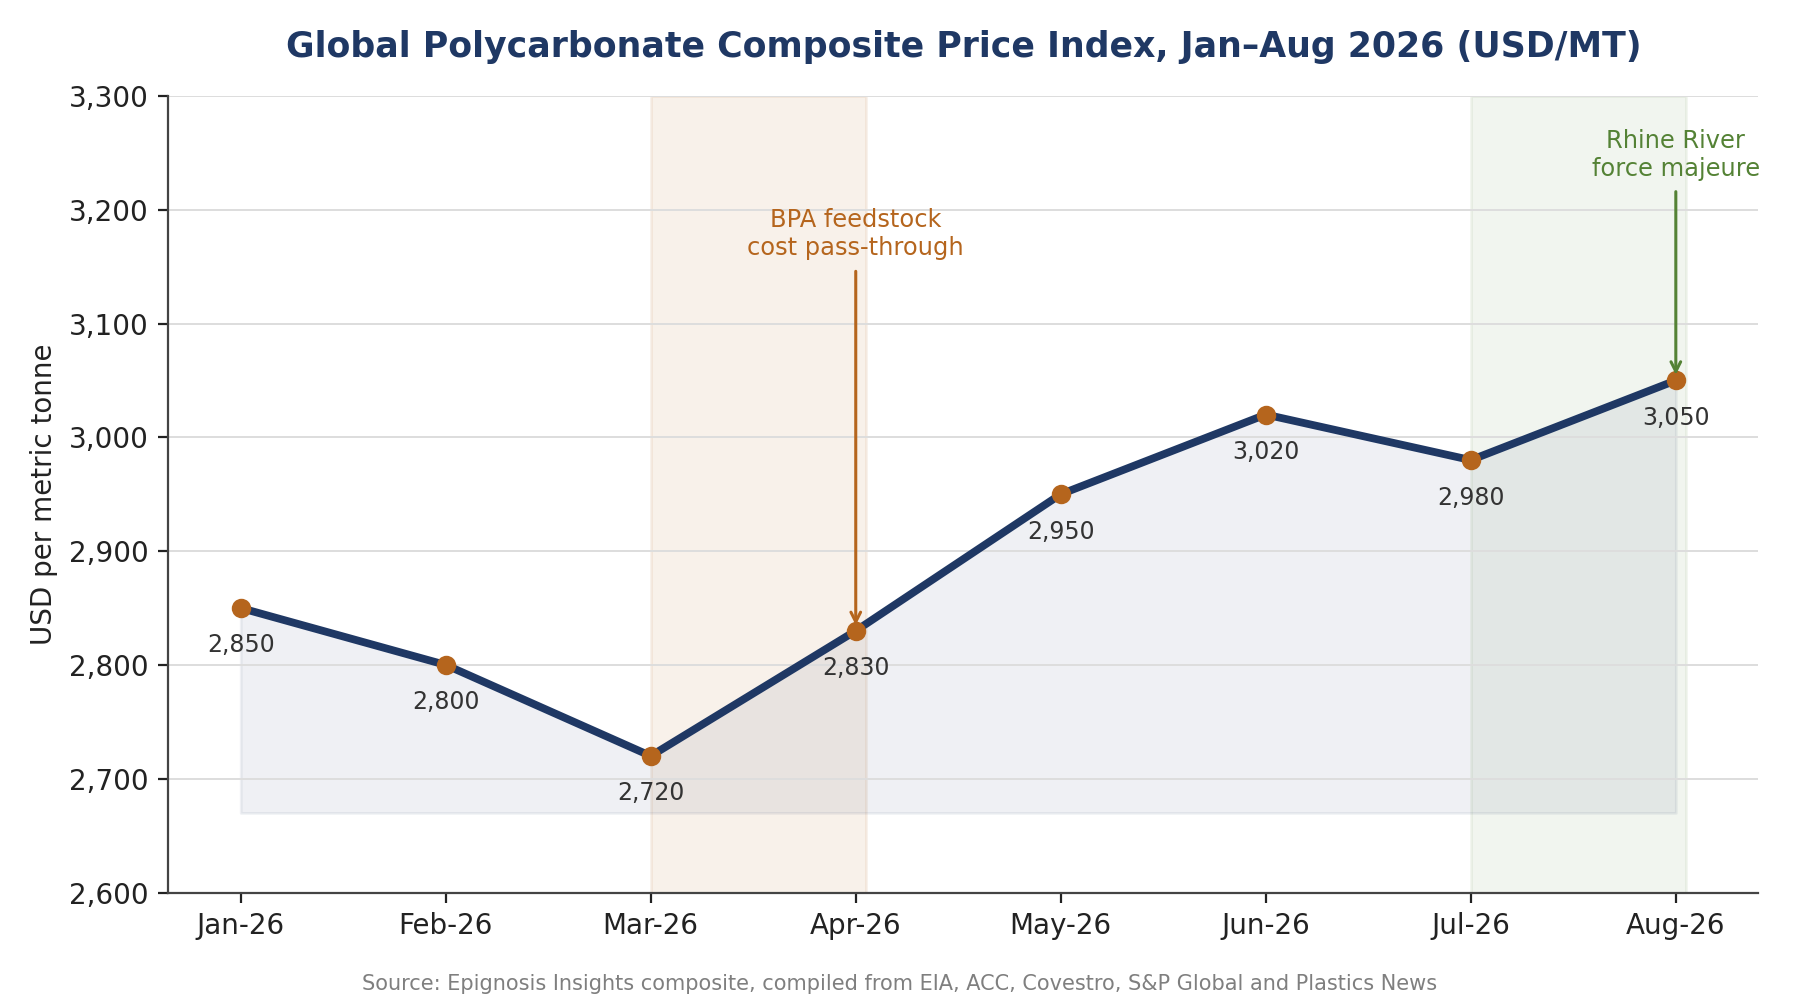
Figure 1. Global polycarbonate composite price index, January–August 2026 (USD/MT). Source: Epignosis Insights composite.
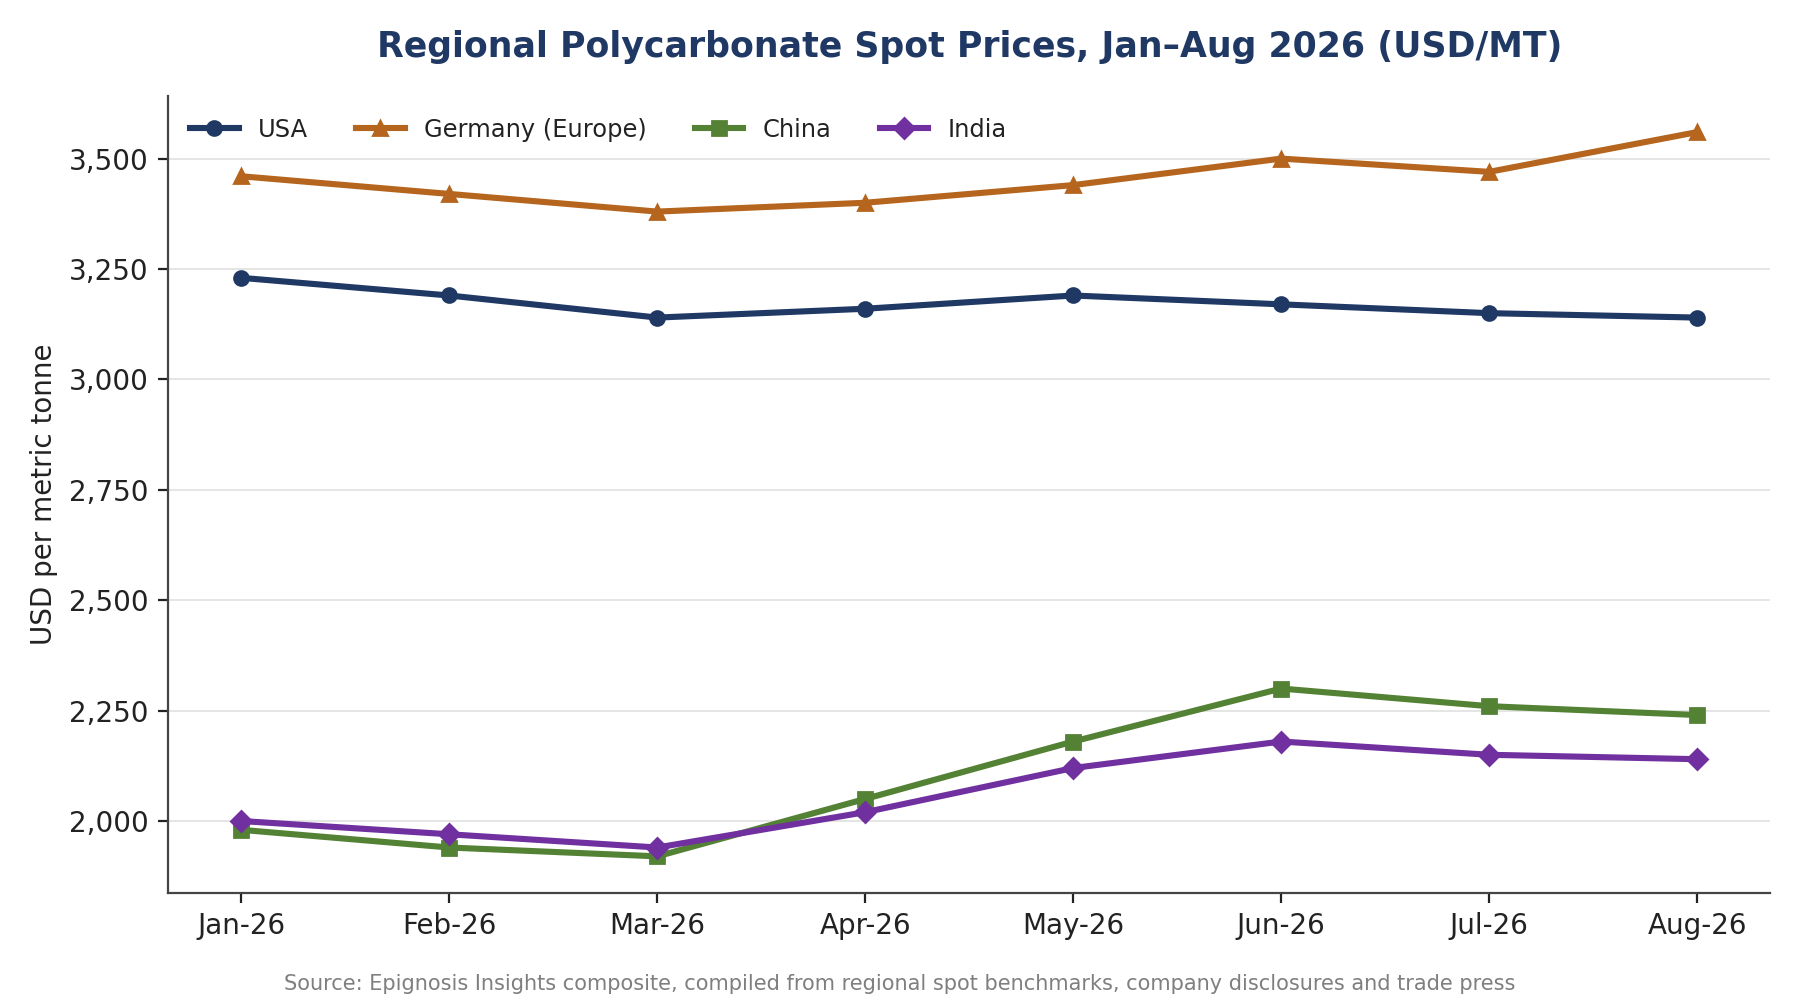
Figure 2. Regional polycarbonate spot price benchmarks — USA, China, Germany, India (USD/MT). Source: Epignosis Insights composite.
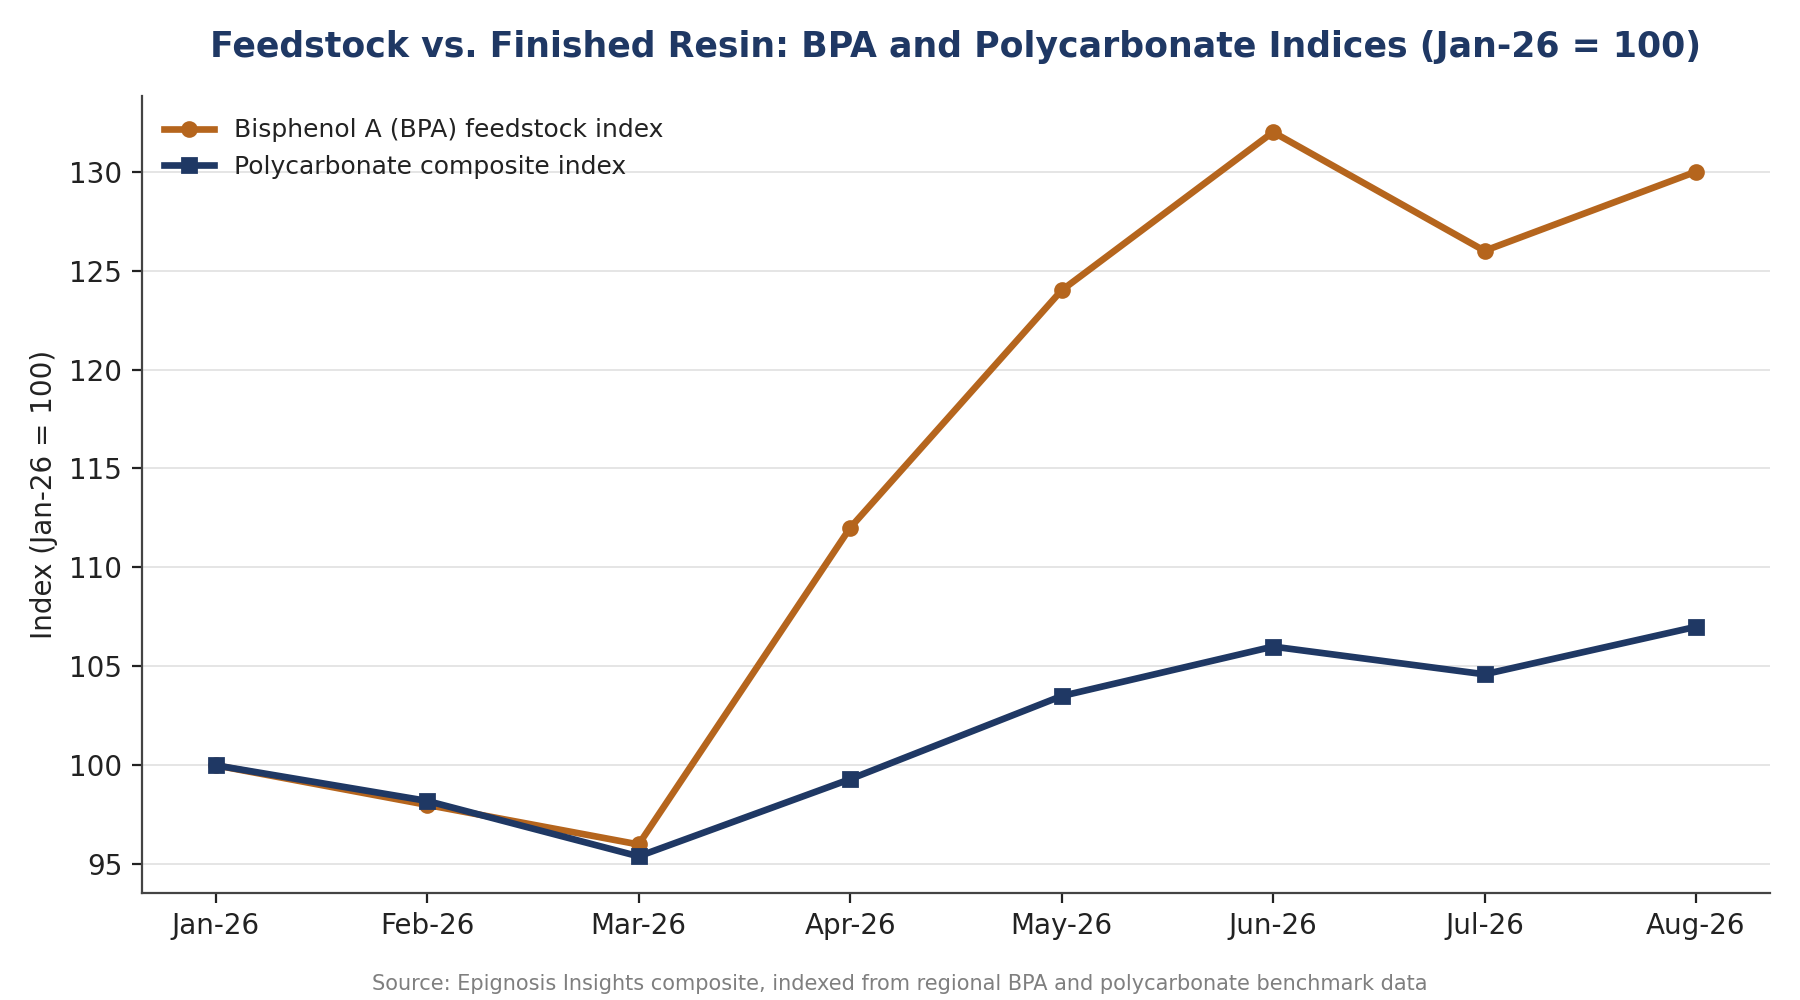
Figure 3. BisphenolA (BPA) feedstock index vs. polycarbonate composite index, Jan-26 = 100. Source: Epignosis Insights composite.
The table below summarizes the composite and regional benchmark figures charted above, presented in USD per metric tonne for each tracked month.
| USD/MT | Jan-26 | Feb-26 | Mar-26 | Apr-26 | May-26 | Jun-26 | Jul-26 | Aug-26 |
| Global Composite | 2,850 | 2,800 | 2,720 | 2,830 | 2,950 | 3,020 | 2,980 | 3,050 |
| USA | 3,230 | 3,190 | 3,140 | 3,160 | 3,190 | 3,170 | 3,150 | 3,140 |
| China | 1,980 | 1,940 | 1,920 | 2,050 | 2,180 | 2,300 | 2,260 | 2,240 |
| Germany | 3,460 | 3,420 | 3,380 | 3,400 | 3,440 | 3,500 | 3,470 | 3,560 |
| India | 2,000 | 1,970 | 1,940 | 2,020 | 2,120 | 2,180 | 2,150 | 2,140 |