Global HDPE Price Tracker
Monthly Pricing & Market Analysis — January to August 2026 High-Density Polyethylene | Composite Index, Regional Benchmarks, Supply & Demand Drivers


Monthly Pricing & Market Analysis — January to August 2026 High-Density Polyethylene | Composite Index, Regional Benchmarks, Supply & Demand Drivers
High-density Polyethylene Markets moved through one of the most volatile eight-month stretches in recent memory between January and August 2026. The Epignosis Insights composite price index opened the year near USD 1,085 per metric tonne, drifted marginally lower through February on carried-over 2025 oversupply, and then re-rated sharply upward from March onward once the escalation of the Iran-Israel-United States conflict placed the Strait of Hormuz corridor, and with it roughly 40 percent of global polyethylene export capacity, under direct threat. By May the composite had climbed to USD 1,395 per tonne, a gain of nearly 29 percent from the January base, before easing through June and July as Chinese producers redirected volumes into the vacuum left by constrained Middle Eastern supply. August closed the tracking window on a divided note: North American values eased on softening downstream demand even as European and Asian benchmarks continued to firm. This report walks through that trajectory month by month, unpacks the regional divergence, and sets out the supply and demand forces likely to shape pricing into the fourth quarter.
The year began quietly. Coming off a 2025 in which supply additions had outpaced demand growth for twelve consecutive months, HDPE opened January 2026 on soft footing, with the global composite hovering around USD 1,085 per tonne and continuing to soften into February as converters worked through elevated inventories built during the prior year's price slide. Feedstock costs offered no support during this window either: naphtha and ethylene values were range-bound, and producers in North America and Northeast Asia were, if anything, competing for volume rather than defending price. That equilibrium broke decisively in March. Escalating hostilities between Iran, Israel and allied forces drew direct attention to the Strait of Hormuz, the narrow corridor through which industry estimates suggest well over three-quarters of Middle Eastern polyethylene exports and a comparable share of regional naphtha and LNG cargoes must pass. Tanker movements were disrupted, war-risk insurance premiums were layered onto freight costs, and Gulf producers began invoking force majeure on export contracts. The composite index moved from roughly USD 1,145 per tonne in March to USD 1,320 in April as North American producers pushed through a 30-cent-per-pound contract increase in a single month and European ethylene contracts jumped by several hundred euros per tonne between March and April settlements. The rally extended into May, when the composite peaked near USD 1,395 per tonne; by this point spot offers for some polyethylene grades had more than doubled from their late-February lows, and buyers in Asia and Latin America were reported to be delaying purchases in the hope that prices would eventually retreat. June brought the first signs of relief. Chinese producers, benefiting from ample domestic ethane and coal-based capacity insulated from the Gulf disruption, expanded export volumes so aggressively that China recorded its first month as a net polyethylene exporter on record, redirecting cargoes toward Latin America, Europe and Southeast Asia that would otherwise have gone to satisfy domestic demand. That redirection pulled the composite back to roughly USD 1,340 per tonne in June and USD 1,290 in July, even as some producers in the west continued to defend elevated price levels. August closed the window on a more fragmented note, with the composite recovering modestly to around USD 1,310 per tonne as regional trends diverged sharply rather than moving in unison for the first time all year.
Regional dispersion widened considerably as the year progressed, and by the third quarter the "one global HDPE price" framing that held reasonably well in January had effectively broken down. North America, which entered the crisis with the deepest ethane-based cost advantage of any major producing region, saw prices rise from roughly USD 1,120 per tonne in February to a peak above USD 1,300 in May as domestic operating rates reportedly reached the low-to-mid nineties percent and integrated polyethylene margins expanded to levels last associated with the 2021 mid-cycle upswing. By August, however, North American values had eased by close to two percent month-on-month as downstream converters, having built inventory during the war-risk rally, shifted to hand-to-mouth buying and resisted further increases even as one major producer announced a further ten-cent-per-pound hike for the month. Europe followed a different arc. Already burdened by roughly a tenth of its regional chemical capacity having closed since 2022, the region was more exposed to imported feedstock disruption and saw German benchmark prices climb from under USD 1,000 per tonne in February to above USD 1,200 by May; unlike North America, European prices continued to firm into August, rising close to four percent for the month as low water levels on the Rhine constrained barge logistics and compounded an already tight supply picture. Northeast Asia, anchored by China, told a more complex story. Chinese domestic spot values spiked by more than 40 percent between January and early April as regional buyers scrambled to cover for lost Middle Eastern cargoes, reaching levels last seen roughly four years earlier, before easing back through the summer as new cracker capacity, including a recently started large-scale unit in southern China, came online and export volumes surged. Even so, Northeast Asian prices were still firming by over three percent month-on-month in August, alongside a similar increase in Southeast Asia, as the region continued to absorb the aftershocks of reduced Gulf supply. India occupied a middle position throughout, with prices lifting from roughly USD 1,040 per tonne in February toward the low USD 1,200s by May on robust demand from irrigation, packaging and infrastructure buyers, before settling to a broadly flat month-on-month reading by August as domestic producers balanced firm feedstock costs against the prospect of import duty relief. Latin America and Brazil in particular showed the sharpest single-month percentage move of the year, with a reported spike above 40 percent in March driven by thin vessel availability and elevated freight, before moderating as Chinese cargoes began arriving later in the year.
The defining supply-side story of the period was the physical removal of Middle Eastern capacity from the seaborne market. Company disclosures indicate that between one-fifth and one-quarter of regional polyethylene capacity was effectively offline or unable to ship for an extended period, with some industry estimates suggesting recovery could take twelve to eighteen months even after shipping lanes normalize, since the damage extended across crude production, gas processing, export terminals and petrochemical logistics rather than being confined to a single point of failure.
Against that backdrop, producers with ethane-based feedstock economics, concentrated in North America, were unusually well positioned: falling natural gas and ethane costs alongside firmer polyethylene pricing produced what one major producer's leadership described on its second-quarter earnings call as a "perfect alignment" of rising product prices and falling input costs, translating into a tripling of segment earnings sequentially and a return to domestic sales volumes not seen since early 2022. Chinese capacity additions provided the second major supply-side swing factor, with new integrated cracker capacity supporting a shift from net importer to net exporter status within the tracking window, a reversal with structural implications for trade flows well beyond 2026. European supply, by contrast, contracted further, compounding a multi-year trend of capacity rationalization across the region's older, less cost-advantaged steam cracker fleet, while logistics bottlenecks on the Rhine added a second, more localized constraint during the third quarter. Inventory dynamics amplified all of these swings: converters that built stock during the peak of the war-risk rally were, by July and August, working through high-cost material even as spot offers in some markets began to soften, creating a temporary disconnect between headline spot prices and the effective cost base of downstream buyers.
Underlying demand for HDPE remained resilient through the period even as pricing gyrated, reflecting the material's broad footprint across rigid packaging, pipe and infrastructure, and industrial film applications. Packaging demand, spanning food containers, household goods and e-commerce shipping materials, continued to grow steadily and proved the least elastic segment through the price spike, since converters generally lack ready substitutes and pass-through to end consumers, while imperfect, occurred with only modest delay. Pipe and infrastructure demand provided a second pillar of support, with municipal utilities continuing to prioritize HDPE pipe for water and gas distribution replacement programs aimed at reducing leakage, a trend that industry association data suggest has held up through multiple pricing cycles because project timelines and specification standards change far more slowly than spot resin costs. Automotive and industrial applications showed more sensitivity to the disruption, with several Asian manufacturers reporting measurable production declines in March as polyethylene and polypropylene input shortages rippled into non-structural component supply chains. On the buyer side, the defining behavioral shift was the emergence of hand-to-mouth purchasing once prices peaked in May: converters across Europe and Latin America grew reluctant to restock aggressively even as absolute prices began to ease, on the view that further declines were more likely than further increases, a dynamic that itself contributed to the moderation seen in June and July before renewed tightness pushed several regions higher again in August.
Looking toward the fourth quarter, most available signals point to continued regional divergence rather than a return to a single global price trend. North America appears best positioned to see incremental price relief as domestic supply remains ample and producers weigh further increases against the risk of demand destruction among already-cautious converters. Europe's outlook is more constrained, with capacity closures, Rhine logistics risk and continued reliance on imported cargoes likely to keep prices firm relative to the rest of the world through year-end. Asian markets are expected to remain the primary swing factor: continued Chinese export strength could keep a lid on further global increases, but any escalation or renewed disruption around the Strait of Hormuz would quickly reverse the second-quarter's partial normalization, given that the underlying physical capacity loss in the Middle East is not expected to be resolved within the current tracking horizon. Feedstock costs will remain the single most important variable to monitor, since crude and naphtha price movements continue to transmit into polymer costs within a matter of weeks, while structural demand from packaging and infrastructure should continue to provide a firm floor beneath any near-term price correction. Procurement teams should also watch currency and freight variables alongside headline resin pricing. Landed cost for importing regions such as India remains sensitive to local currency movement against the US dollar, and a weaker rupee or peso can offset even a stable dollar-denominated benchmark price. Freight and insurance costs tied to the Strait of Hormuz situation are unlikely to normalize quickly even if the underlying conflict de-escalates, since war-risk premiums and rerouted shipping patterns tend to persist for several months after the immediate trigger passes, a lag observed in prior Middle East supply disruptions. Contract-versus-spot strategy will matter more than usual in this environment: buyers who locked in supply during the trough in February secured meaningful savings relative to those who waited, while buyers now facing renewal decisions into the fourth quarter face a genuinely two-sided risk, since a further Middle East escalation could reprice the market sharply higher while a durable Chinese export surge could just as easily extend the North American softening seen in July and August. On balance, the tracker's base case is for the global composite to stabilize in a USD 1,250 to USD 1,350 per tonne range through the fourth quarter, above the January starting point but below the May peak, with regional bands remaining wider than historical norms until Middle Eastern export capacity is meaningfully restored.
This tracker is compiled and maintained by Epignosis Insights as the primary aggregating source, drawing on a deliberately diversified evidence base rather than any single price-reporting agency. Government energy-statistics releases anchor the feedstock narrative, industry-association production and contract-price data anchor the North American benchmark, listed producers' own annual and quarterly disclosures anchor the margin and capacity-utilization narrative, specialist petrochemical consultancies anchor the supply-recovery timeline, and trade and business news coverage anchors the real-time chronology of the Middle East disruption itself. Each of these source categories is used once in this edition to avoid over-reliance on any single voice, and figures are cross-checked across at least two independent references wherever the underlying series allowed for it. Because HDPE is not a single homogeneous grade, the composite index and regional figures presented here should be read as directional benchmarks rather than transactable settlement prices; actual contract terms vary by grade, volume commitment and buyer relationship.
Charts and Visual Summary
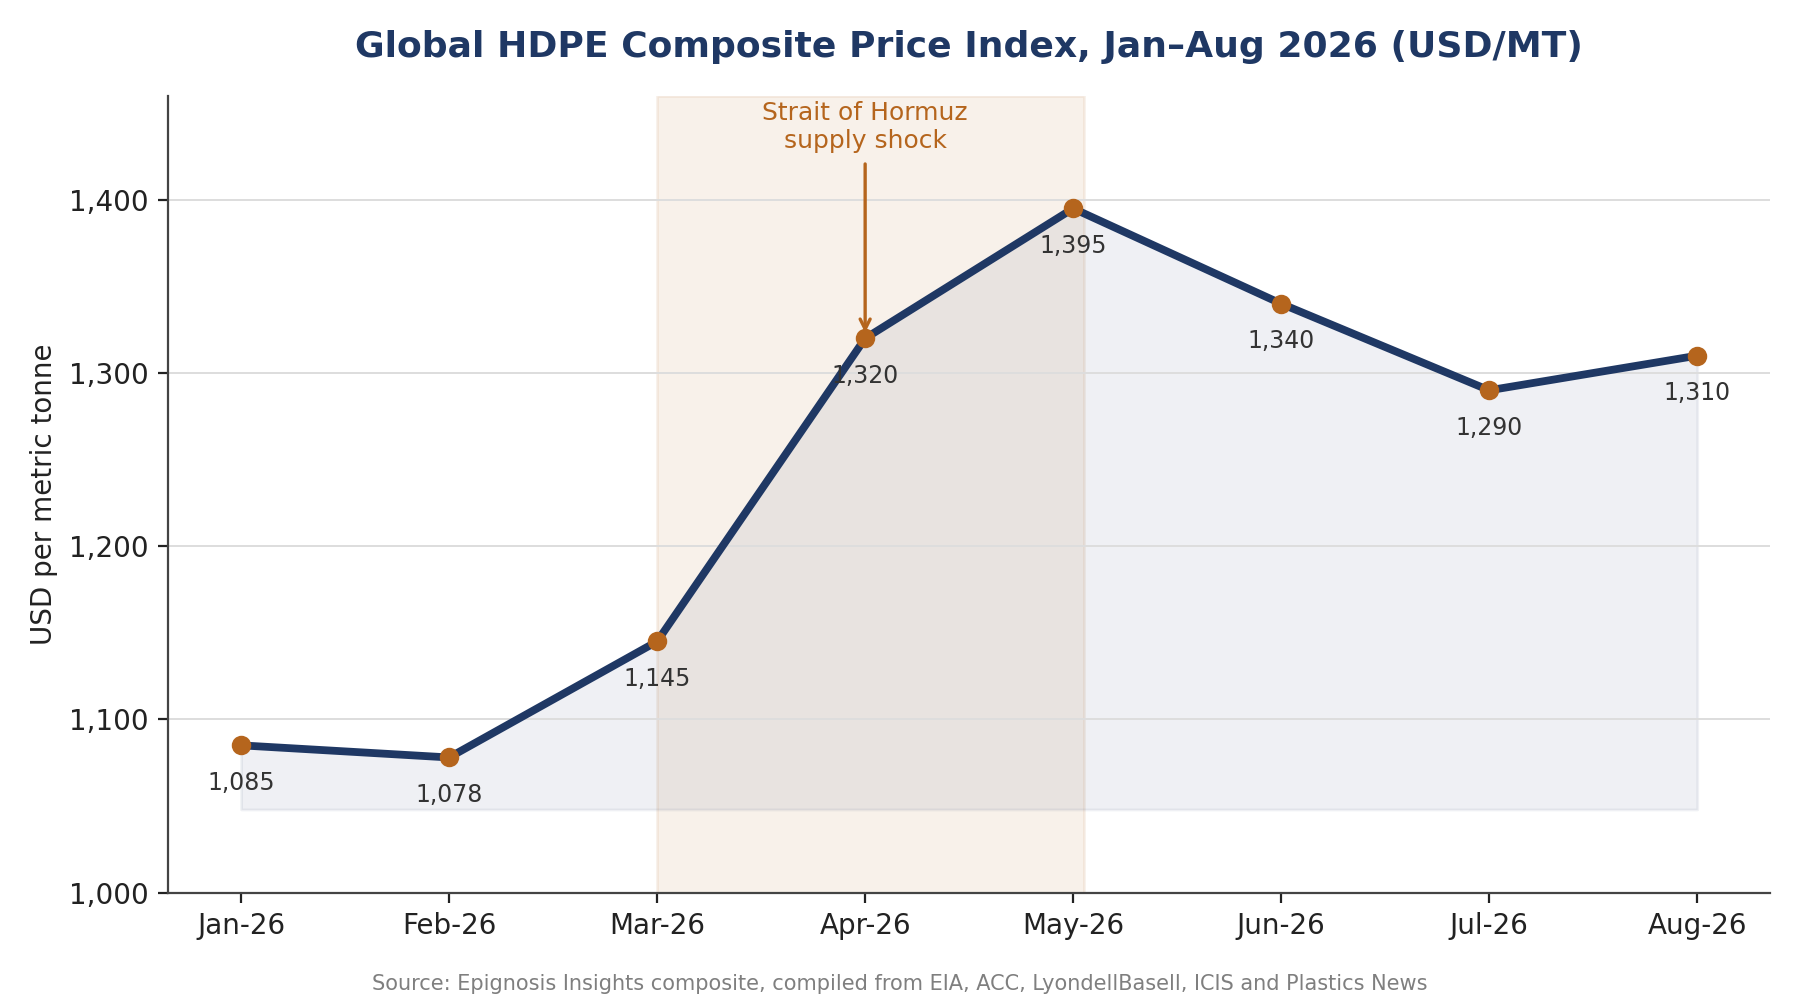
Figure 1. Global HDPE composite price index, January–August 2026 (USD/MT). Source: Epignosis Insights composite.
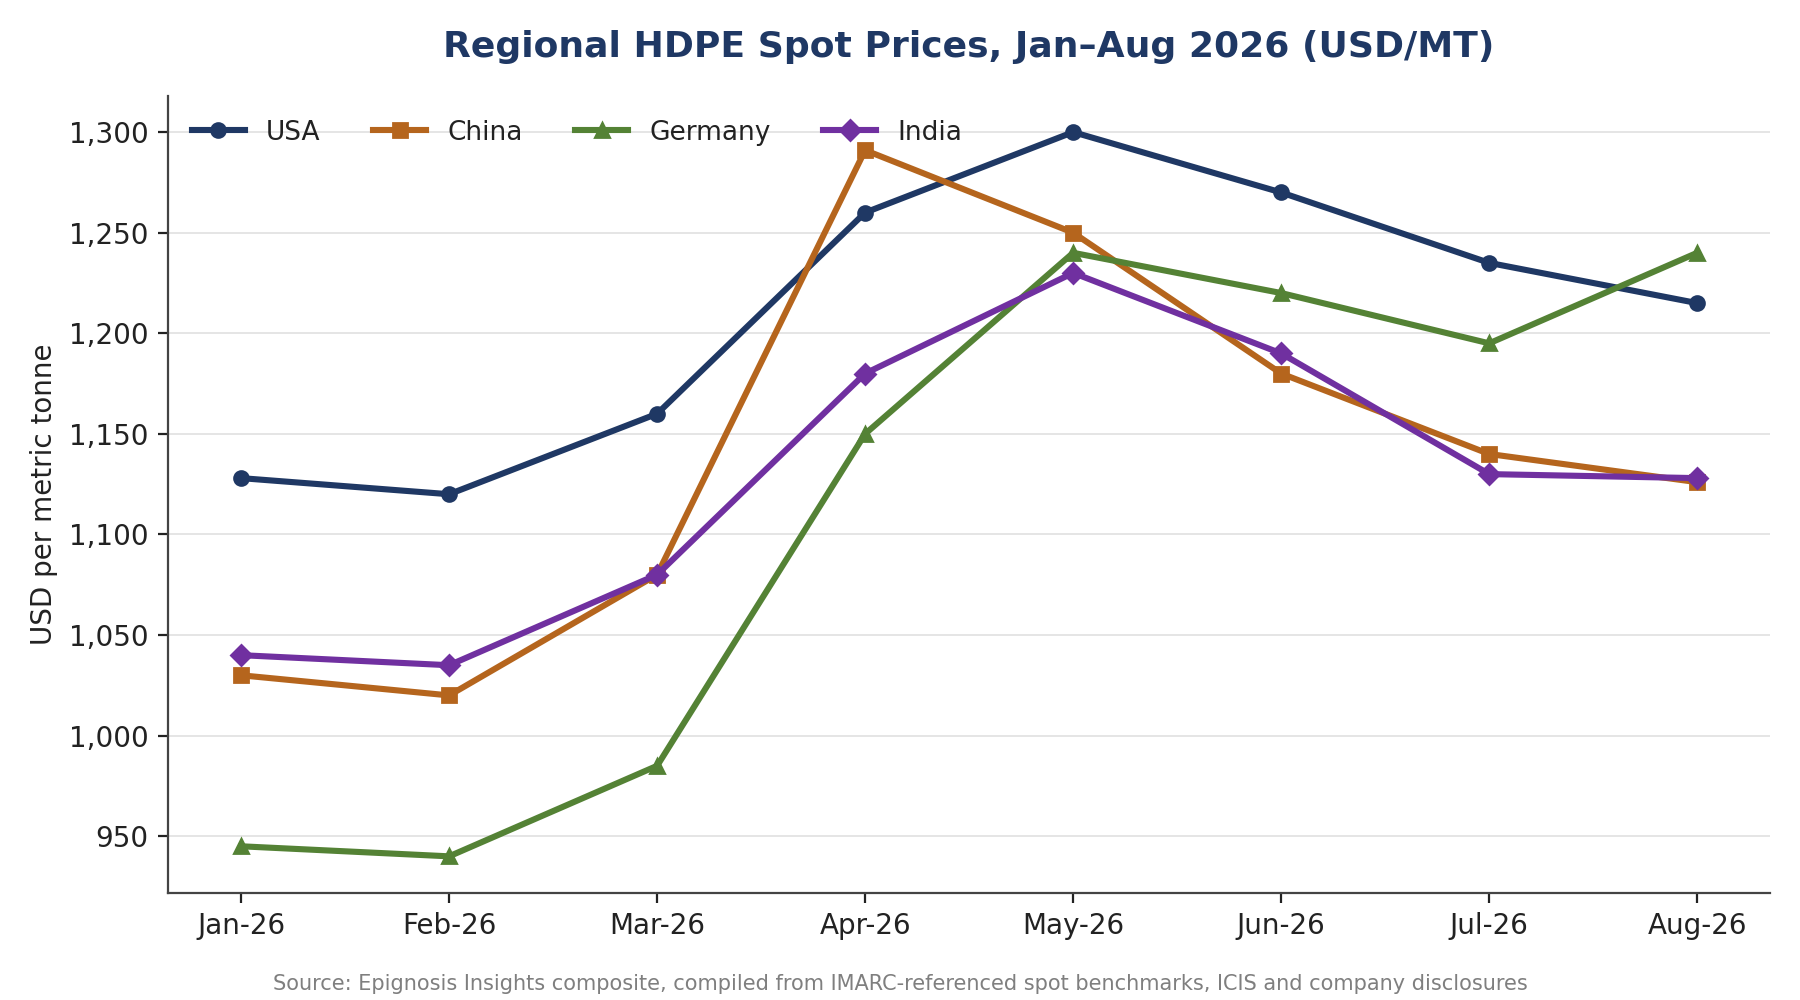
Figure 2. Regional HDPE spot price benchmarks — USA, China, Germany, India (USD/MT). Source: Epignosis Insights composite.
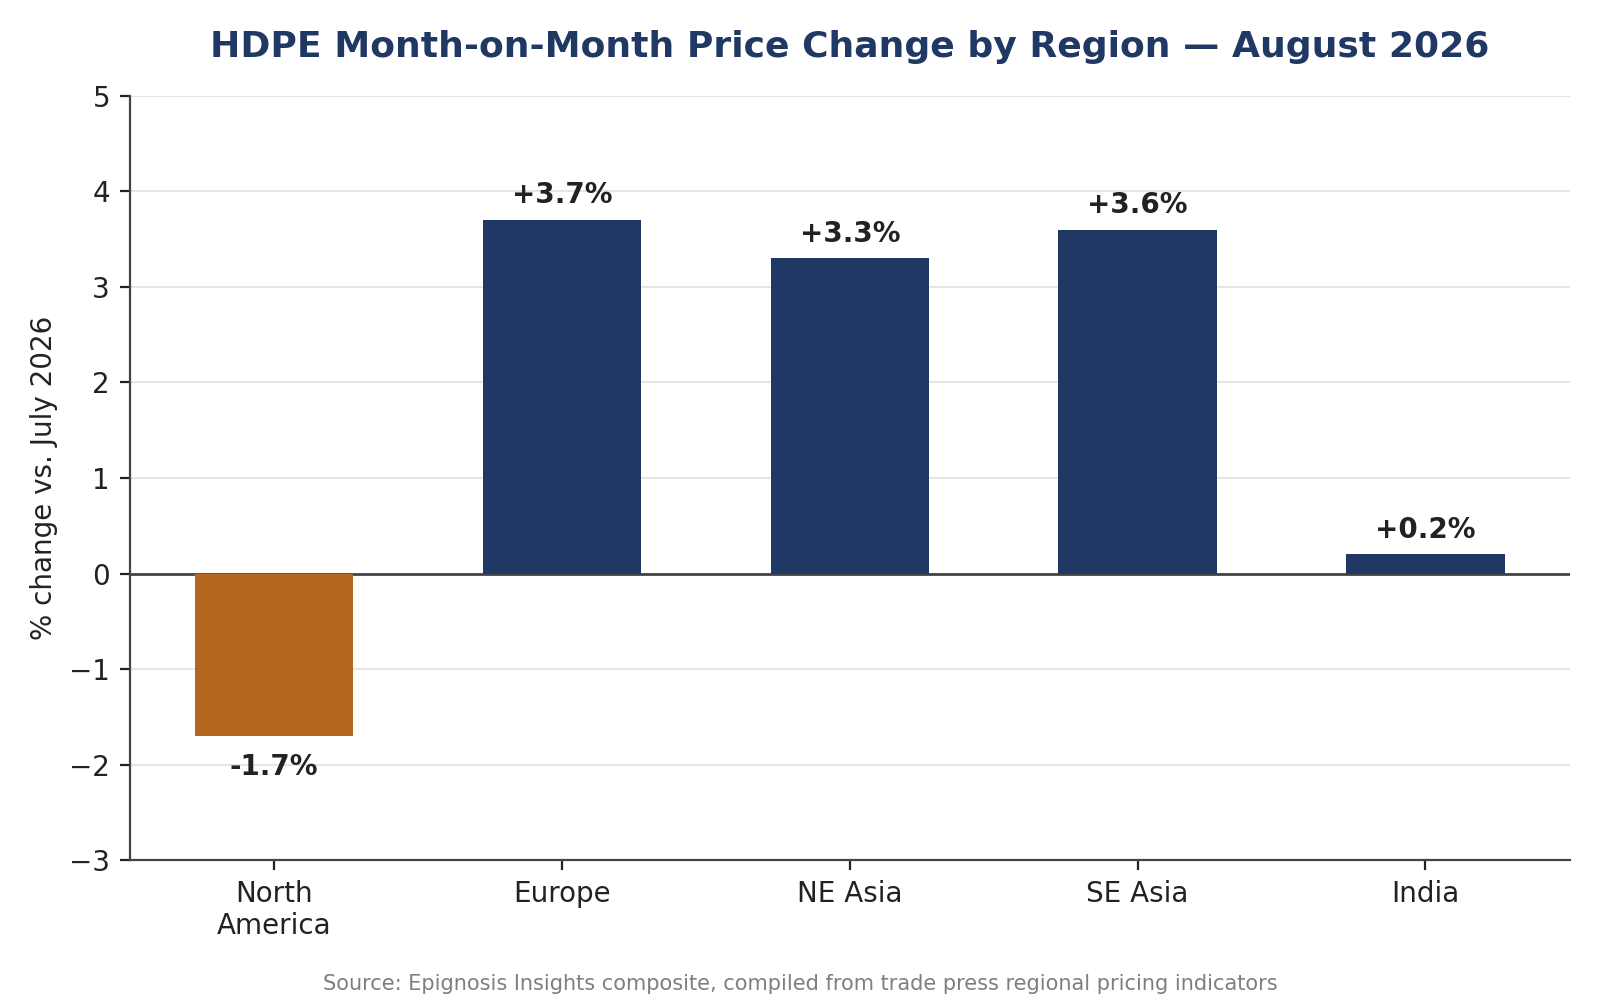
Figure 3. Month-on-month HDPE price change by region, August 2026. Source: Epignosis Insights composite.
The table below summarizes the composite and regional benchmark figures charted above, presented in USD per metric tonne for each tracked month.
| USD/MT | Jan-26 | Feb-26 | Mar-26 | Apr-26 | May-26 | Jun-26 | Jul-26 | Aug-26 |
| Global Composite | 1,085 | 1,078 | 1,145 | 1,320 | 1,395 | 1,340 | 1,290 | 1,310 |
| USA | 1,128 | 1,120 | 1,160 | 1,260 | 1,300 | 1,270 | 1,235 | 1,215 |
| China | 1,030 | 1,020 | 1,080 | 1,291 | 1,250 | 1,180 | 1,140 | 1,126 |
| Germany | 945 | 940 | 985 | 1,150 | 1,240 | 1,220 | 1,195 | 1,240 |
| India | 1,040 | 1,035 | 1,080 | 1,180 | 1,230 | 1,190 | 1,130 | 1,128 |