Europe Polyethylene (PE) Pricing Tracker
Feedstock, Grade-Level Spot & Contract Prices, and Virgin-vs-Recycled Dynamics — 2025/2026


Feedstock, Grade-Level Spot & Contract Prices, and Virgin-vs-Recycled Dynamics — 2025/2026
METHODOLOGY FRAMEWORK · EPIGNOSIS INSIGHTS
Every market estimate published by Epignosis Insights is triangulated from three independent streams secondary intelligence, primary fieldwork, and expert validation before it is released. This document sets out that framework end to end, phase by phase, with the tables, formulas, and diagrams that underpin it.
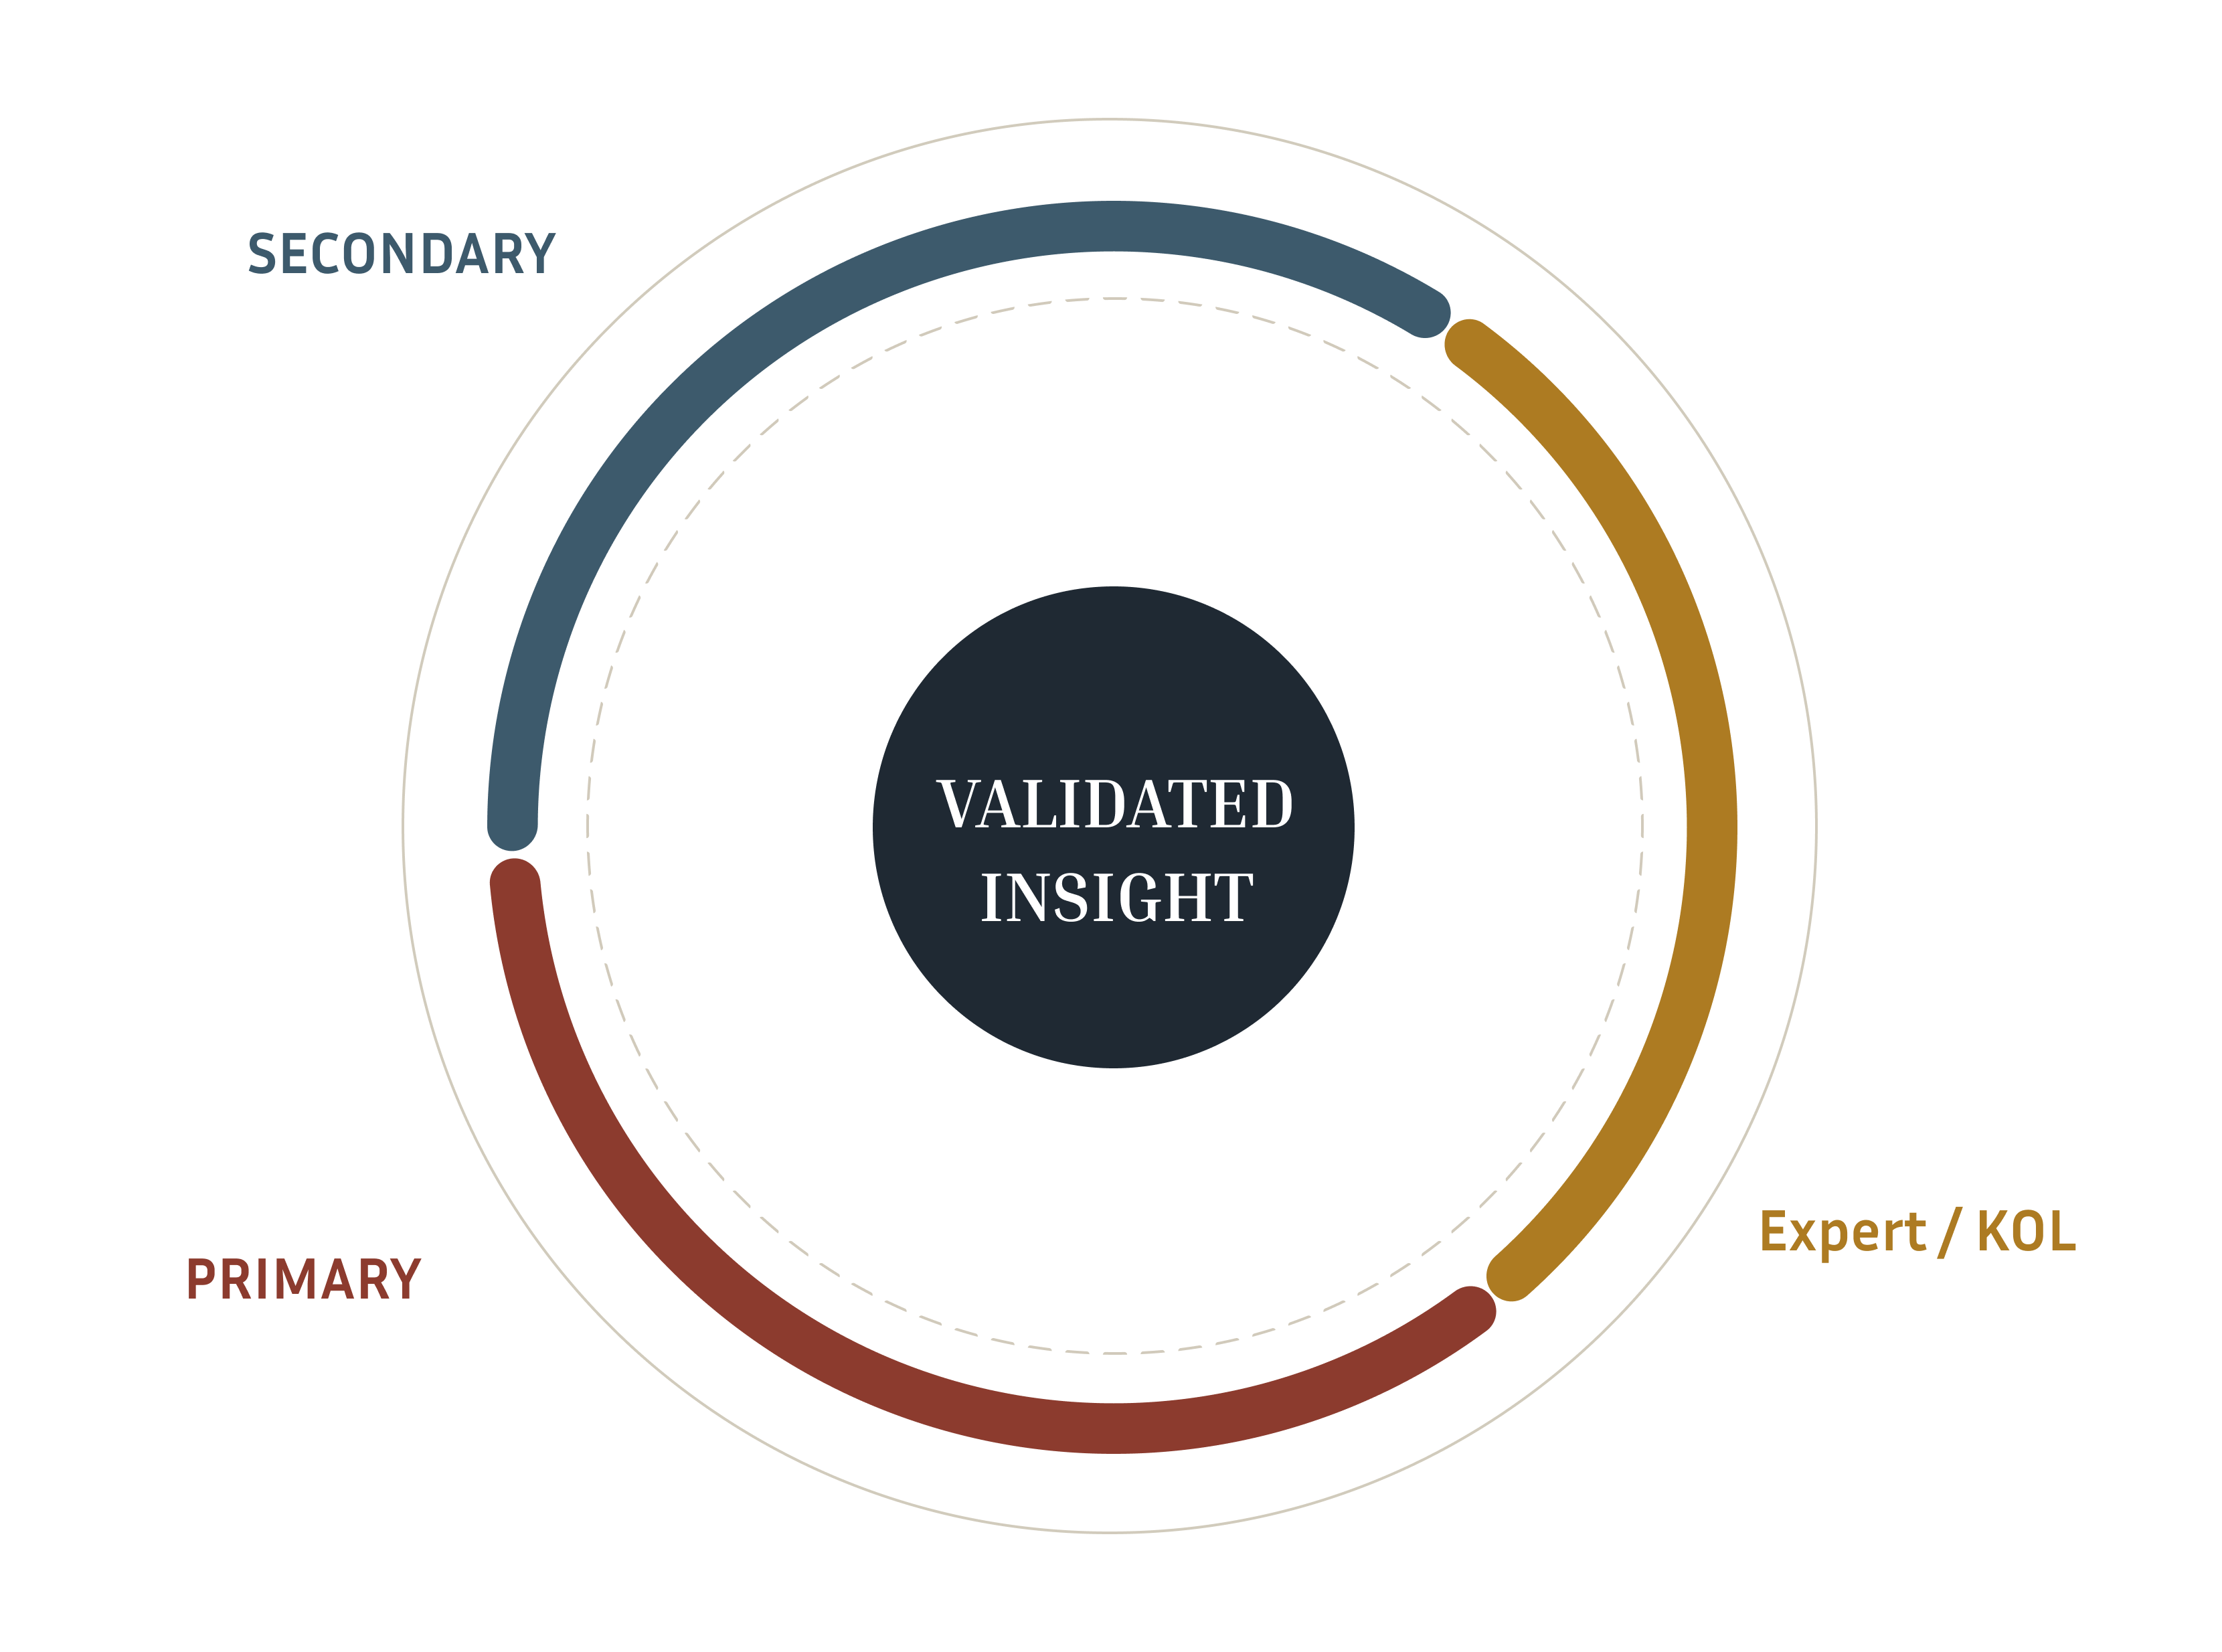
The design is chosen by what the question needs, not by default. Each engagement is classified into one of three research designs, often combined in sequence within a single study.
Used when the problem itself is loosely defined new category entry, whitespace mapping, early trend scanning.
• Expert / KOL interviews
• Literature & patent scan
• Focus groups, unstructured
Used to size, segment, and profile a defined market or audience with statistical confidence.
• Structured surveys (CATI/CAWI)
• Syndicated data mining
• Cross-sectional studies
Used to isolate cause-effect relationships pricing elasticity, campaign lift, product-attribute impact on choice.
• Conjoint / MaxDiff
• A/B and test-control designs
• Regression & driver analysis
Desk research establishes the scaffolding: market boundaries, historical trends, competitive structure, and regulatory context sourced in a strict tier hierarchy.
| TIER | SOURCE TYPE | EXAMPLES | PRIMARY USE |
| Tier 1 | Official data | National statistical offices, central banks, customs/trade data, regulatory filings (SEC, MCA), annual reports & investor decks |
Base numbers, historicals, official definitions |
| Tier 1 | Paid databases | Bloomberg, Factiva, S&P Capital IQ, Bureau van Dijk (Orbis), customs data platforms | Company financials, deal activity, trade flows |
| Tier 2 | Industry & trade bodies | Trade associations, chambers of commerce, standards bodies, industry consortia reports | Category definitions, adoption benchmarks |
| Tier 2 | Prior syndicated research | Existing paid reports, patent databases, peer-reviewed journals | Cross-check, technology & IP landscape |
| Tier 3 | Open web & press | Company press releases, trade press, credible news, conference proceedings | Directional signals, triggers, timeline events |
Tier 3 sources are never used as a standalone basis for a market number they are corroborating signals only, cross-checked against Tier 1/2.
Structured instruments run at statistically defensible sample sizes to produce measurable, projectable results.
• CATI / CAWI structured surveys
• Online panels (proprietary & third-party)
• Conjoint, MaxDiff, Van Westendorp pricing
• Retail audits & point-of-sale tracking
Unstructured or semi-structured engagement to surface the "why" behind quant patterns.
• In-depth interviews (IDIs) with decision-makers
• Focus group discussions (FGDs)
• Expert / KOL consultations
• Ethnography & shop-alongs
| METHOD | TYPE | TYPICAL N | BEST FIT | FIELD TIME |
| Structured survey (CAWI) | Quant | 200–1,000+ | Segmentation, market sizing inputs, tracking | 2–4 weeks |
| CATI / telephonic | Quant | 150–500 | B2B / low-incidence audiences | 3–5 weeks |
| In-depth interview | Qual | 15–30 | Decision-maker journeys, B2B procurement | 3–6 weeks |
| Focus group discussion | Qual | 6–8/group, 4–6 groups | Concept & message testing | 2–3 weeks |
| Expert / KOL interview | Qual | 8–20 | Emerging categories, technical validation | 2–4 weeks |
| Conjoint / MaxDiff | Quant | 250–600 | Feature trade-off, pricing | 3–5 weeks |
Sample design follows a probability approach wherever a sampling frame exists (customer lists, registries, panels); stratified or quota sampling is used when the population is heterogeneous across known segments; snowball/purposive sampling is reserved for hard-to-reach expert populations.
n = (Z² × p × (1-p)) / e² finite population correction: n′ = n / (1 + (n-1)/N)
Z = confidence coefficient · p = expected proportion (0.5 if unknown) · e = margin of error · N = population size
| CONFIDENCE LEVEL | Z-SCORE | MARGIN OF ERROR | REQUIRED N (LARGE POPULATION) |
| 90% | 1.645 | ±5% | ~271 |
| 95% | 1.960 | ±5% | ~385 |
| 95% | 1.960 | ±3% | ~1,067 |
| 99% | 2.576 | ±5% | ~666 |
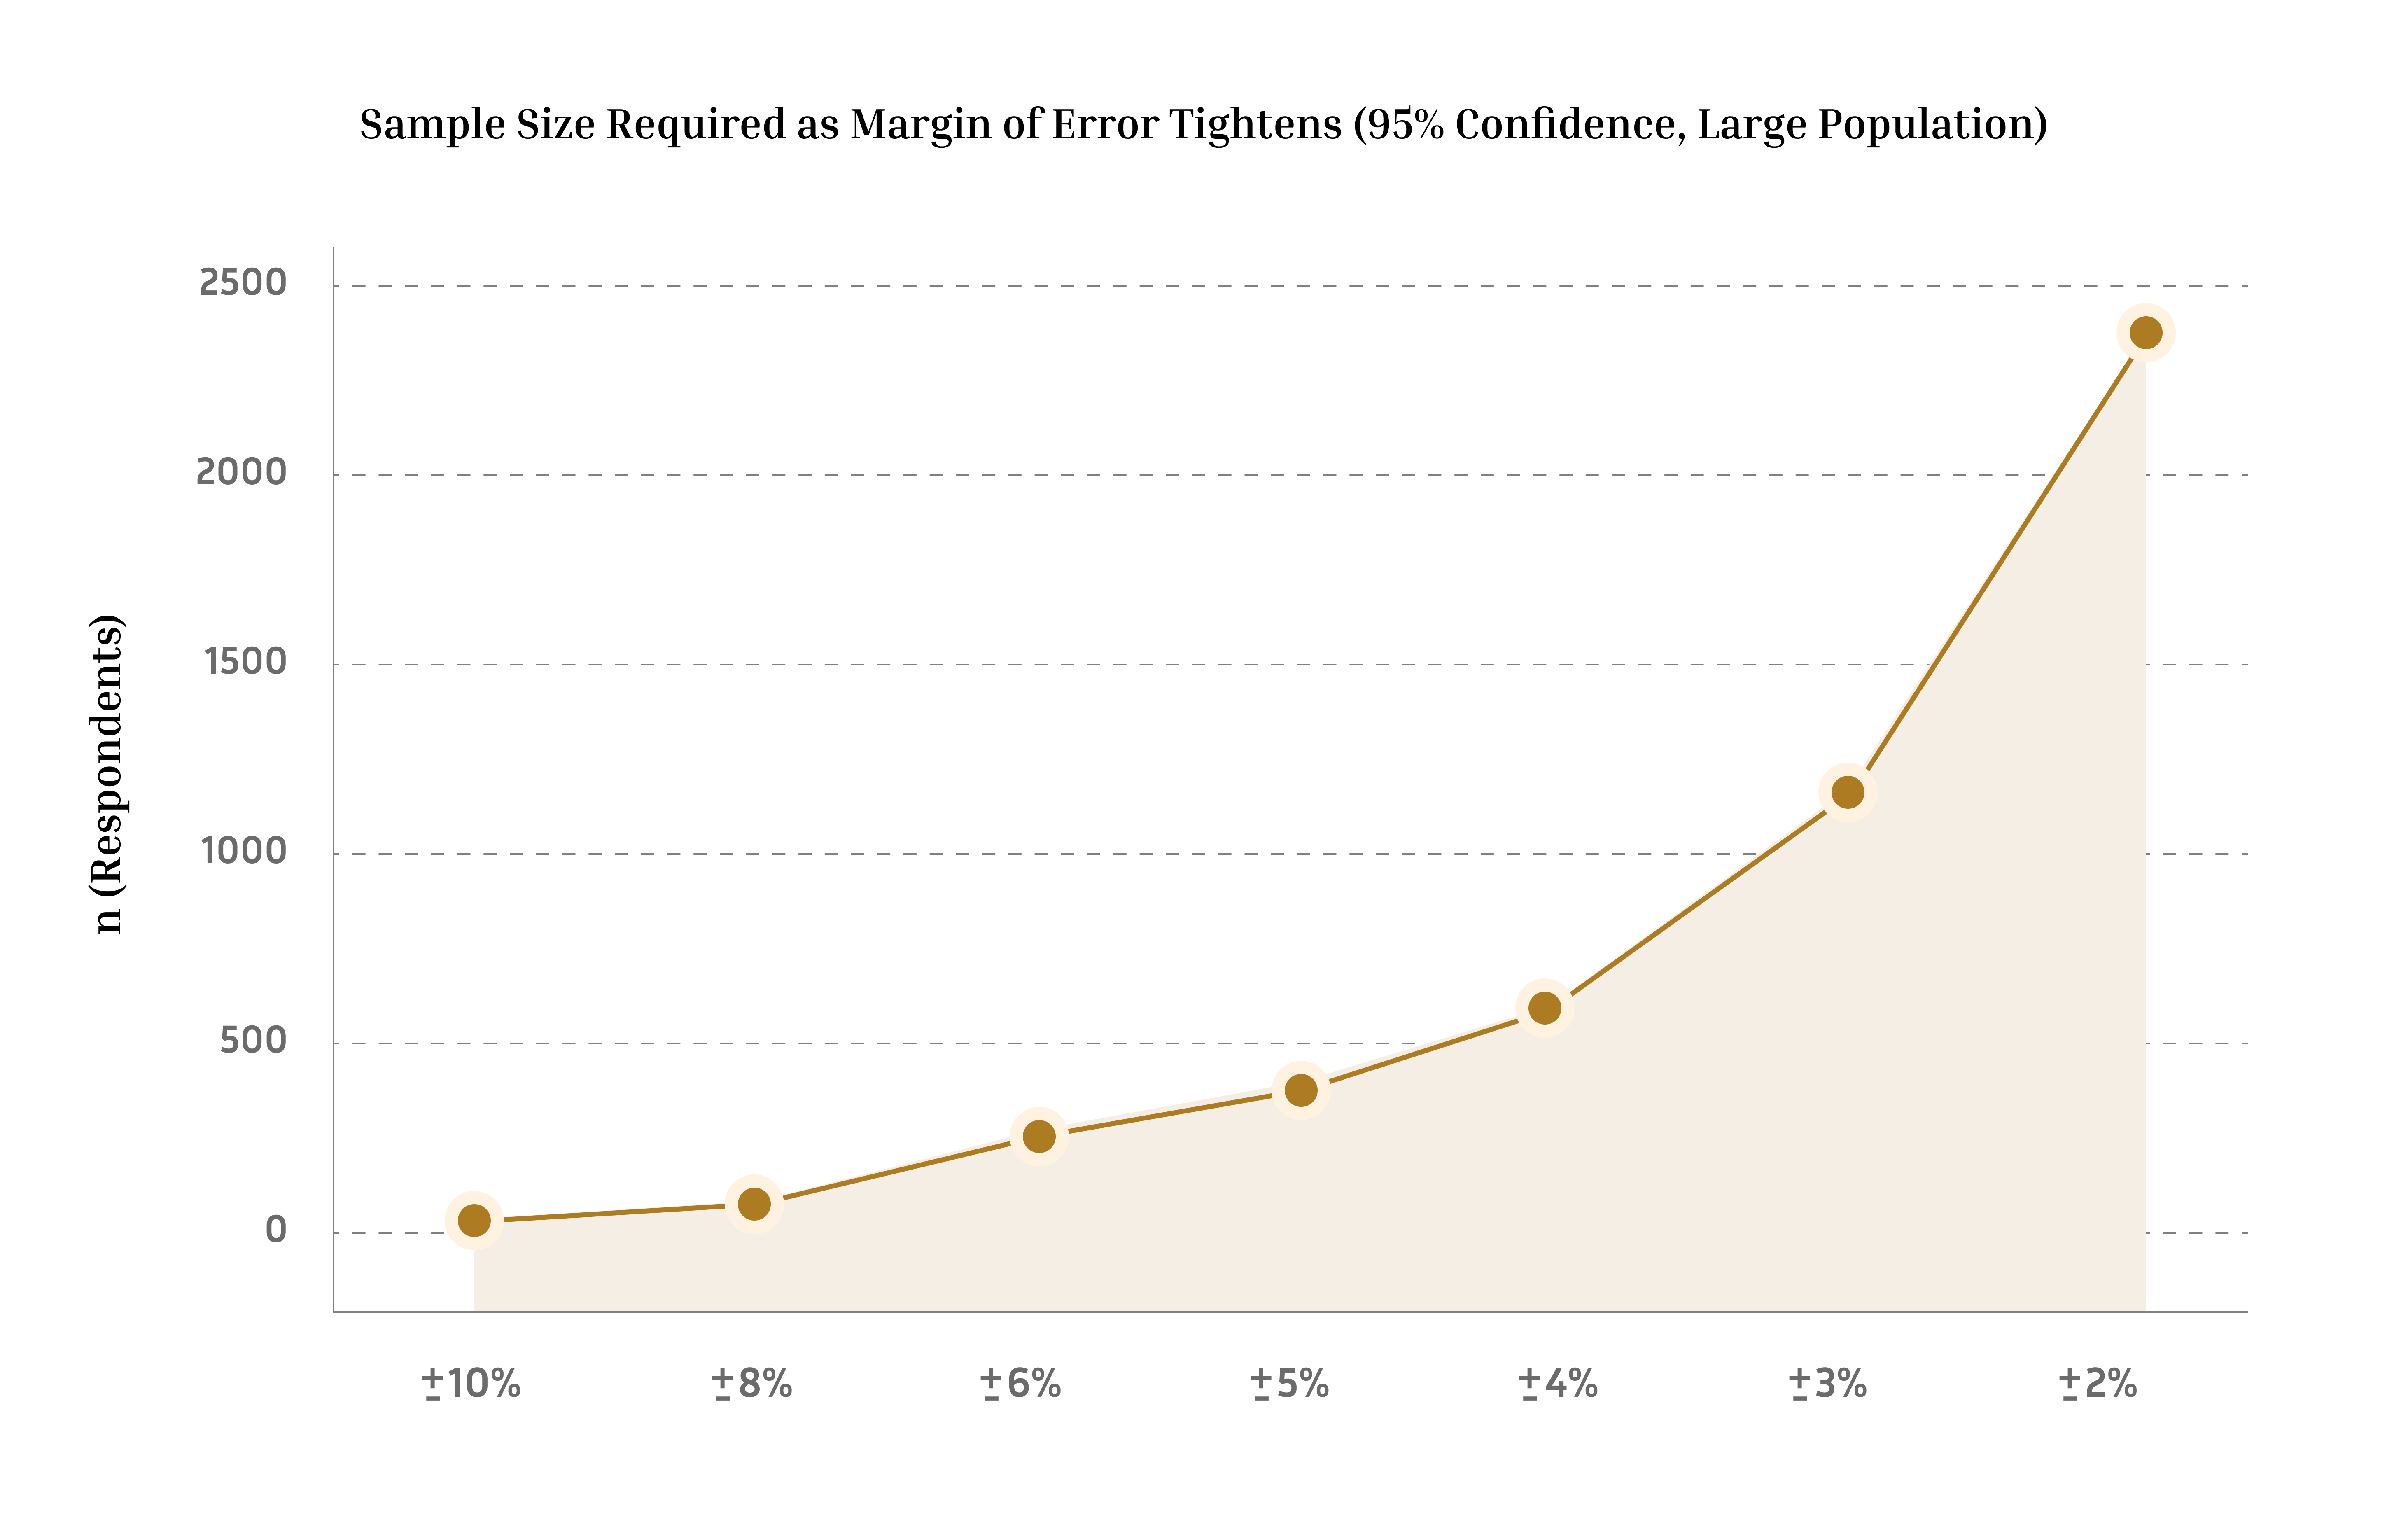
Figure 2 Required sample size grows sharply as margin of error tightens (95% confidence).
Every market number is built two ways independently, then reconciled a discrepancy beyond ±8–10% triggers a fresh review of assumptions before publication.
Start from a macro total (industry/GDP-linked base) and apply successive filters relevant sub-segment share, geography, applicable use-cases to isolate the addressable market.
Build from the smallest unit up unit sales × average price, or per-company revenue aggregated across all identified players then gross up for coverage gaps.
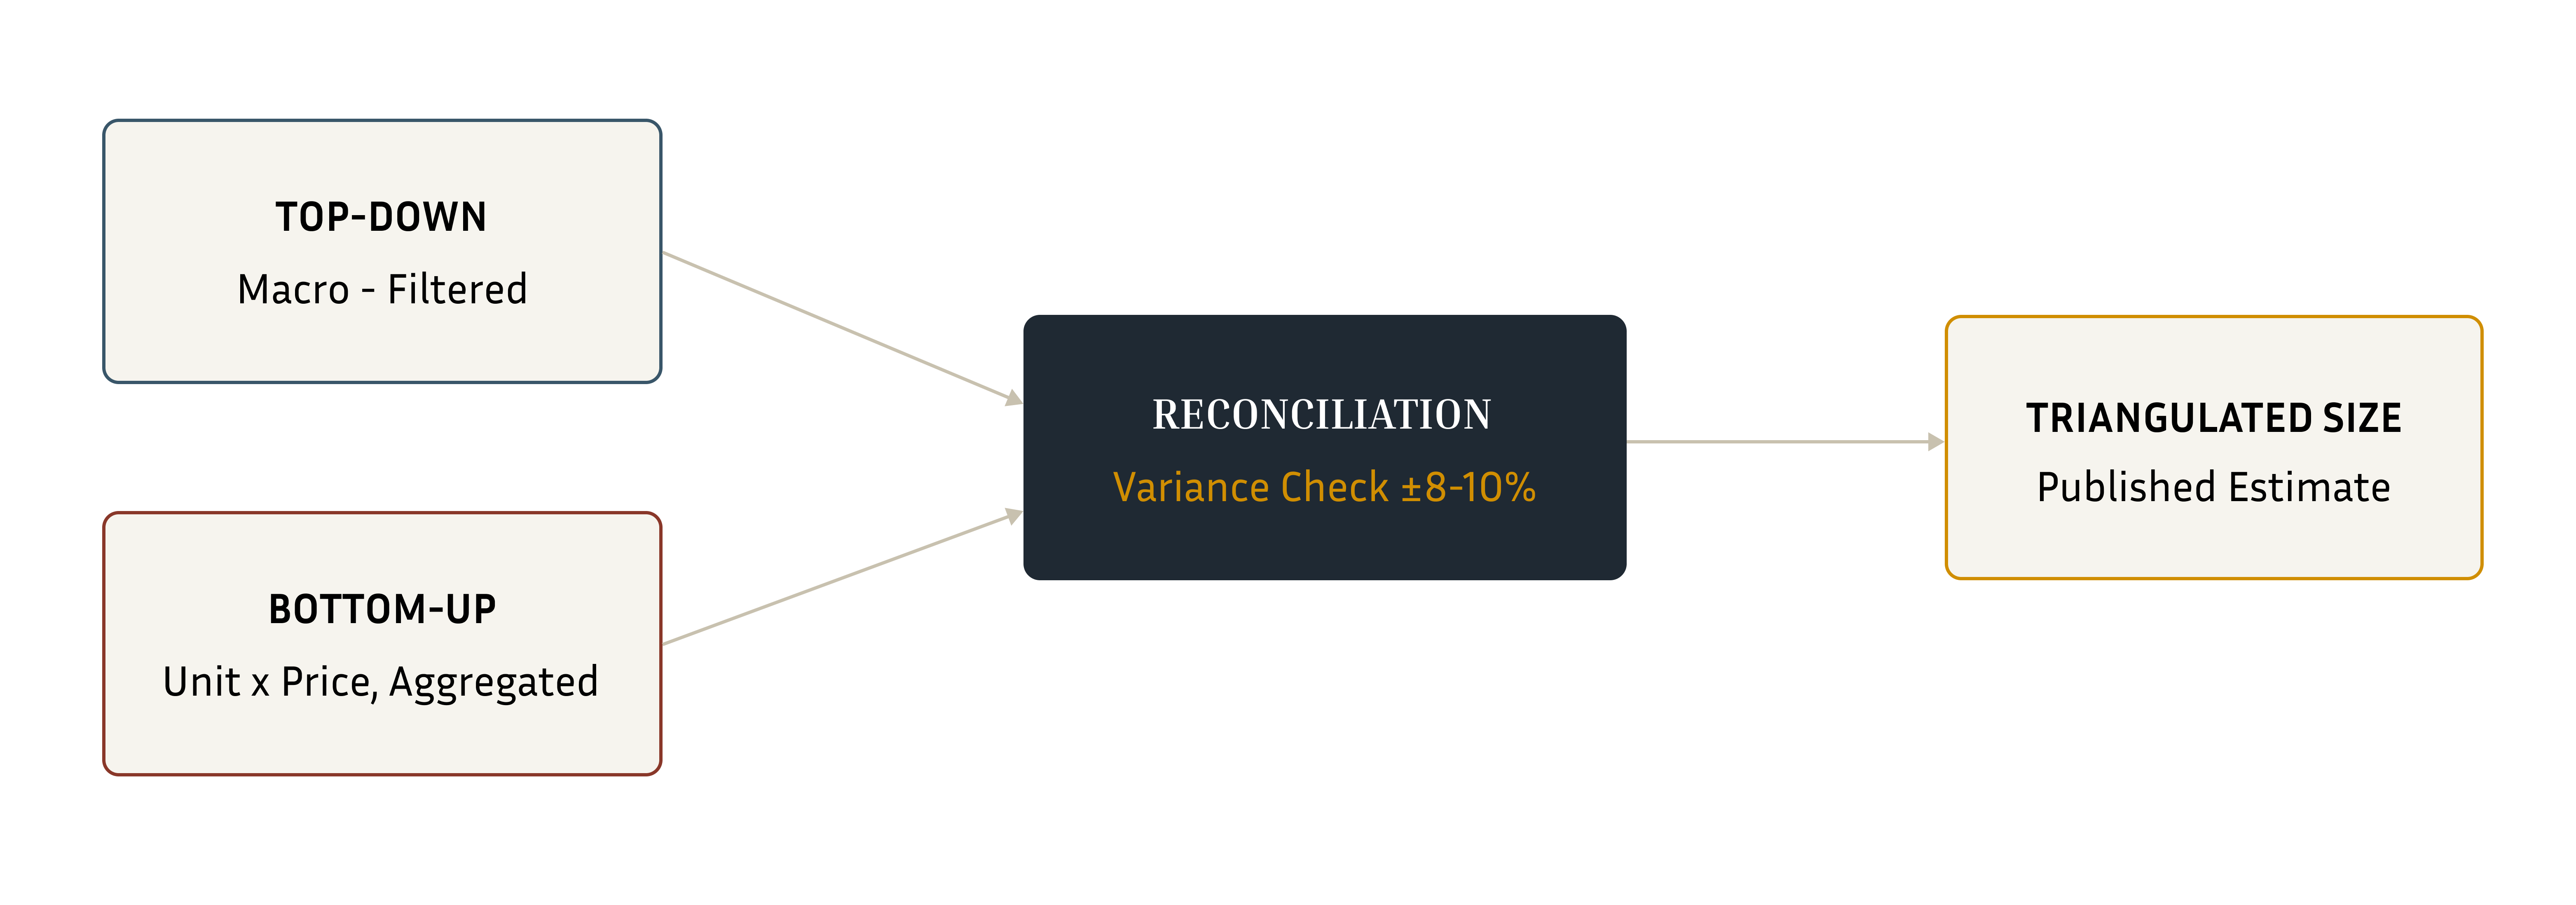
Figure 3 Top-down and bottom-up estimates are reconciled before a triangulated size is published.
Every Tier 1 figure is matched against at least one independent source before use.
Expert sanity check
Draft estimates are reviewed with 2–3 industry experts for directional plausibility.
A second analyst not on the project re-derives the sizing logic independently.
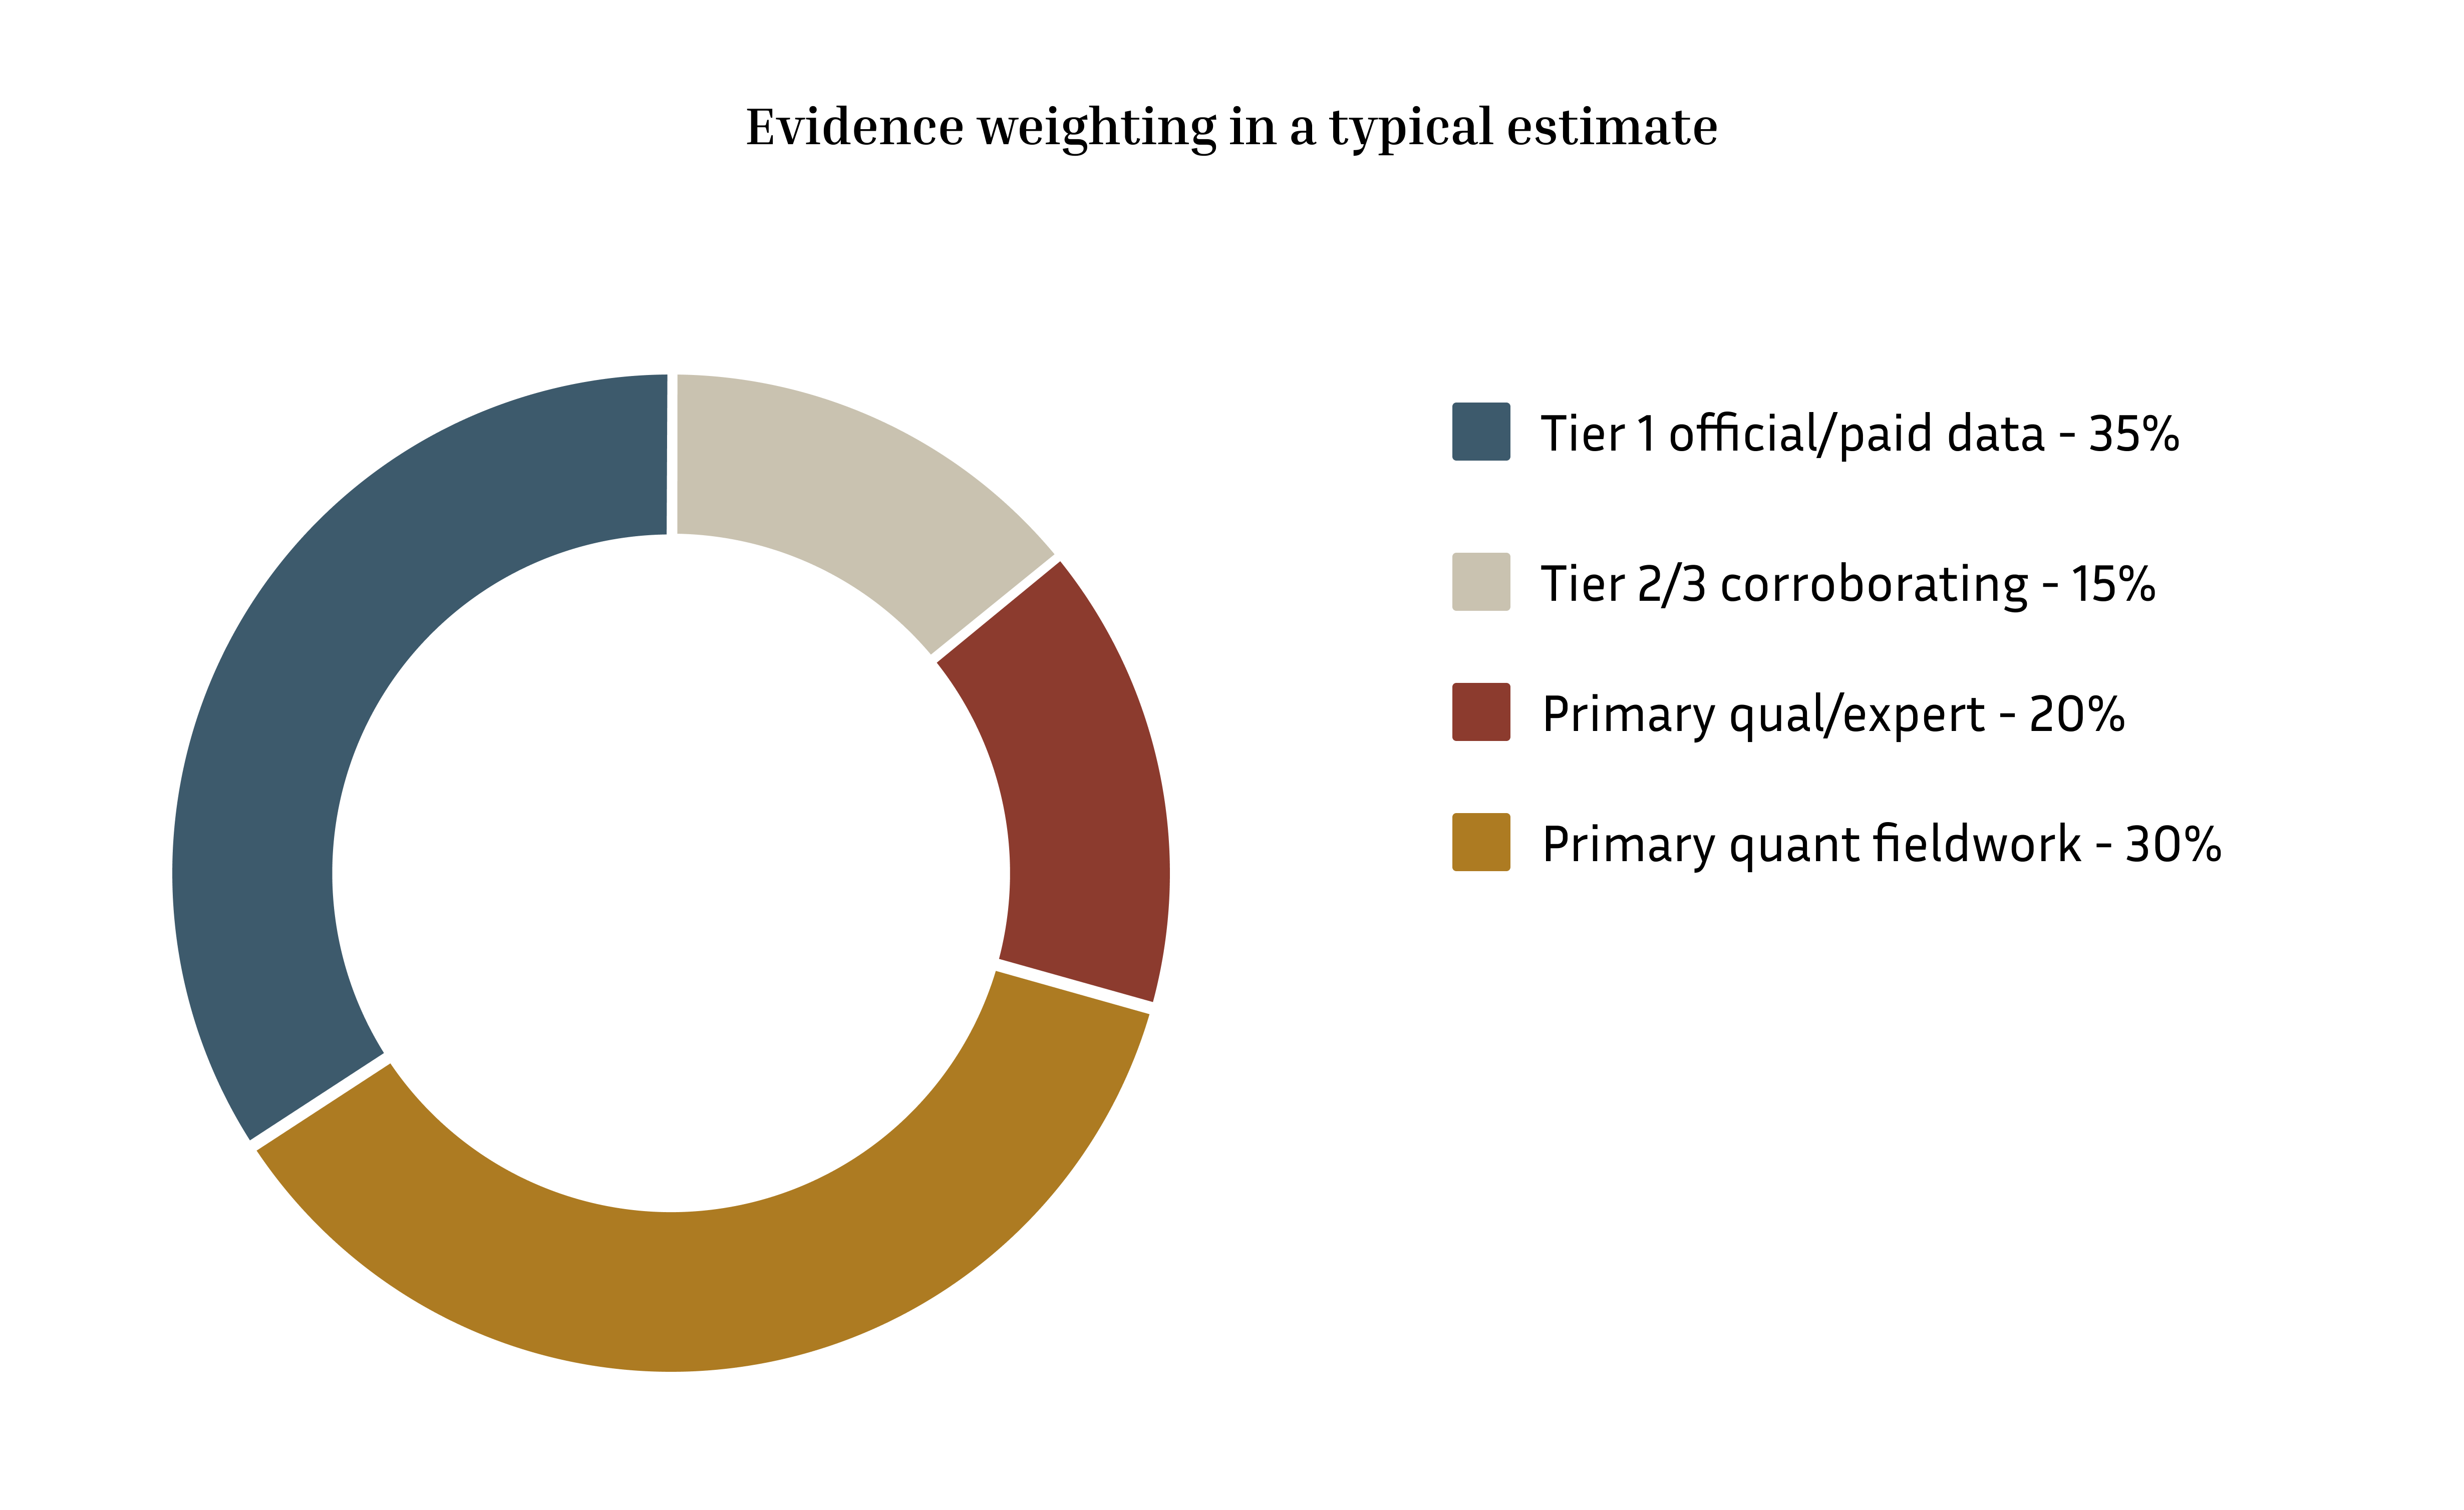
Figure 4 Evidence weighting in a typical estimate.
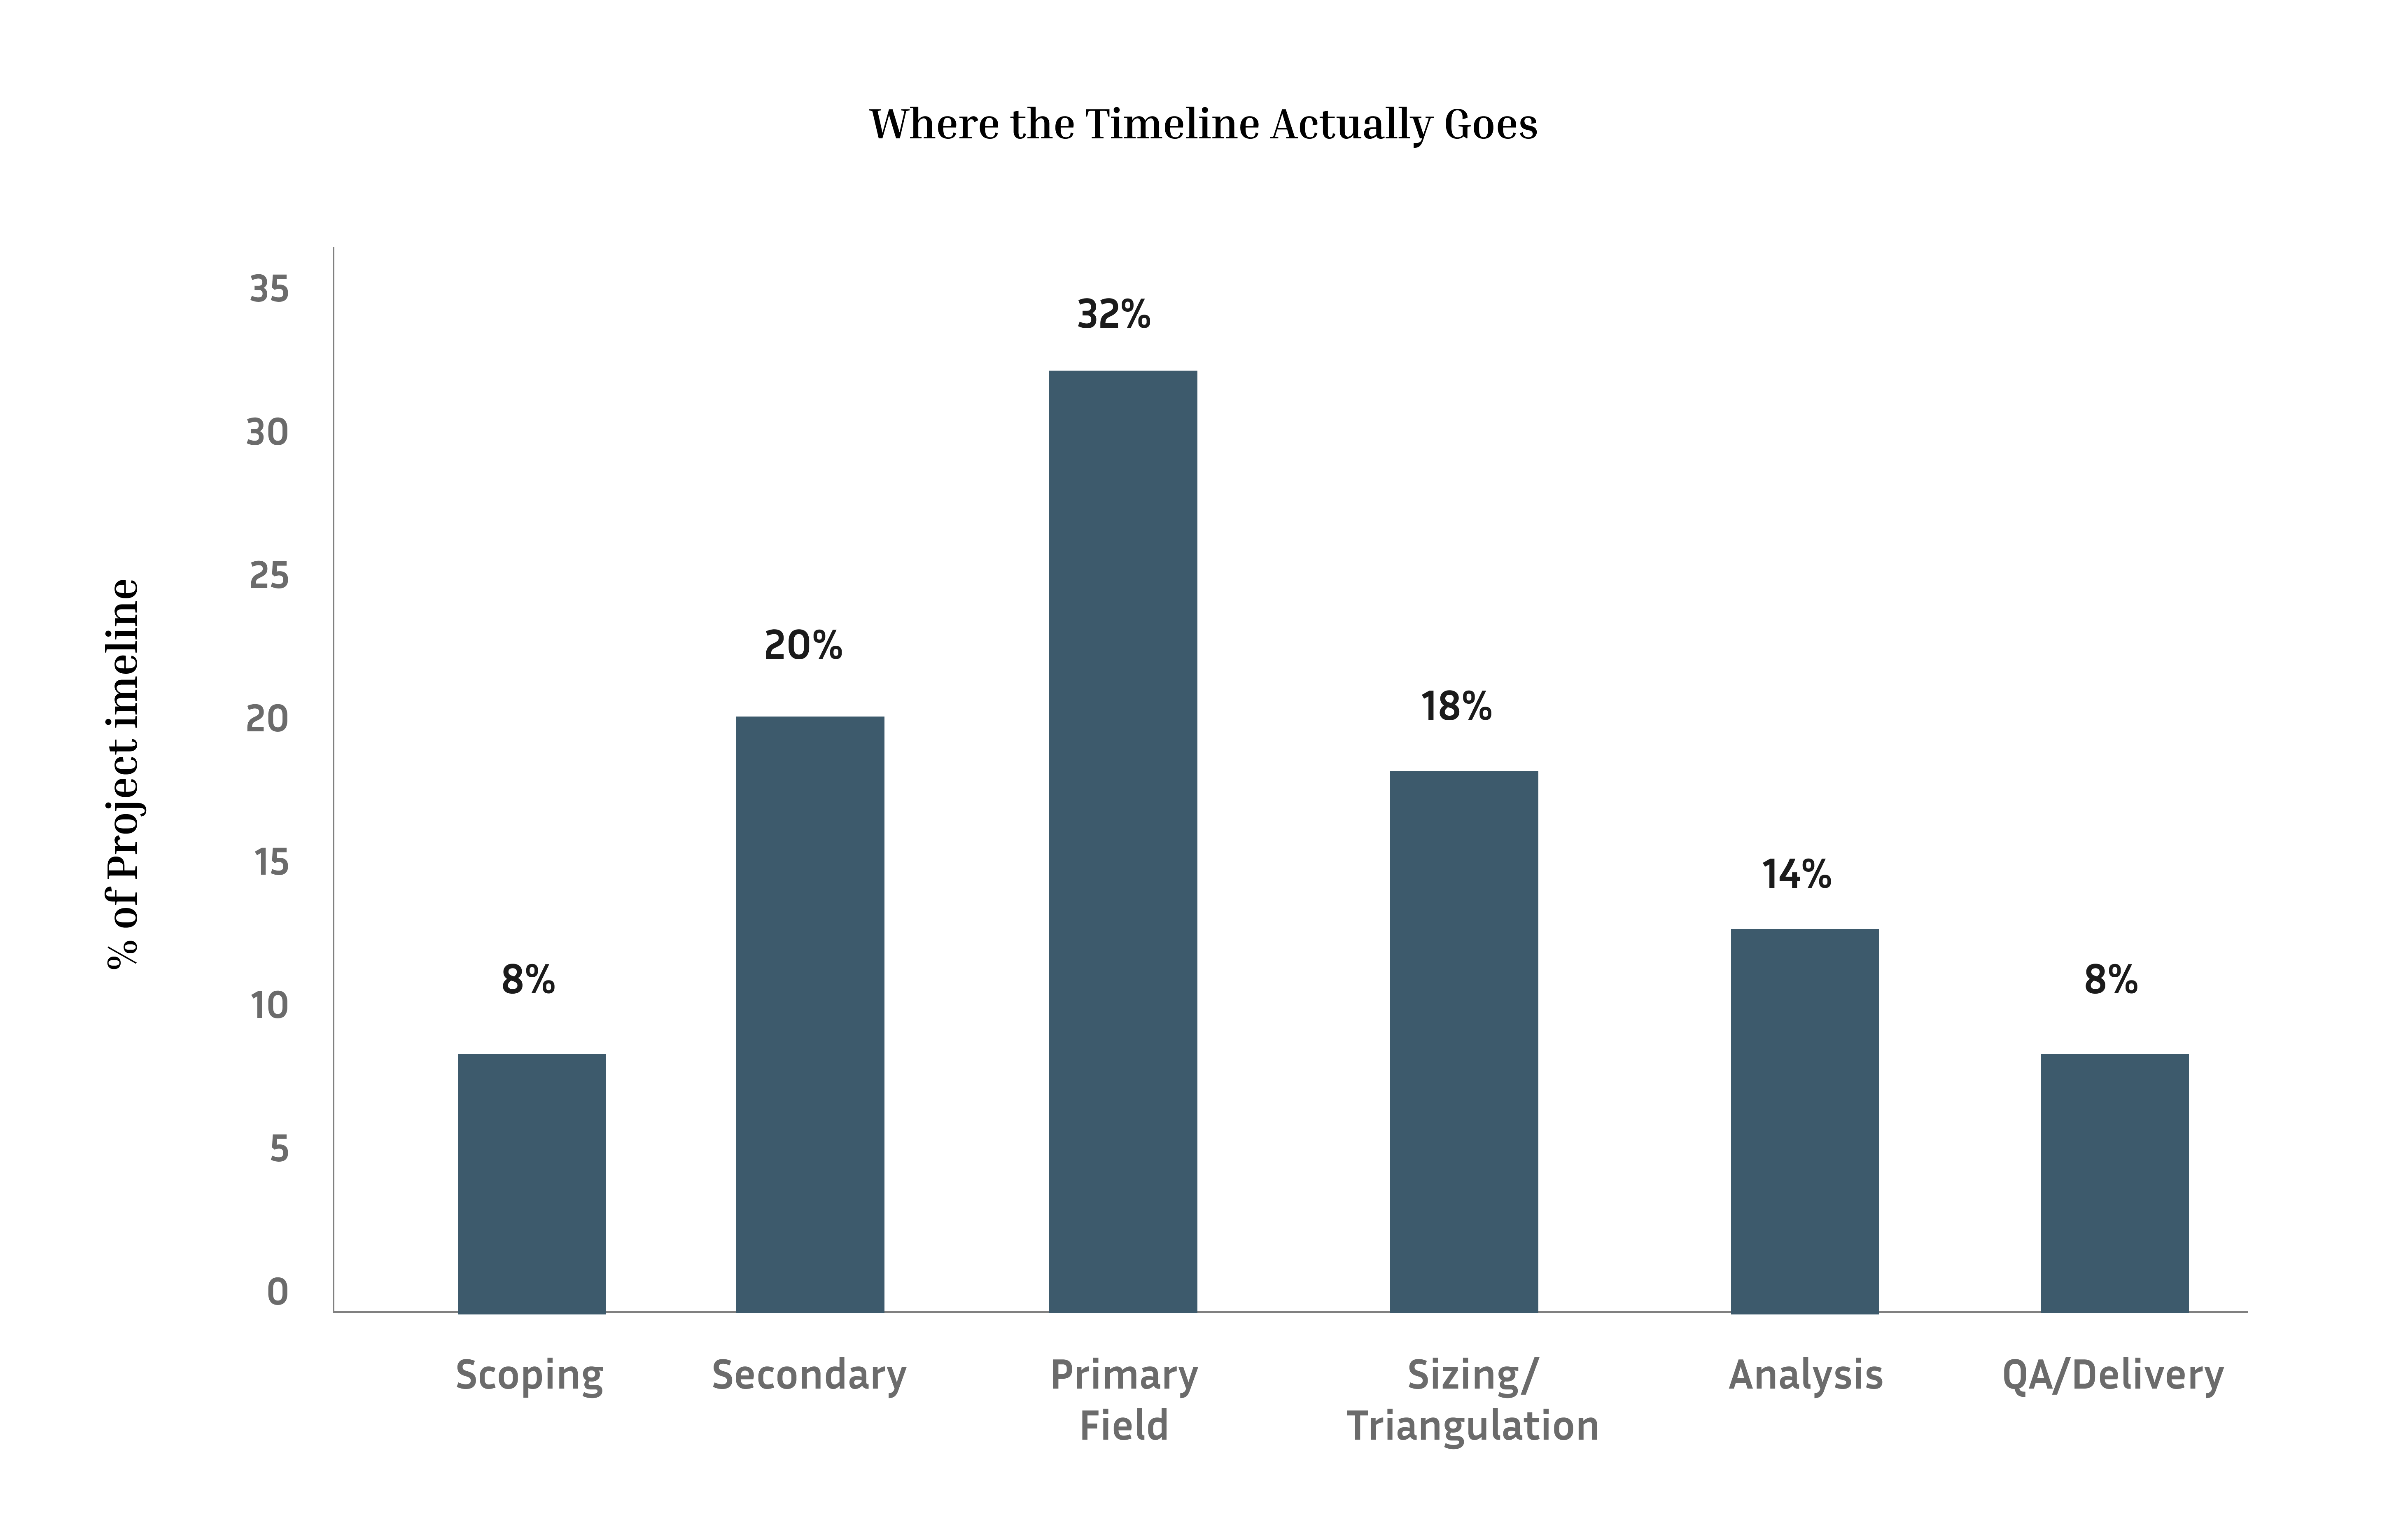
Figure 5 Where the project timeline actually goes.
Political, economic, social, technological, environmental, legal factors shaping category trajectory.
Supplier/buyer power, entry barriers, substitutes, competitive rivalry.
Raw material → processing → distribution → end-use, with margin pools at each stage.
SWOT / competitive benchmarking
Player-level strengths, weaknesses, and strategic moves (capacity, M&A, product launches).
CAGR = (Ending Value / Beginning Value)^(1/n) − 1
Base forecasts use trend extrapolation and CAGR modelling anchored to historical data; complex categories layer in regression against macro drivers (GDP, capex cycles, regulatory shifts) and scenario modelling (base / optimistic / conservative) where volatility is high.
| TECHNIQUE | APPLIED WHEN |
| CAGR / trend extrapolation | Stable, mature categories with consistent historicals |
| Regression on macro drivers | Categories tightly linked to GDP, industrial output, or capex cycles |
| Scenario modelling (base/high/low) | Emerging categories, regulatory uncertainty, technology disruption risk |
| Bass diffusion / adoption curve | Emerging categories, regulatory uncertainty, technology disruption risk |
✓ Informed consent & respondent confidentiality on every primary study
✓ Panel quality checks speeders, straight-liners, attention traps removed
✓ Interviewer training & back-checks (min. 10% of CATI sample)
✓ Data cleaning: logic checks, outlier review, range validation
✓ Bias controls: question randomization, balanced scales
✓ Version-controlled data files with full audit trail
✓ Compliance with ESOMAR / MRS guidelines
✓ Independent second-analyst review before client delivery

Figure 6 The full engagement runs scoping through delivery in six phases.
Typical timeline: 6–10 weeks end to end for a standard syndicated study; 10–16 weeks for custom multi-market primary programs.