Asia Pacific Transfer Pricing Market
Analysis by Type (Transfer Pricing Planning, Transfer Pricing Compliance, Operational Transfer Pricing, Others), Application (SMEs, Large Enterprise) and Country


Analysis by Type (Transfer Pricing Planning, Transfer Pricing Compliance, Operational Transfer Pricing, Others), Application (SMEs, Large Enterprise) and Country
The Asia Pacific Transfer Pricing Market was valued at US$4,967.3 million in 2022 and US$5,721.4 million in 2024. It is projected to reach US$6,165.7 million in 2025 and US$10,083.6 million by 2031, registering a CAGR of 8.4% between 2024 and 2031. Over this period, annual market revenue increases by approximately US$4,362.2 million, and the market more than doubles from its 2022 level.
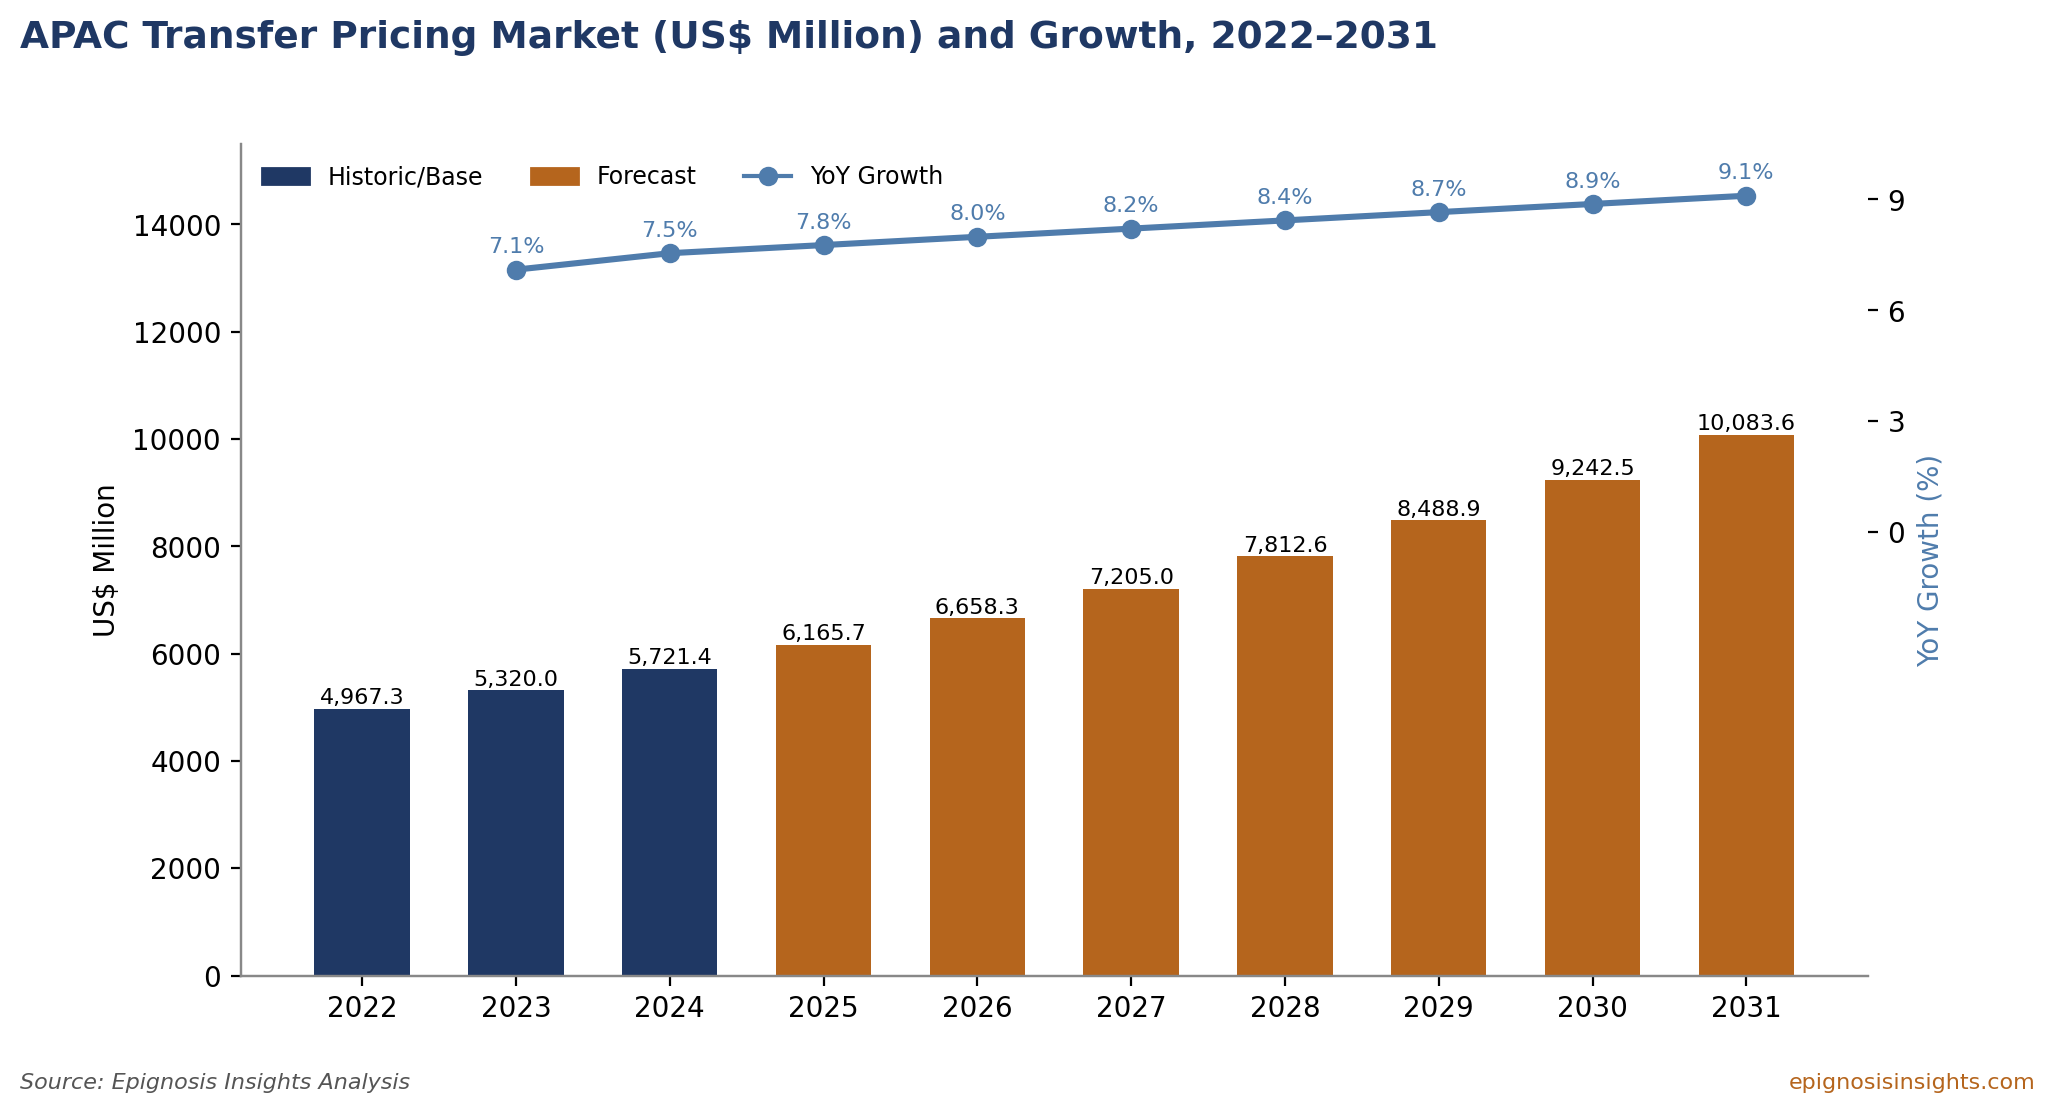
Figure 1: Asia Pacific Transfer Pricing Market Size (US$ Million) and Year-on-Year Growth, 2022–2031
Growth accelerates steadily throughout the forecast period. Annual growth of 7.1% in 2023 and 7.5% in 2024 rises to 8.0% in 2026, 8.4% in 2028 and 9.1% in 2031. This acceleration reflects a market in which regulatory obligations are layered on top of one another rather than replaced. Each new rule, whether a documentation requirement, a country-by-country reporting threshold or a minimum tax regime, adds recurring compliance work while also triggering new planning and restructuring projects. As multinational groups expand their Asian footprints and tax authorities increase their audit capacity, the volume and complexity of transfer pricing work compounds year after year.
Transfer pricing refers to the pricing of transactions between related entities within a multinational group, such as sales of goods, provision of services, licensing of intellectual property and intercompany financing. Tax authorities require these prices to reflect the arm's length principle, meaning they should be consistent with prices that independent parties would agree. This report covers professional services that help businesses design transfer pricing policies, document and defend them, implement them in financial systems and resolve disputes with tax authorities across Asia Pacific.
The revenue structure of the market combines a large recurring base with a layer of project-driven work. Annual documentation, country-by-country reporting and operational transfer pricing calculations recur every year and grow with the number of entities and jurisdictions in which clients operate. On top of this base sit project engagements such as policy redesign, business restructuring, advance pricing agreement applications, audit defence and Pillar Two implementation. Recurring work provides stability and visibility for advisory firms, while project work rises sharply whenever regulations change or clients restructure. The combination explains why the market has shown steady, uninterrupted growth and why the forecast shows acceleration rather than volatility as regulatory complexity continues to increase across the region.
The most significant driver of market growth is the implementation of the OECD's Pillar Two global minimum tax, which applies a 15% minimum effective tax rate to multinational groups with consolidated revenue of at least EUR 750 million. Asia Pacific has adopted the rules in waves. According to Mayer Brown, Pillar Two took effect in Japan, South Korea and Vietnam on 1 January 2024, followed by Singapore, Malaysia, Hong Kong, Indonesia, Thailand and Taiwan on 1 January 2025. Hong Kong's implementing legislation, the Inland Revenue (Amendment) (Minimum Tax for Multinational Enterprise Groups) Ordinance 2025, was enacted on 6 June 2025 and applies to fiscal years beginning on or after 1 January 2025.
Pillar Two does not replace transfer pricing rules, but it increases their importance. Because top-up tax is calculated on a jurisdiction-by-jurisdiction basis, the allocation of profits between group entities directly affects the effective tax rate in each jurisdiction and therefore the amount of top-up tax payable.
Multinational groups must re-examine their transfer pricing policies, intercompany agreements and tax incentive structures to understand their Pillar Two exposure. They must also collect new data and file new returns, which creates recurring compliance work. The staggered adoption timeline across the region means that this work will continue to expand throughout the forecast period rather than peak in a single year.
The second driver is the steady increase in transfer pricing enforcement by tax authorities across the region. Following the OECD's Base Erosion and Profit Shifting project, most major Asia Pacific economies have adopted three-tier documentation consisting of a master file, local file and country-by-country report. Tax authorities have built specialist transfer pricing audit teams, introduced penalties for inadequate documentation, and increasingly use data analytics to select cases for review.
This enforcement environment is a major reason why compliance services represent nearly two thirds of the market. Multinational groups operating in several Asian countries must prepare annual documentation in each jurisdiction, often in local languages and formats, while defending positions in audits that can take several years to resolve. Demand for advance pricing agreements and mutual agreement procedures is also rising as businesses seek certainty in high-risk transactions, particularly those involving intellectual property, management services and intercompany financing.
The market faces several constraints. Transfer pricing requires a rare combination of tax, accounting, economic and industry expertise, and qualified professionals are in short supply across the region. This shortage raises costs for advisory firms and limits their capacity to serve smaller clients. Fee pressure is also increasing, as clients seek to reduce the cost of recurring documentation work and procurement teams run competitive tenders for compliance engagements.
Regulatory fragmentation adds complexity. While most countries follow OECD guidelines, each jurisdiction applies its own documentation thresholds, deadlines, penalty regimes and audit practices. For smaller businesses with limited resources, the cost of compliance across multiple jurisdictions can be disproportionately high. These constraints are pushing the market toward technology-enabled delivery, standardised regional documentation models and outsourced compliance arrangements.
A significant opportunity is emerging from the reconfiguration of Asian supply chains. Many multinational groups are diversifying manufacturing and sourcing away from a single-country model, expanding operations in Vietnam, India, Indonesia and other Southeast Asian economies. Each new manufacturing entity, distribution hub or procurement centre requires a transfer pricing policy, intercompany agreements, benchmarking support and documentation in the new jurisdiction, while existing entities must be repriced to reflect their changed functions and risks.
Business model changes of this kind are among the most valuable engagements for transfer pricing advisers, because they combine planning, implementation and compliance work over several years. They also raise exit charge and restructuring questions in the original jurisdiction, which can lead to audits and disputes. The growth of global capability centres in India, which provide finance, technology, research and engineering services to parent companies worldwide, creates a further stream of demand, as the remuneration of these service centres is a frequent focus of tax authority review. These shifts help explain why planning and operational transfer pricing grow particularly fast in Vietnam, India and Indonesia.
Differences in corporate tax rates are a fundamental source of transfer pricing risk, because they create incentives to allocate profits to lower-taxed jurisdictions and correspondingly increase tax authority scrutiny. Indicative headline corporate tax rates compiled by Epignosis Insights range from 35% in India and 30% in Australia to 25% in China, 24% in South Korea, 22% in Indonesia, 20% in Vietnam, 17% in Singapore and 16% in Hong Kong.
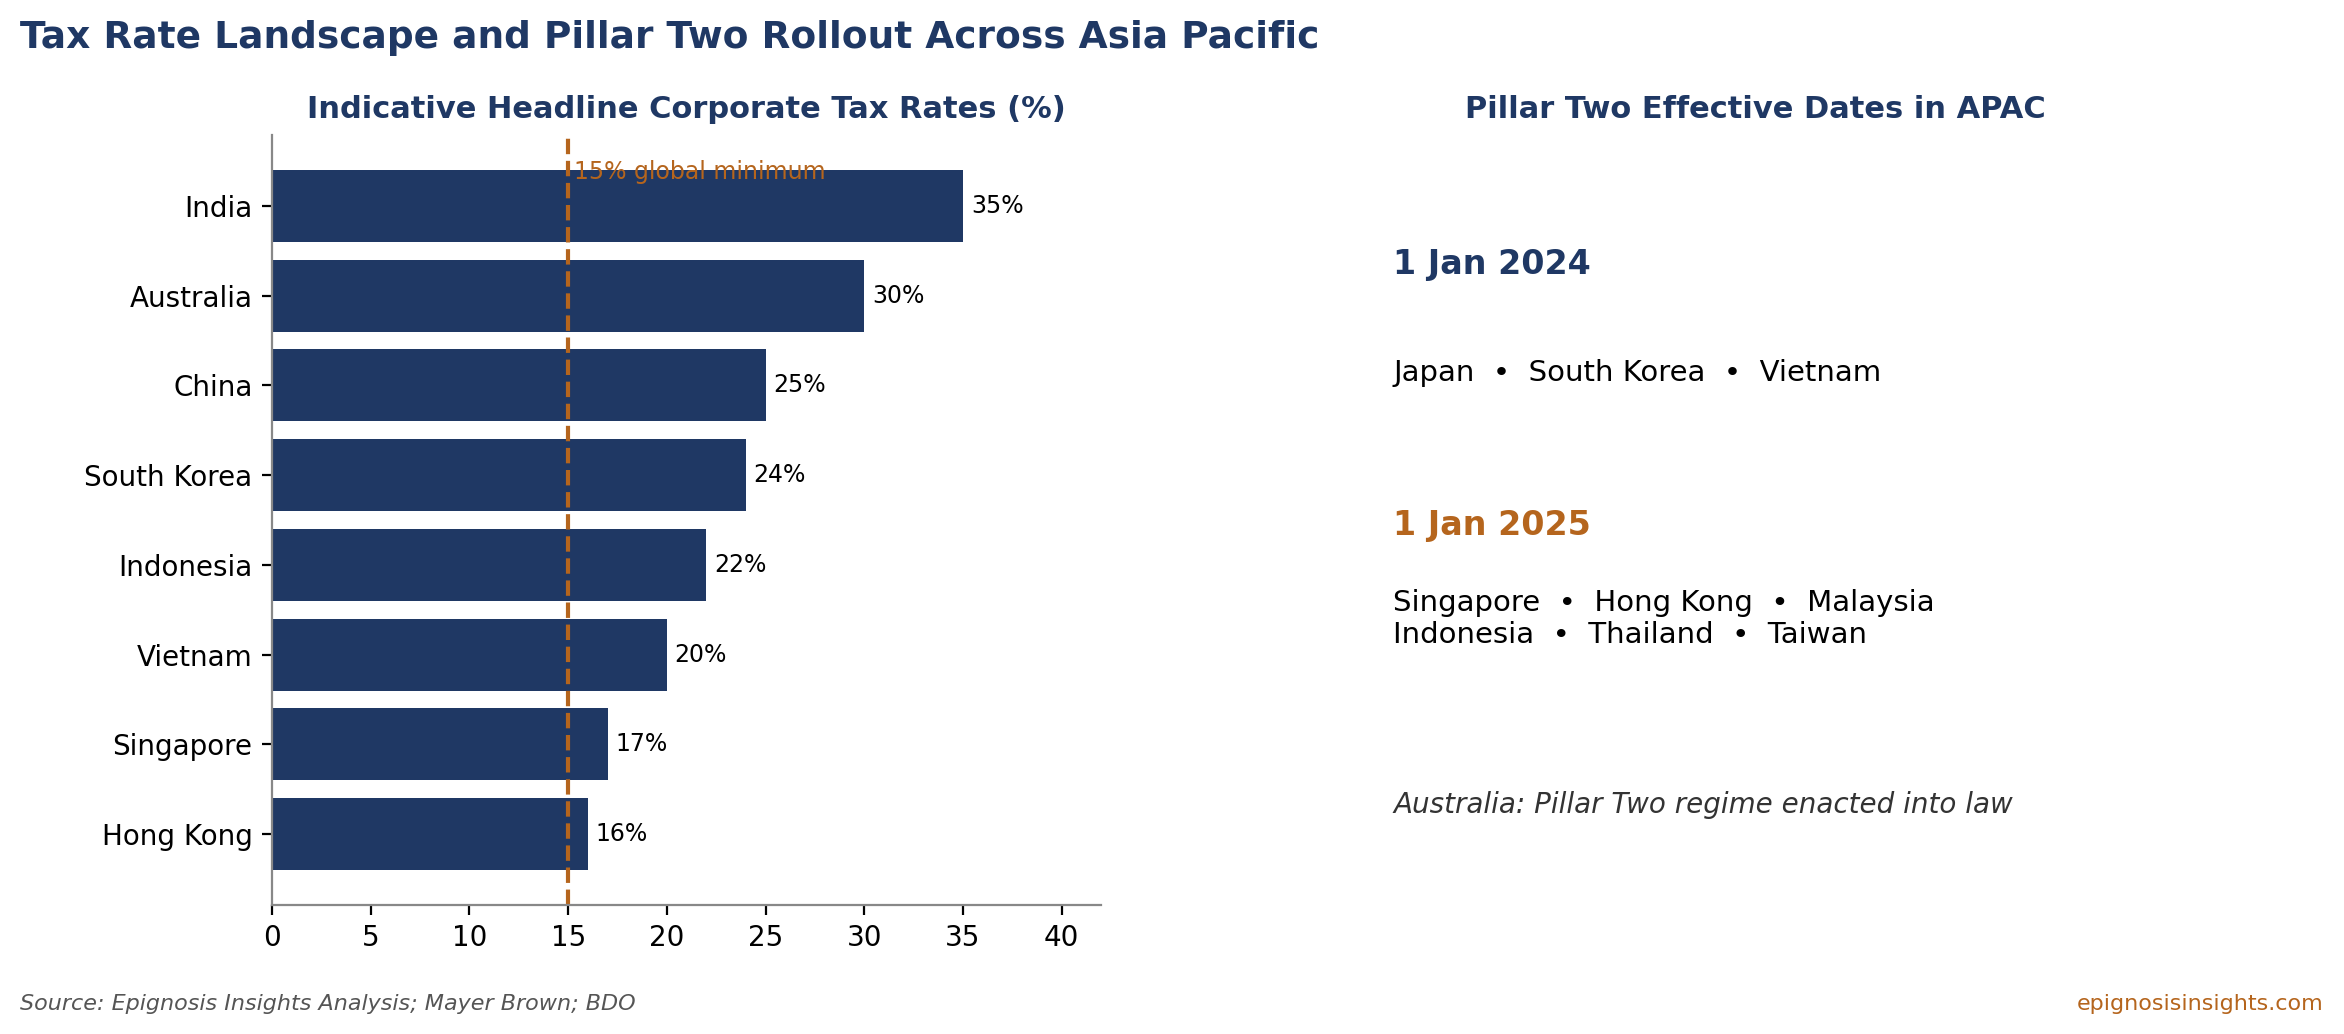
Figure 2: Indicative Headline Corporate Tax Rates and Pillar Two Rollout Across Asia Pacific
The spread of nearly 20 percentage points between the highest and lowest rate jurisdictions explains much of the region's transfer pricing activity. Regional headquarters, treasury centres and intellectual property holding companies are frequently located in Singapore and Hong Kong, while manufacturing, distribution and service delivery operations are located in higher-tax jurisdictions such as India, Australia, China and Indonesia. Tax authorities in higher-rate countries closely scrutinise payments to regional hubs, including royalties, management fees and procurement margins. Pillar Two narrows the effective benefit of low-rate jurisdictions for large groups, prompting many to revisit the substance and pricing of their regional hub structures, which generates additional planning and restructuring work.
Transfer pricing compliance is the dominant service type, valued at US$3,716.5 million in 2024, equivalent to 65.0% of the market. It is projected to reach US$6,512.1 million by 2031 at an 8.3% CAGR. Compliance services include the preparation of master files, local files and country-by-country reports, benchmarking studies, annual documentation updates, audit support and statutory filings. Its recurring nature provides a stable revenue base for advisory firms, and it contributes approximately US$2,795.6 million, or 64%, of new market revenue between 2024 and 2031.
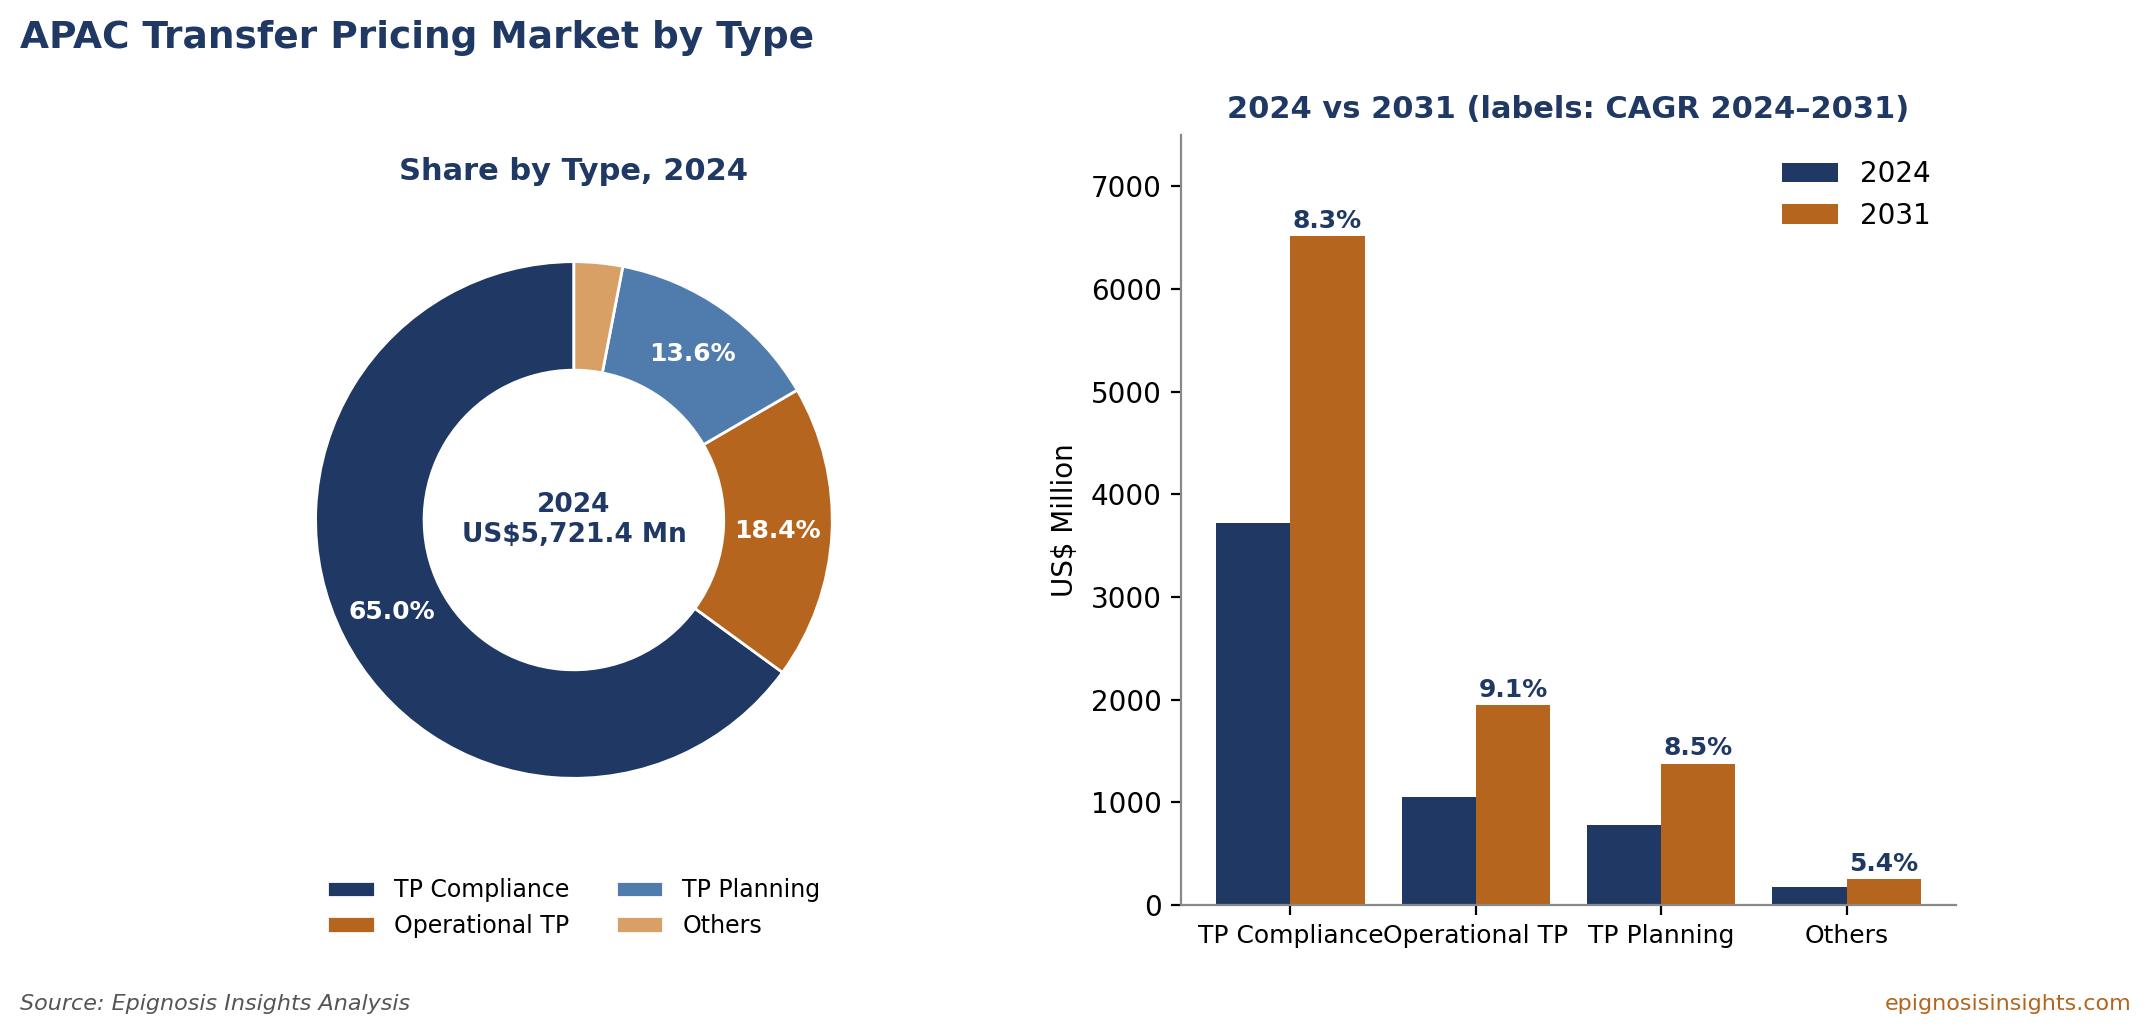
Figure 3: Asia Pacific Transfer Pricing Market by Type – 2024 Share and 2024 vs. 2031 Value
Operational transfer pricing is the fastest growing service type, rising from US$1,054.5 million in 2024 to US$1,943.2 million by 2031 at a 9.1% CAGR. Its share increases from 18.4% to 19.3%. Operational transfer pricing focuses on implementing transfer pricing policies in practice, including calculating intercompany charges in enterprise resource planning systems, monitoring margins during the year, making year-end adjustments and aligning transfer pricing with customs valuation and indirect tax. Growth is driven by tax authority expectations that policies are applied consistently, by Pillar Two data requirements, and by the adoption of automation tools that make operational transfer pricing more efficient.
Transfer pricing planning, valued at US$776.9 million in 2024, grows at 8.5% to US$1,377.9 million by 2031. Planning services include designing transfer pricing policies for new business models, supply chain restructuring, intellectual property planning, advance pricing agreement applications and Pillar Two modelling. The others category, covering training, dispute support and specialised valuation work outside the main categories, grows at 5.4% and represents 3.0% of the market in 2024.
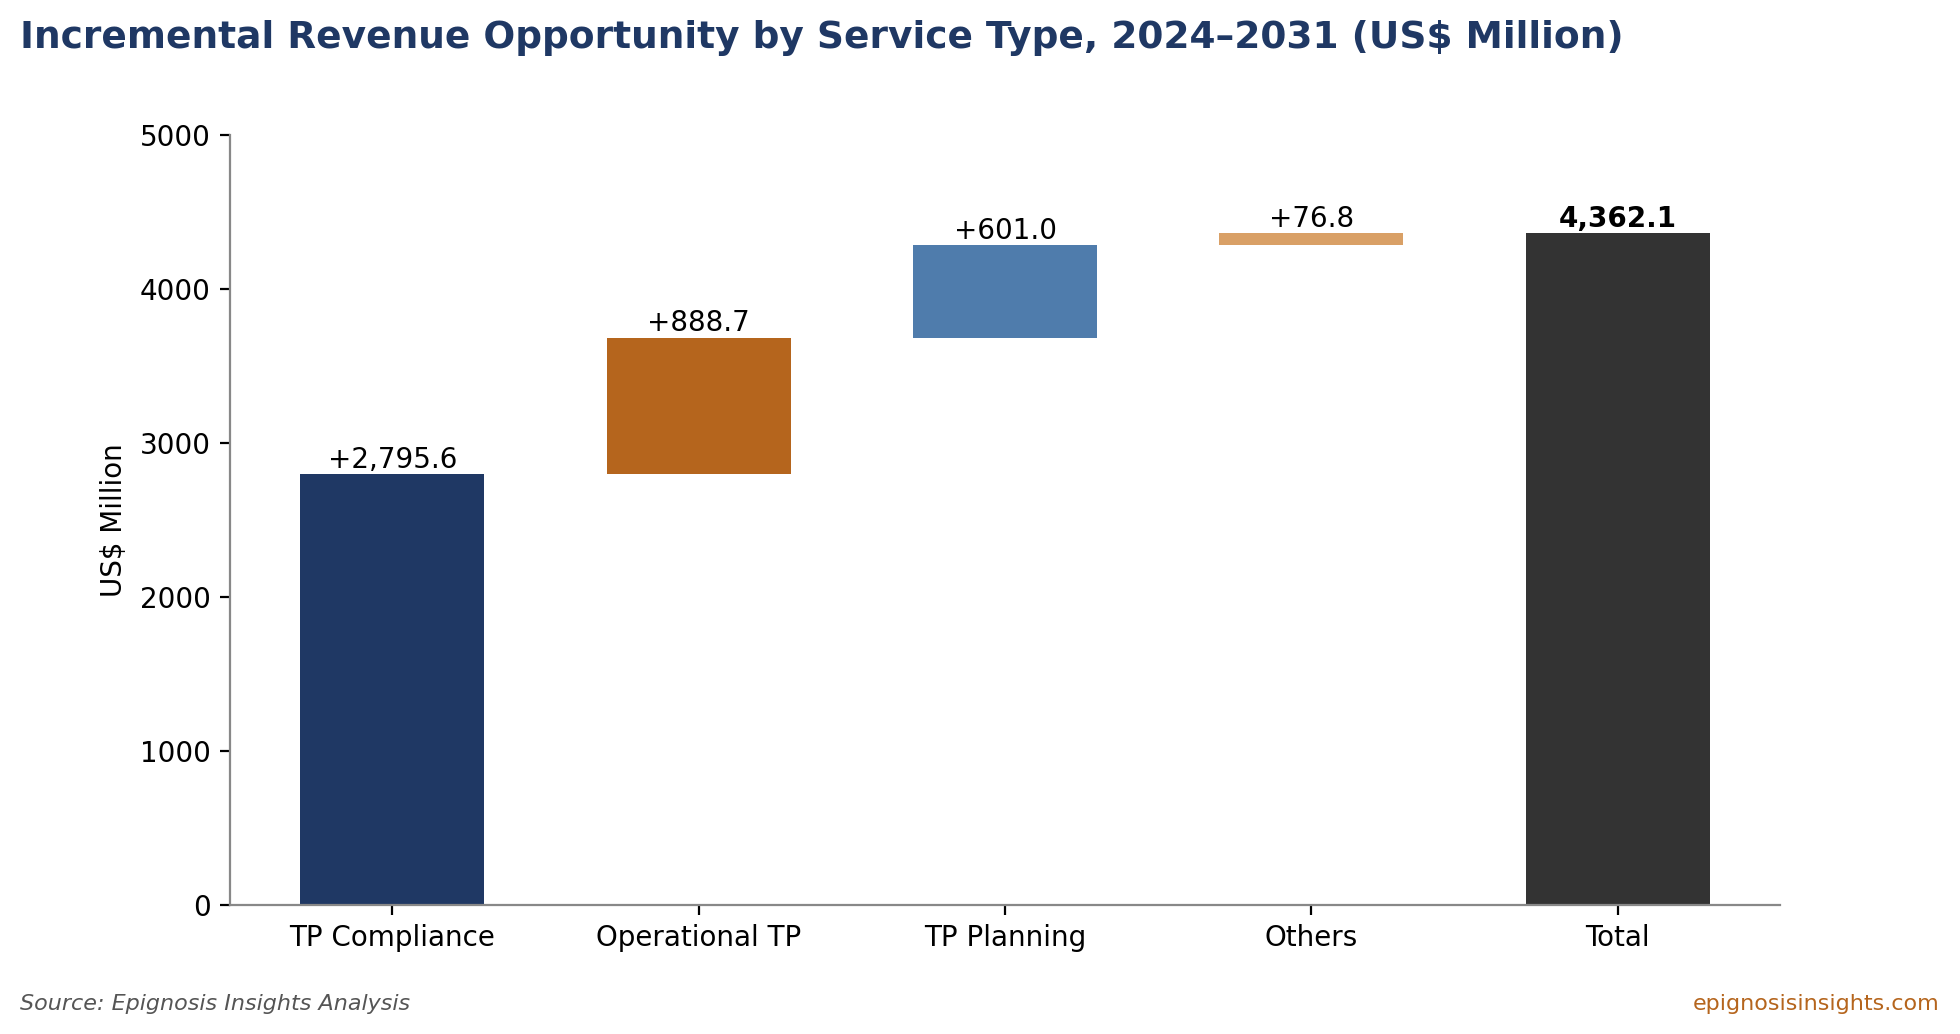
Figure 4: Incremental Revenue Opportunity by Service Type, 2024–2031 (US$ Million)
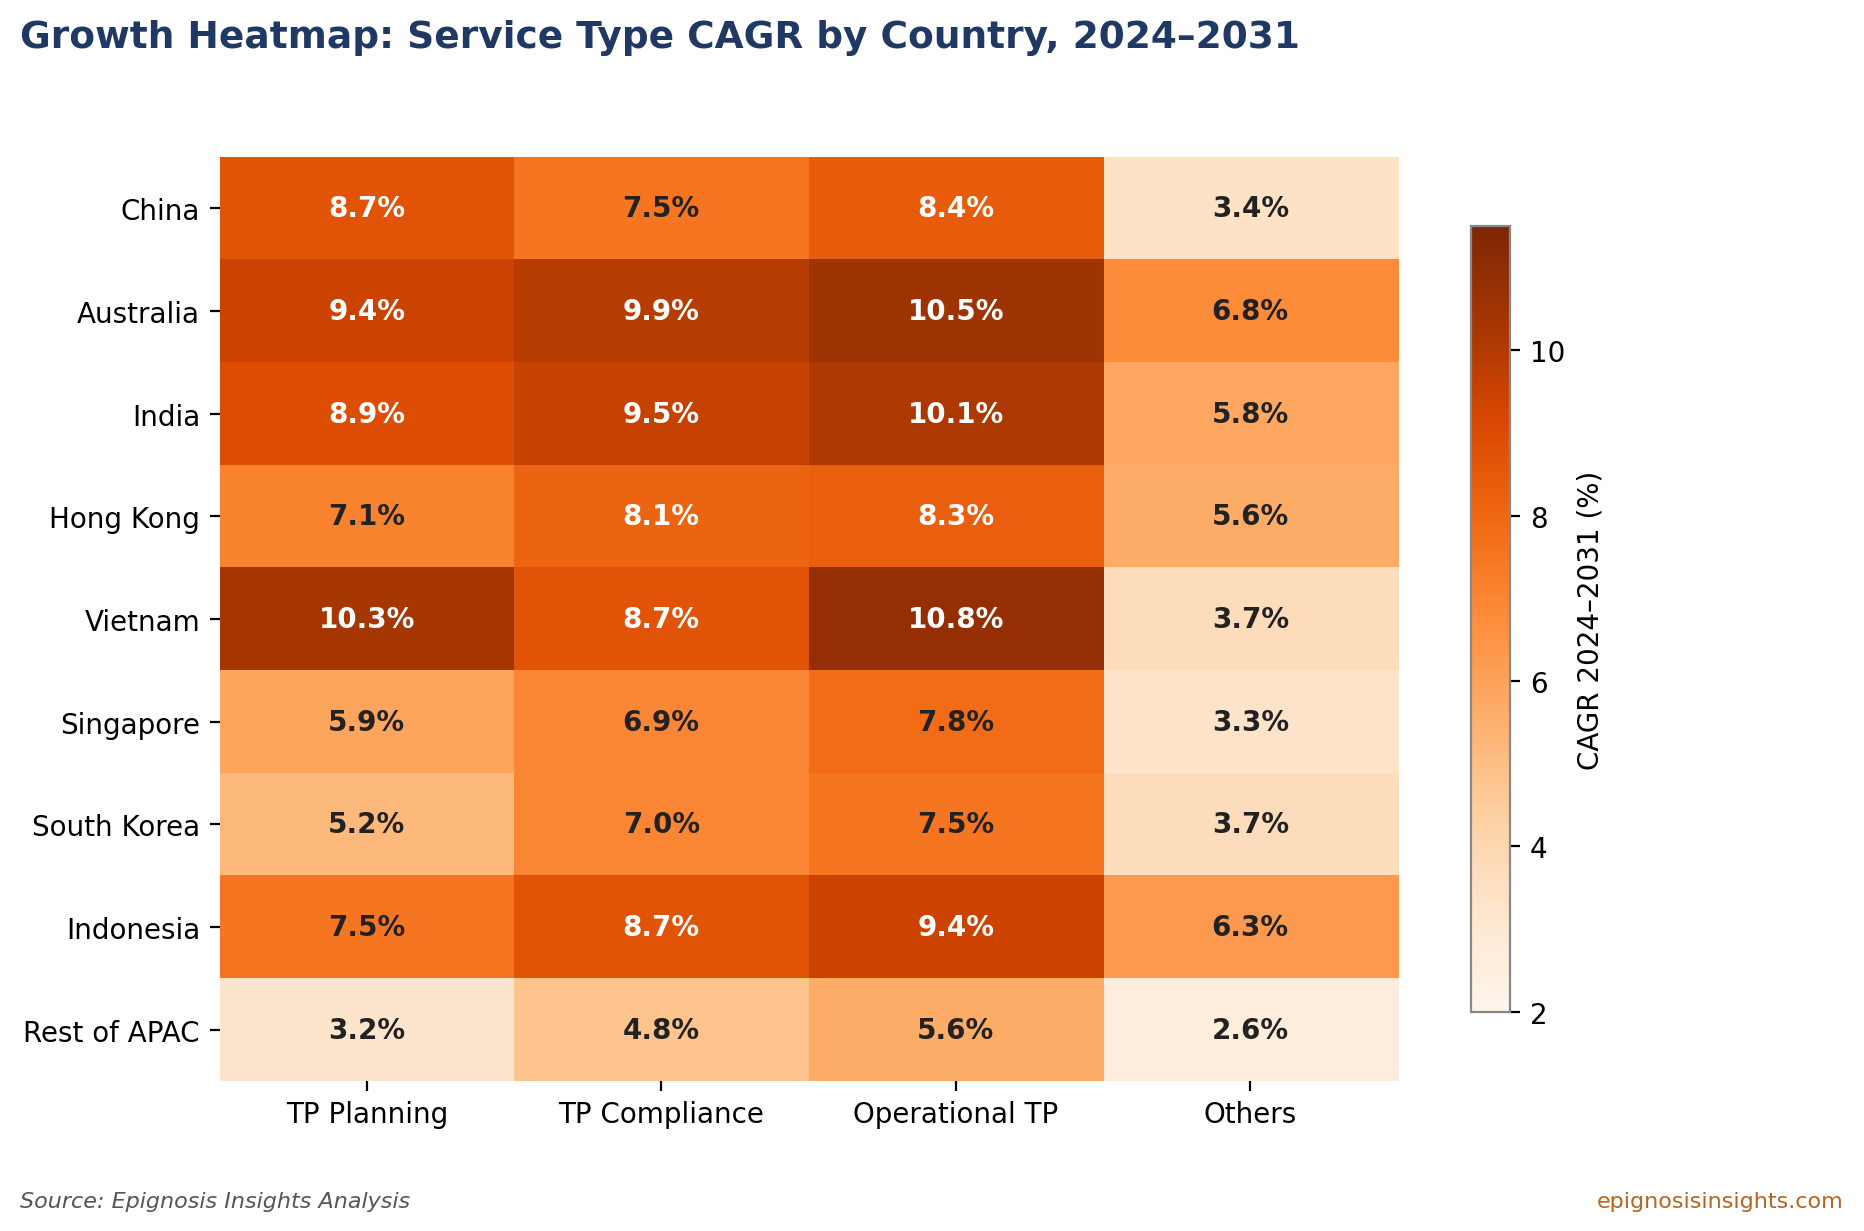
Figure 5: Growth Heatmap – Service Type CAGR by Country, 2024–2031
The country heatmap reveals important differences in service demand. Operational transfer pricing is the fastest growing service type in eight of the nine country markets, reaching 10.8% in Vietnam, 10.5% in Australia and 10.1% in India. Vietnam stands out for transfer pricing planning, which grows at 10.3%, reflecting the continued inflow of manufacturing investment and the need to structure new supply chains. In China, planning grows faster than compliance, at 8.7% against 7.5%, as multinational groups reassess supply chain footprints. In Singapore and South Korea, planning grows at only 5.9% and 5.2% respectively, reflecting more mature advisory markets.
Large enterprises account for the majority of demand, valued at US$4,609.8 million in 2024, or 80.6% of the market, and are projected to reach US$8,041.6 million by 2031 at an 8.3% CAGR. Large multinational groups face the most complex transfer pricing obligations, including country-by-country reporting, Pillar Two compliance and frequent audits, and they typically engage advisers across multiple jurisdictions under regional or global contracts.
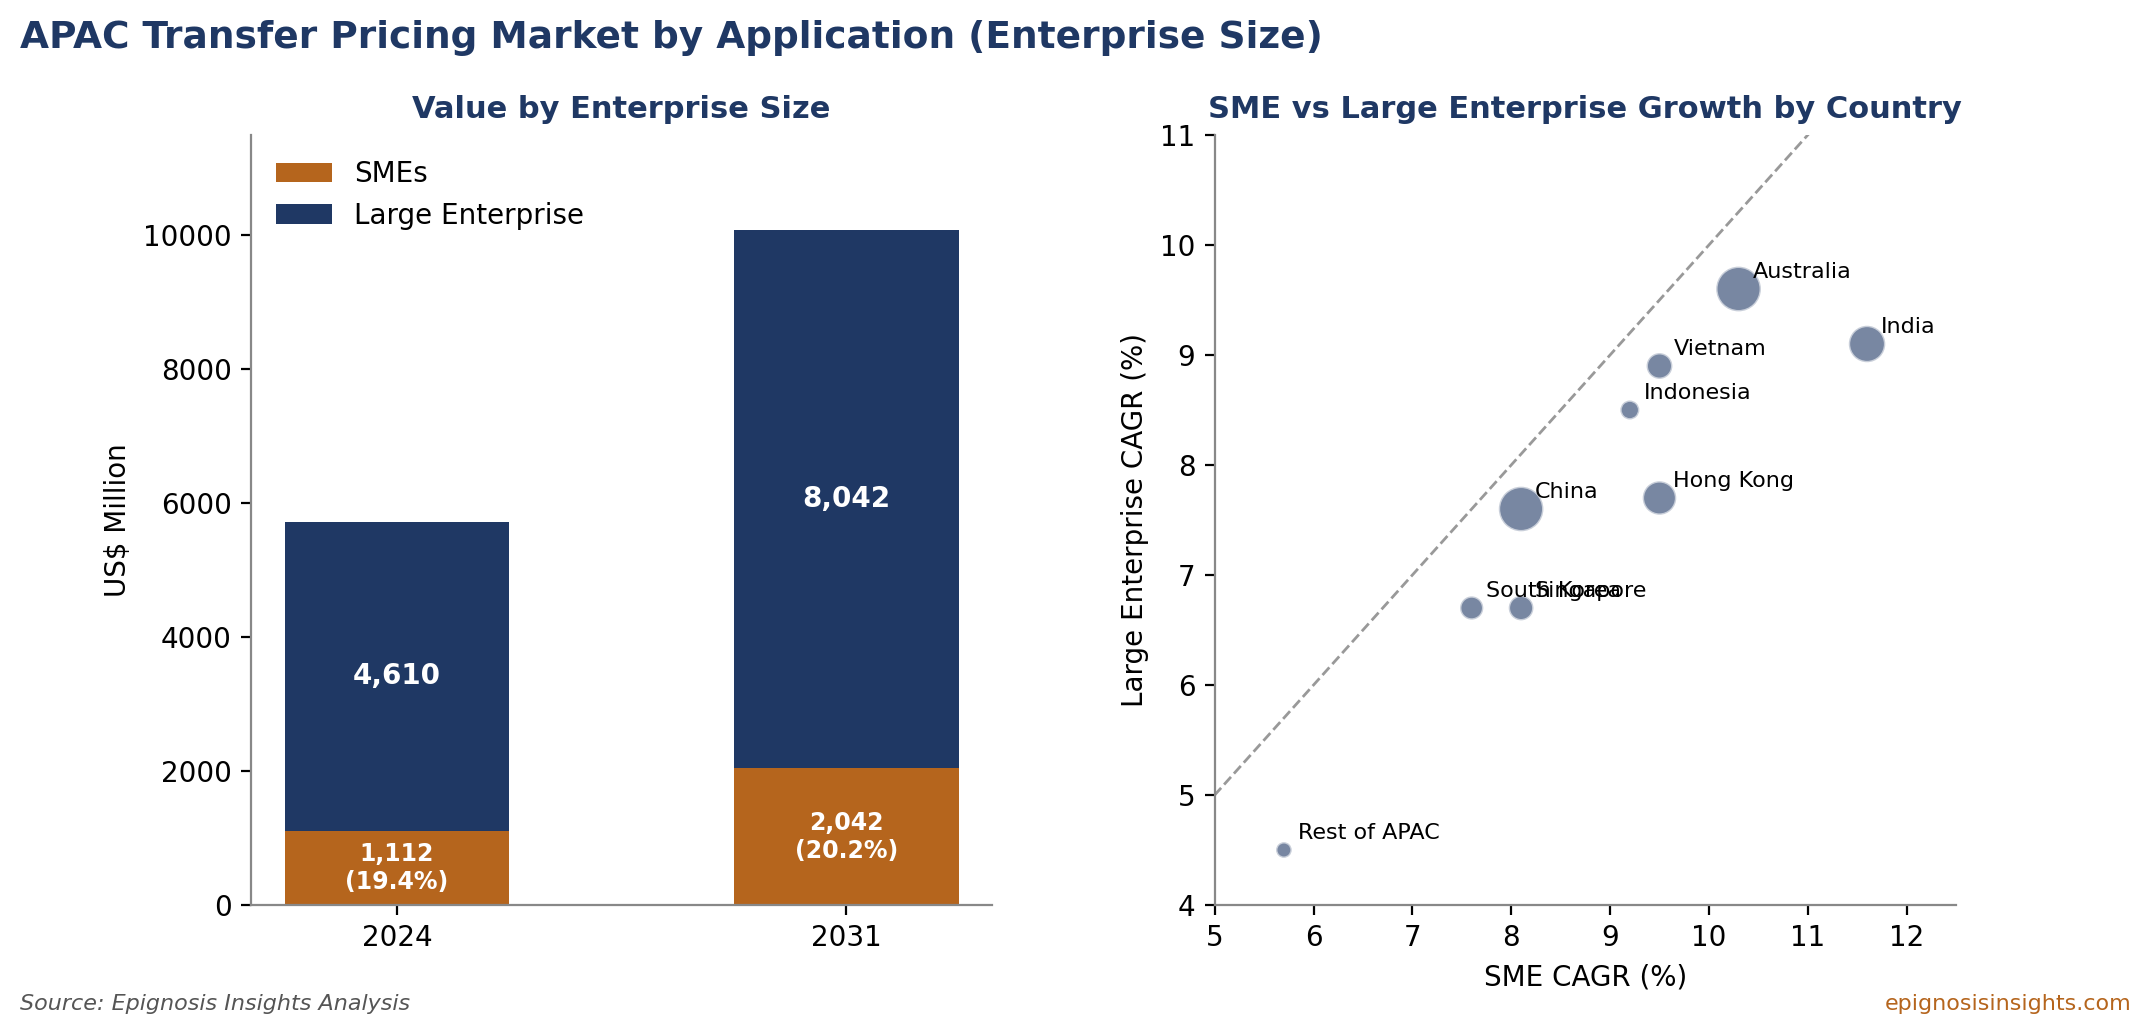
Figure 6: Asia Pacific Transfer Pricing Market by Enterprise Size and SME vs. Large Enterprise Growth by Country
SMEs represent a smaller but faster growing segment, rising from US$1,111.6 million in 2024 to US$2,041.9 million by 2031 at a 9.1% CAGR. Their share increases from 19.4% to 20.2%. Mid-sized companies increasingly operate across borders through regional subsidiaries, e-commerce and outsourced manufacturing, bringing them within the scope of transfer pricing documentation rules even if they fall below Pillar Two thresholds. Tax authorities are also extending audits to mid-market companies, and many SMEs lack in-house expertise, making them reliant on external advisers.
The SME growth advantage is visible in every country. India shows the widest gap, with SME demand growing at 11.6% compared with 9.1% for large enterprises, followed by Australia at 10.3% against 9.6%. Hong Kong's SME segment grows at 9.5%, well ahead of its large enterprise segment at 7.7%. This pattern suggests a growing opportunity for mid-tier advisory firms and technology-enabled compliance services designed for smaller businesses.
China is the largest country market, valued at US$1,417.1 million in 2024, or 24.8% of the regional market, and projected to reach US$2,384.0 million by 2031 at a 7.7% CAGR. China's large inbound investment base, extensive manufacturing operations and active tax administration generate substantial compliance and audit defence work. Australia is the second largest market at US$1,301.0 million, or 22.7%, and the fastest growing at 9.8%, reaching US$2,497.7 million by 2031. Australia's tax authority is widely regarded as one of the most active enforcers of transfer pricing rules in the world, and the country's high corporate tax rate, large resources sector and significant multinational presence sustain strong demand.
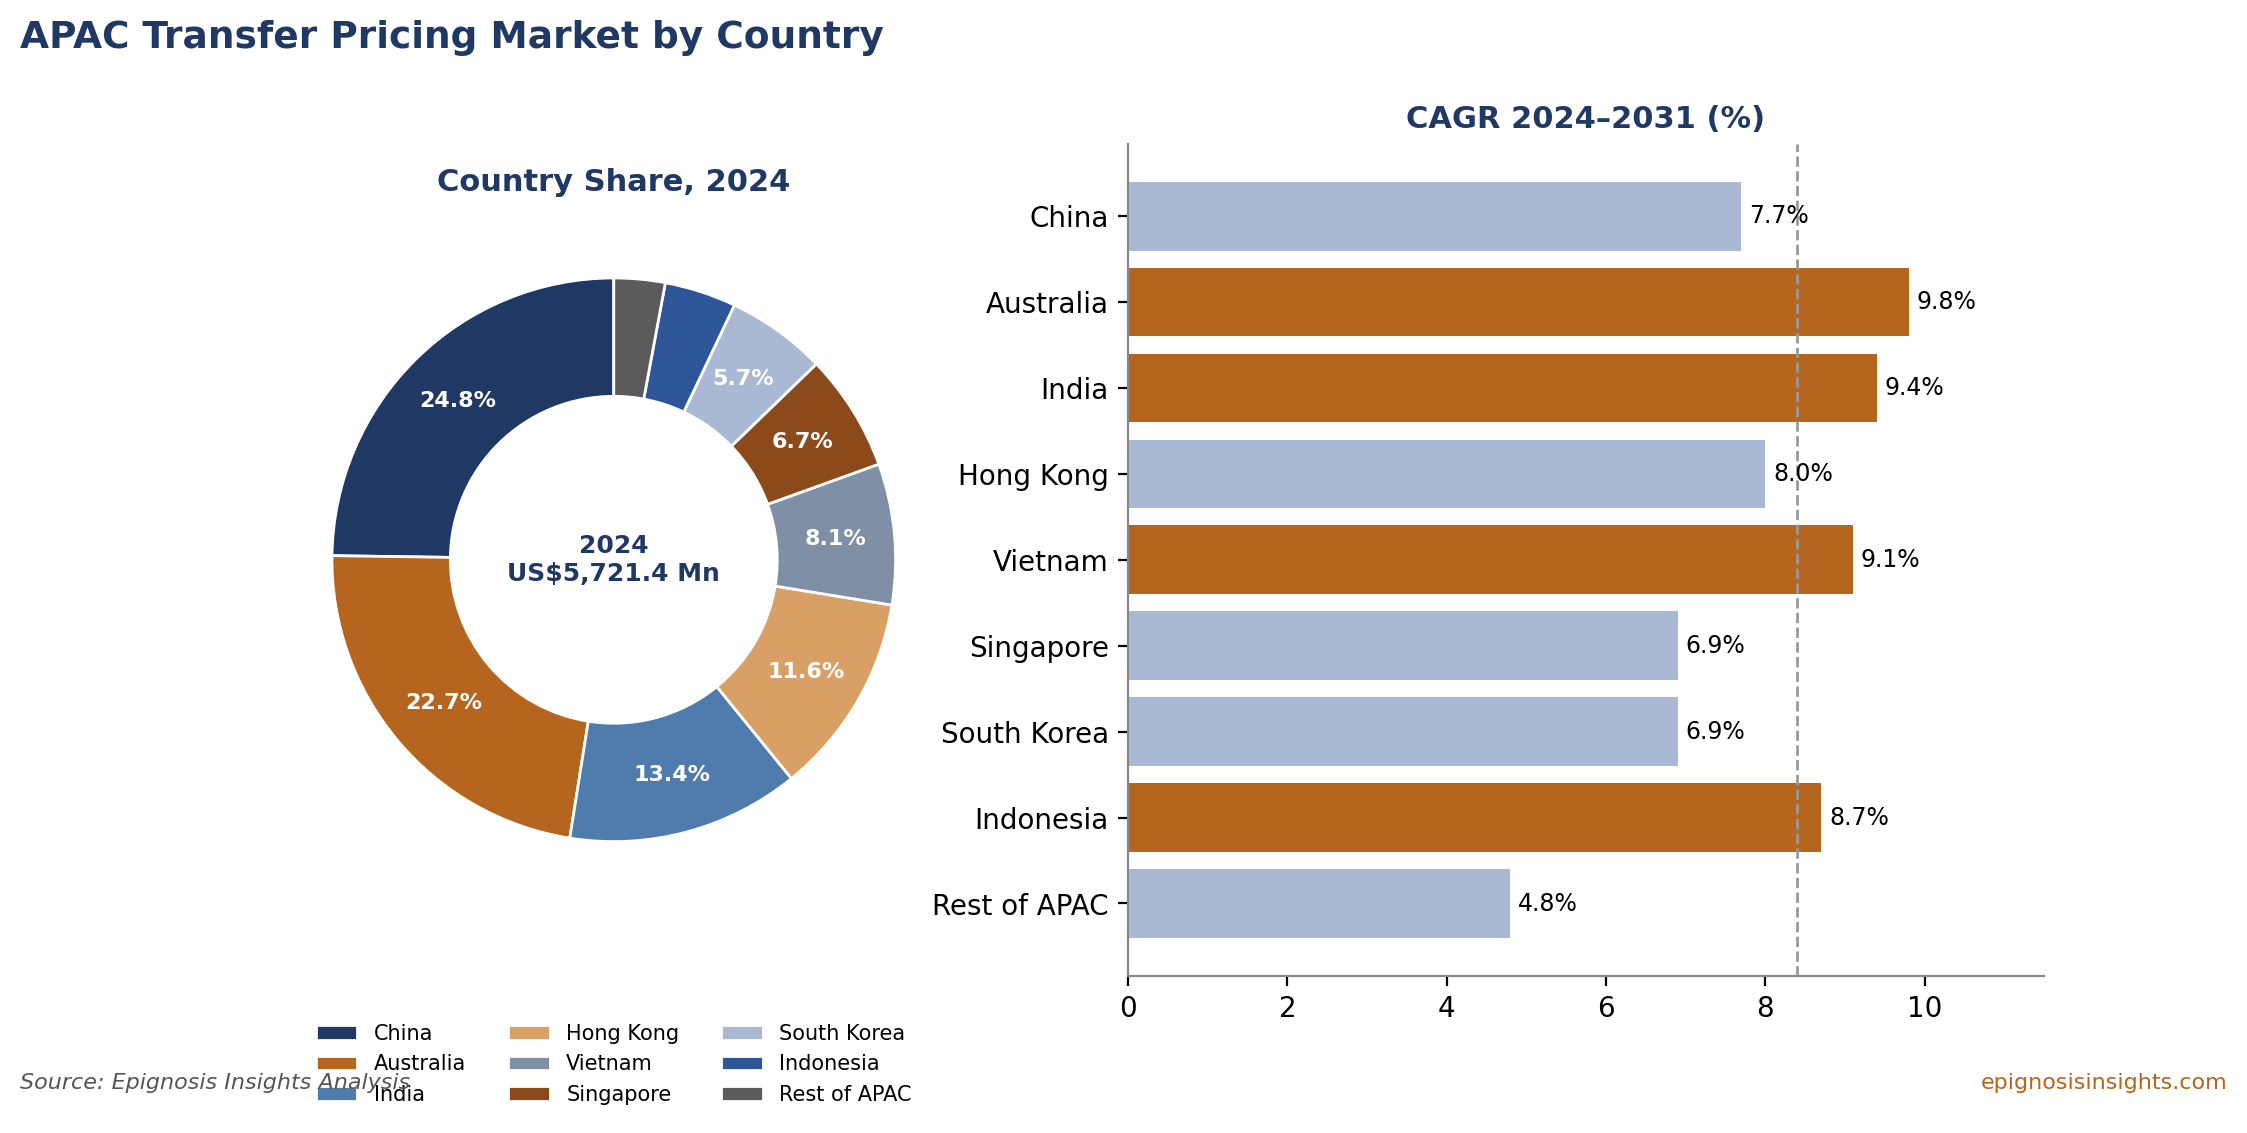
Figure 7: Asia Pacific Transfer Pricing Market by Country – 2024 Share and 2024–2031 CAGR
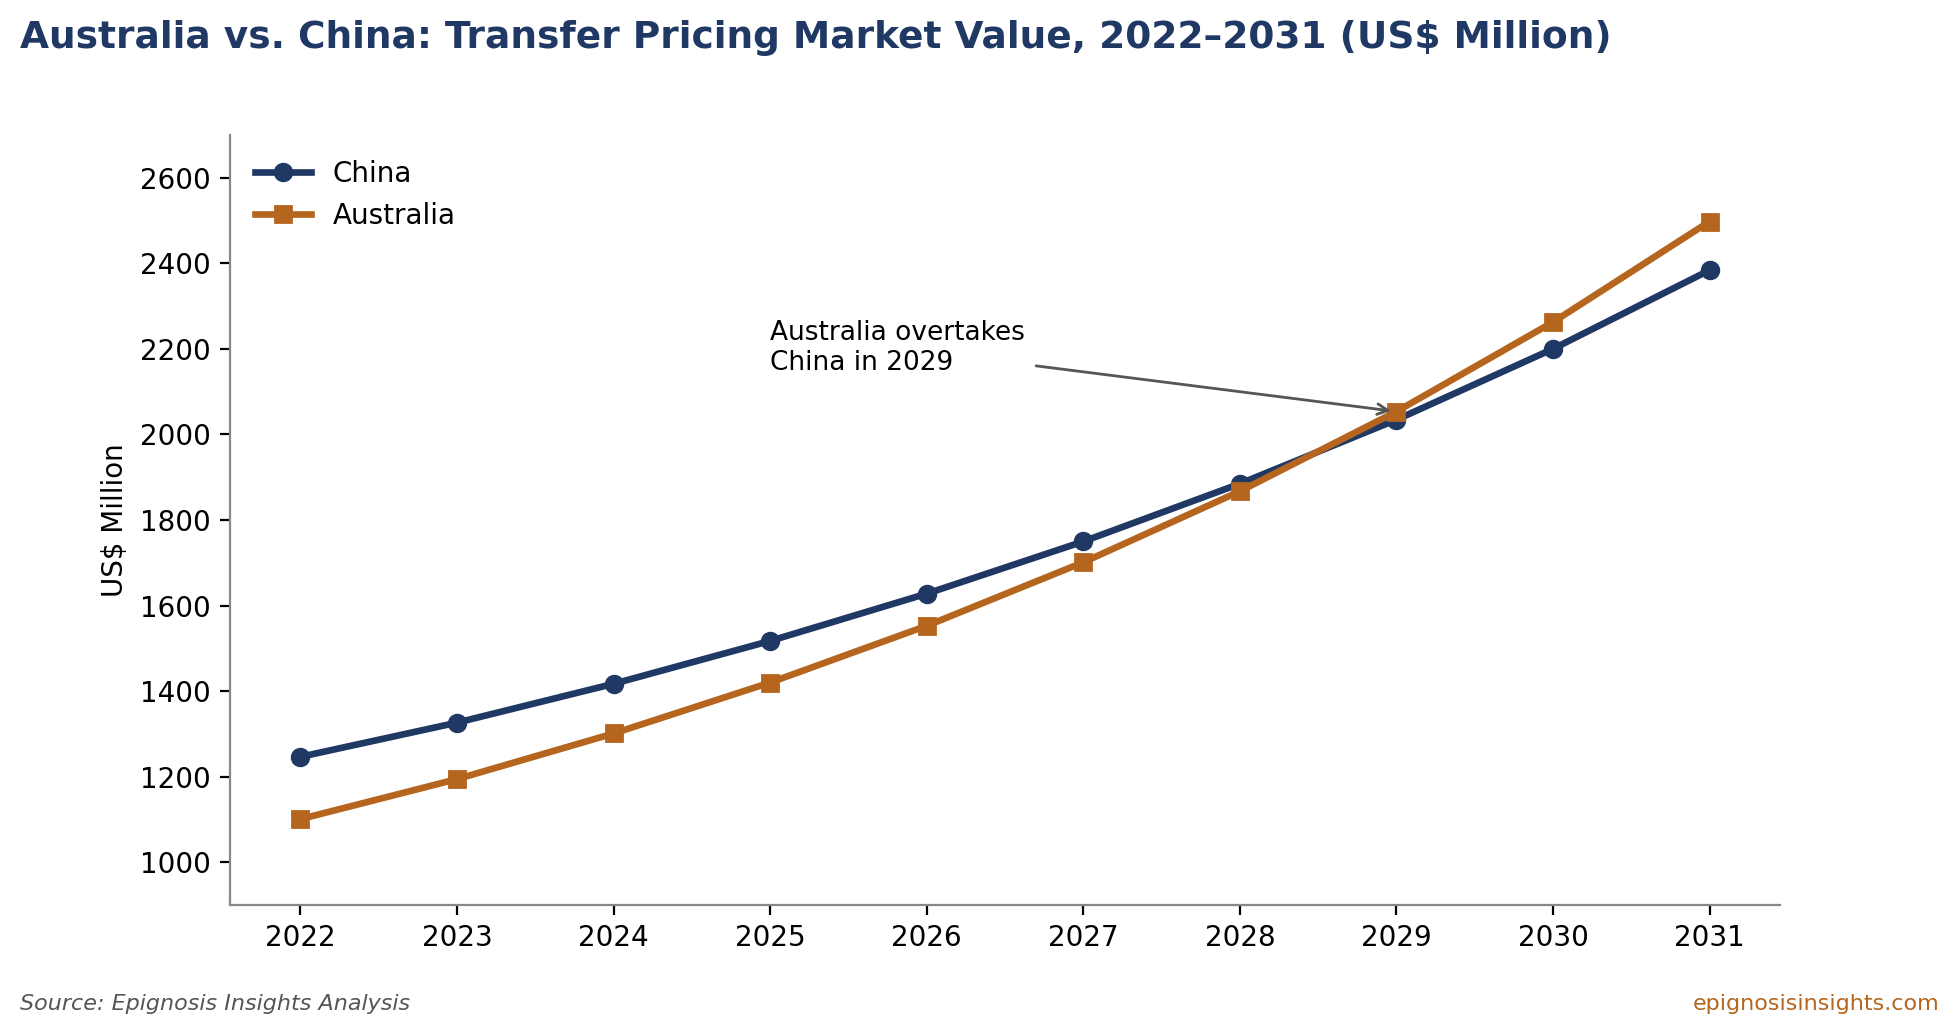
Figure 8: Australia vs. China – Transfer Pricing Market Value, 2022–2031 (US$ Million)
The different growth rates of the two largest markets lead to a change in leadership. Australia's market, which was US$145.6 million smaller than China's in 2022, closes the gap steadily and overtakes China in 2029, when it reaches US$2,053.5 million against US$2,034.3 million. By 2031, Australia leads by more than US$110 million.
India is the third largest market at US$763.9 million in 2024, growing at 9.4% to US$1,431.7 million by 2031. India combines the highest headline corporate tax rate in the region with one of the most active transfer pricing audit programmes, a large and growing base of global capability centres and a vibrant domestic multinational sector. Hong Kong, valued at US$662.0 million, grows at 8.0%, supported by its role as a regional headquarters and gateway to China. Vietnam, valued at US$462.3 million, grows at 9.1%, driven by foreign direct investment in manufacturing and electronics. Singapore and South Korea, valued at US$384.5 million and US$327.8 million respectively, both grow at 6.9%, while Indonesia, valued at US$235.1 million, grows at 8.7%. The rest of Asia Pacific is valued at US$167.7 million and grows at 4.8%.
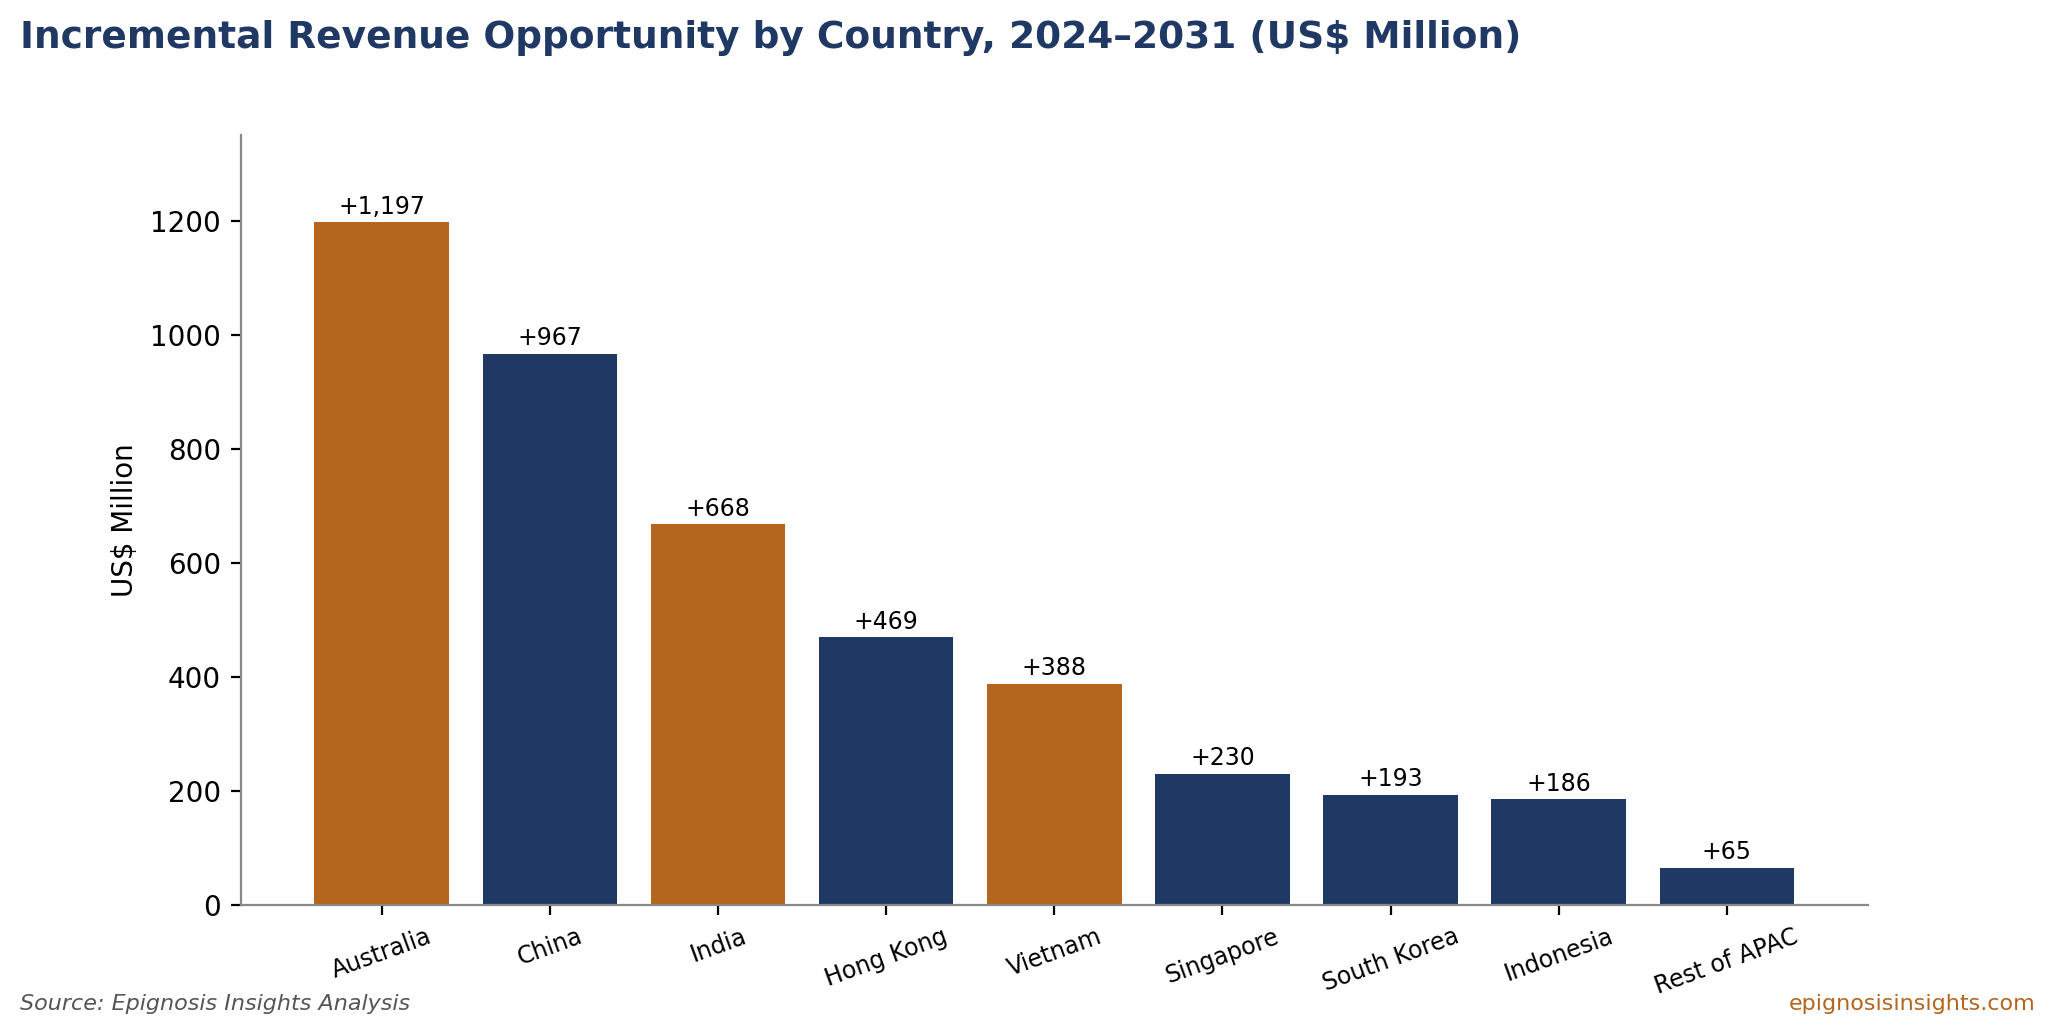
Figure 9: Incremental Revenue Opportunity by Country, 2024–2031 (US$ Million)
Measured by absolute revenue added between 2024 and 2031, Australia contributes approximately US$1,196.7 million, or 27% of total new revenue, followed by China at US$966.9 million and India at US$667.8 million. These three countries together account for nearly two thirds of the market's growth, while Hong Kong and Vietnam add a further US$857.1 million combined.
Key companies analyzed within the Asia Pacific transfer pricing market are: Deloitte, PwC, EY, KPMG, BDO, Grant Thornton, RSM, Forvis Mazars, Kroll, FTI Consulting, Alvarez & Marsal and others.
The market is led by the Big Four professional services networks, Deloitte, PwC, EY and KPMG, which maintain dedicated transfer pricing teams in every major Asia Pacific jurisdiction and serve most large multinational groups. Their advantages include regional coverage, integrated tax and audit relationships, global benchmarking databases and deep experience in dispute resolution and advance pricing agreements. Mid-tier networks such as BDO, Grant Thornton, RSM and Forvis Mazars compete strongly for mid-market multinationals and SMEs, offering lower fees and partner-led service. Specialist economic consulting and valuation firms, including Kroll, FTI Consulting and Alvarez & Marsal, focus on complex valuation, intellectual property, disputes and restructuring-related transfer pricing work.
Competition is increasingly shaped by technology. Firms are investing in automated documentation platforms, benchmarking tools, data analytics for operational transfer pricing and Pillar Two calculation engines. Clients are also adopting managed service models in which compliance work for multiple jurisdictions is delivered centrally at lower cost. Independence rules that restrict audit firms from providing certain tax services to audit clients create opportunities for non-audit competitors, particularly mid-tier networks and specialist firms.
The Epignosis Insights Competitive Assessment Framework EICAF for the Asia Pacific transfer pricing market evaluates firms across 10 weighted parameters. APAC country coverage and local expertise receives the highest weighting at 15%, because clients require consistent support across multiple jurisdictions with different rules. Transfer pricing compliance and documentation capability receives 13%, reflecting the dominance of compliance in market value. Dispute resolution, advance pricing agreement and mutual agreement procedure experience and Pillar Two and BEPS advisory depth each receive 12%. Technology, automation and data analytics receives 11%, and operational transfer pricing implementation receives 10%. Economic and benchmarking databases receive 8%, industry specialisation and pricing and mid-market accessibility each receive 7%, and brand and regulator credibility receives 5%. The total weighting equals 100%.
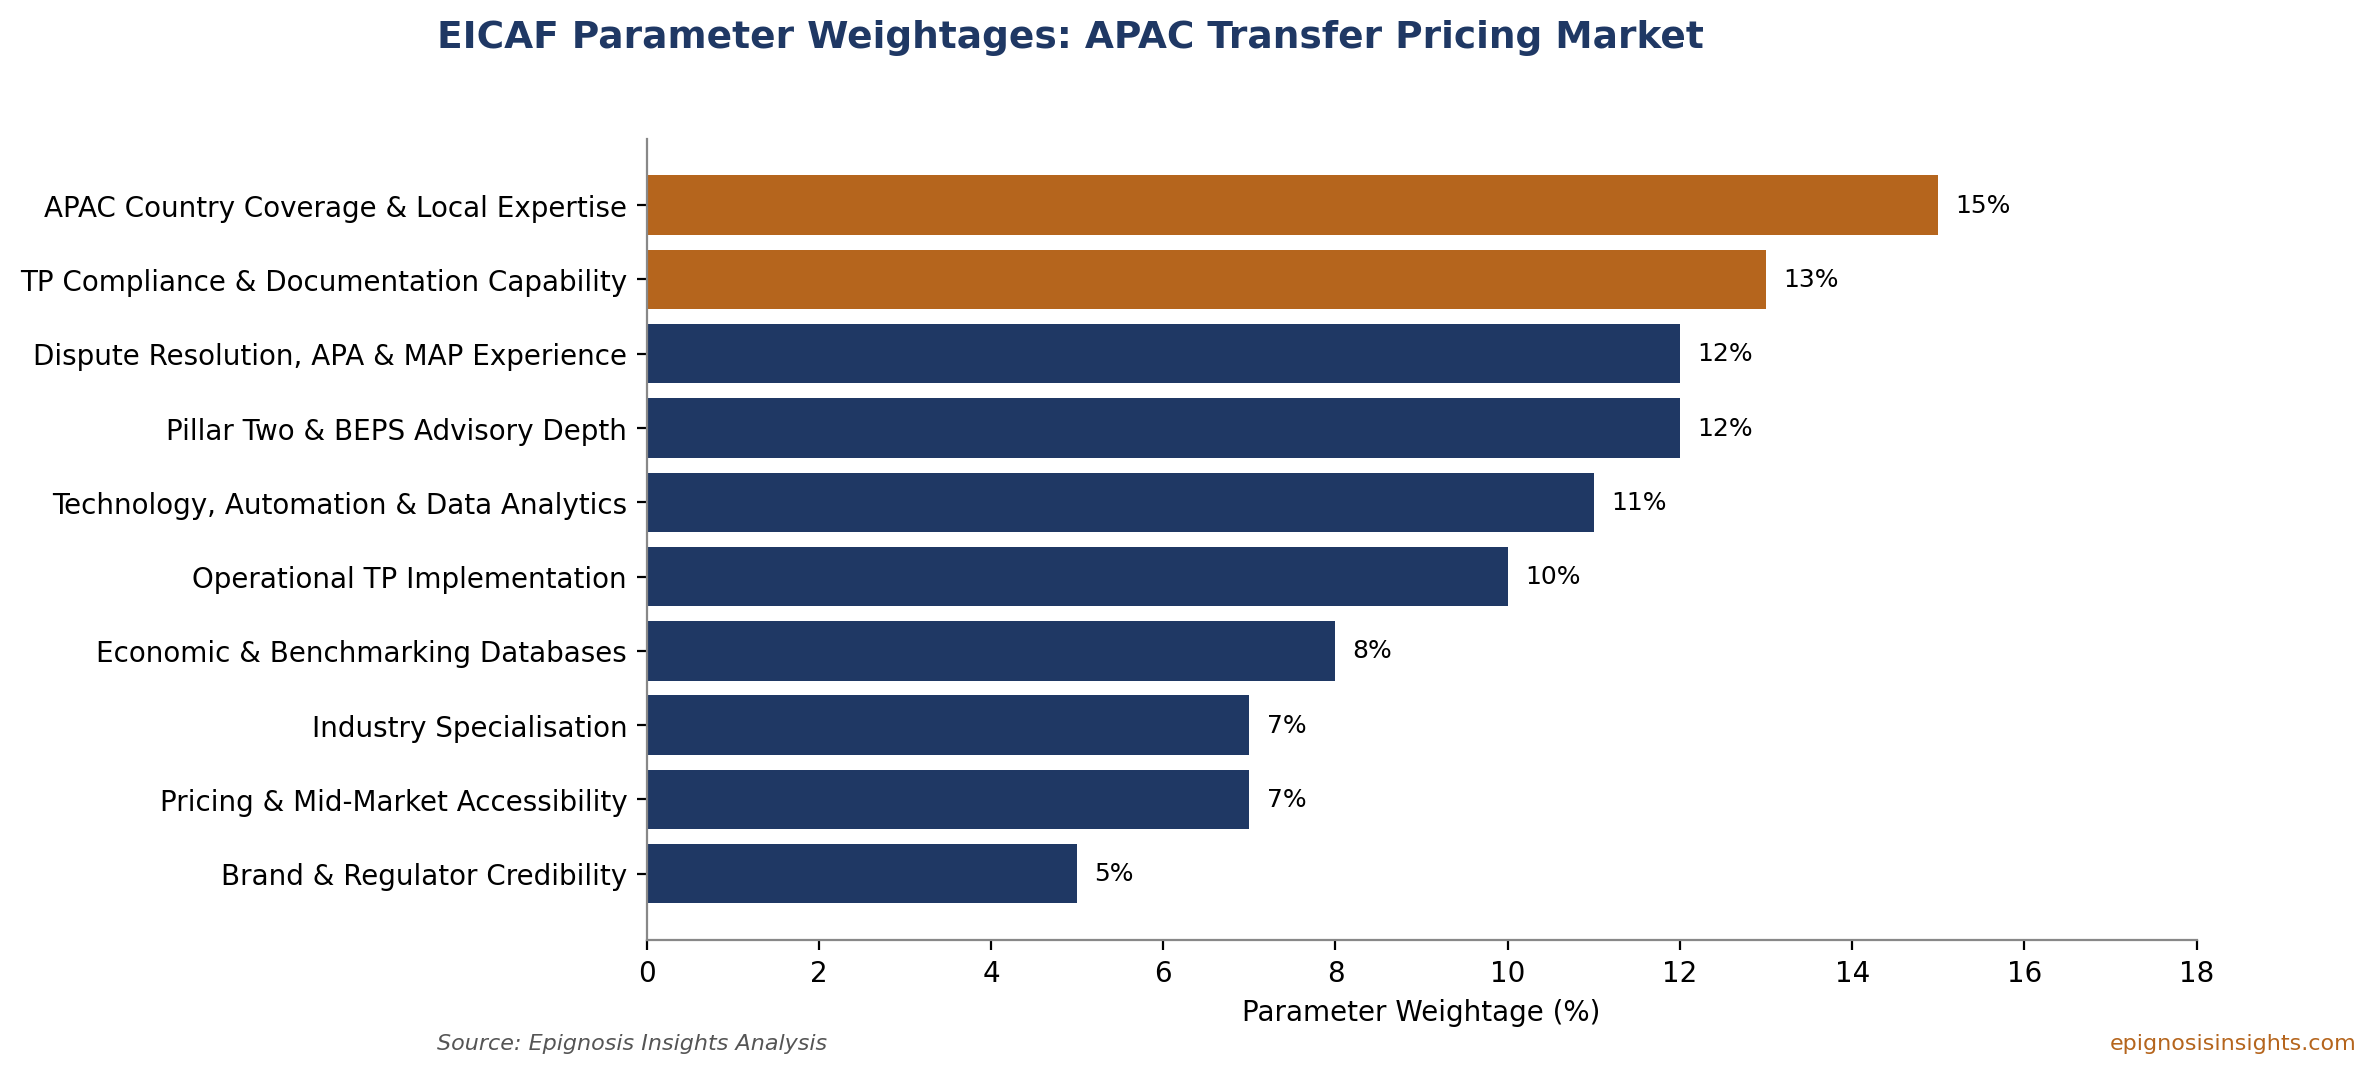
Figure 10: EICAF Parameter Weightages for the Asia Pacific Transfer Pricing Market
Each firm is assigned a score from 1 to 5 against every parameter, with the weighted score calculated as Firm Score × Parameter Weightage. The resulting EICAF score allows global networks, mid-tier firms and specialist consultancies to be compared on a consistent basis, and highlights where mid-tier and technology-enabled providers can compete effectively against larger networks, particularly in the fast-growing SME segment.