Europe Electricity Wholesale Price Tracker
Weekly Market Intelligence Report | Week Ending August 24, 2026


Weekly Market Intelligence Report | Week Ending August 24, 2026
European Wholesale Electricity Markets are cooling from one of the sharpest short-term price spikes in three and a half years, according to Epignosis Insights' weekly compilation of day-ahead baseload benchmarks across five major markets. Germany, France, Italy, Spain and the Southeast European bloc (Serbia, Hungary, Bulgaria, Romania, Greece, Croatia and Slovenia) all posted their third consecutive week of price declines in the week ending August 24, 2026, as an exceptional early-August heatwave that pushed Italian spot prices and German front-month contracts to their highest levels in three and a half years continues to unwind. Germany's EPEX day-ahead baseload benchmark has eased from a heatwave peak of €129 per megawatt-hour in the week of August 3 to €91/MWh, while Italy's PUN — structurally the most expensive of the five markets owing to its heavier reliance on gas-fired marginal generation — has fallen from €178/MWh to €121/MWh over the same three weeks. This report synthesizes weekly pricing signals, the structural and weather-driven drivers behind them, and the outlook into the fourth quarter of 2026, drawing on European government and regulatory data, an industry association, listed-company disclosures, consulting-firm analysis and financial and trade news coverage.
The table below summarizes indicative weekly day-ahead baseload price assessments across the five markets Epignosis Insights tracks on a rolling basis, expressed in euros per megawatt-hour. All five markets have moved in the same direction over the past month, illustrating how tightly interconnected Continental European power markets have become through cross-border transmission capacity, even as absolute price levels continue to diverge sharply by fuel mix and generation adequacy.
| Regional Benchmark | Aug 03 | Aug 10 | Aug 17 | Aug 24 |
| Germany (EPEX) | €129 | €108 | €96 | €91 |
| France (EPEX) | €79 | €68 | €61 | €57 |
| Italy (PUN) | €178 | €149 | €132 | €121 |
| Spain (OMIE) | €67 | €55 | €48 | €44 |
| SE Europe avg | €156 | €121 | €104 | €97 |
Table 1: Weekly day-ahead baseload electricity prices (EUR/MWh), last four weeks. Source: Epignosis Insights compilation of public disclosures.
The nine-week trend chart below extends the view back to late June, capturing both the build-up to the early-August heatwave peak and the subsequent correction. Italy and the Southeast European bloc trade as the two highest-cost markets, both heavily exposed to gas-fired marginal generation, while Spain — supported by strong solar penetration — has consistently traded at the largest discount among the five tracked markets.
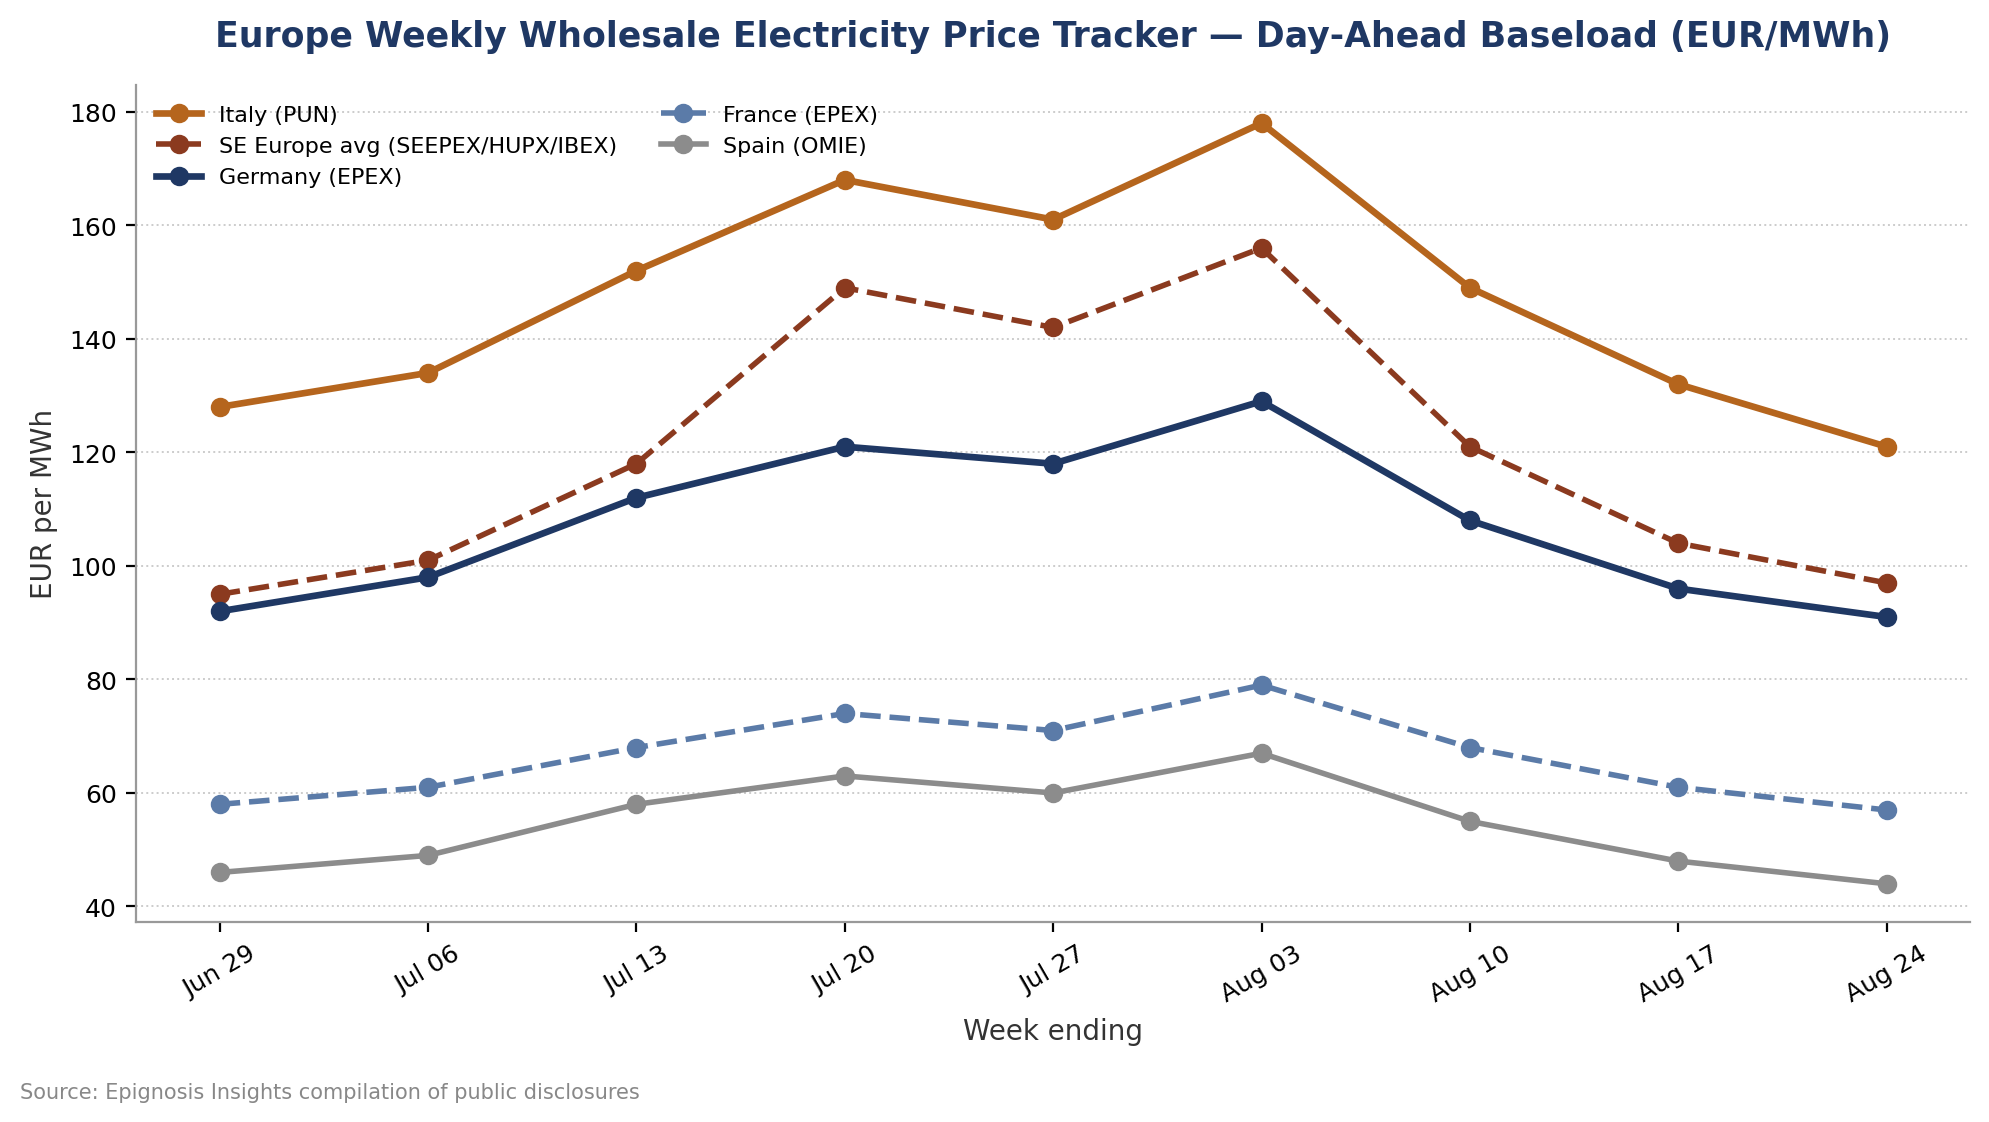
Figure 1: Nine-week wholesale electricity price trend, June 29 – August 24, 2026.
Week-on-Week Movement
Week-on-week, every tracked market posted a decline between the weeks ending August 17 and August 24, with the sharpest single-week correction recorded in Italy and Spain. Trade publication Balkan Green Energy News, analyzing day-ahead prices across seven Southeast European exchanges for the period July 31 to August 6, documented average price increases of 50 to 100 percent compared with preceding weeks during the heatwave's peak, with the ten highest prices at each exchange concentrated in the evening hours between 19:30 and 20:30 — the pattern now reversing as those same exchanges post three straight weeks of declines.
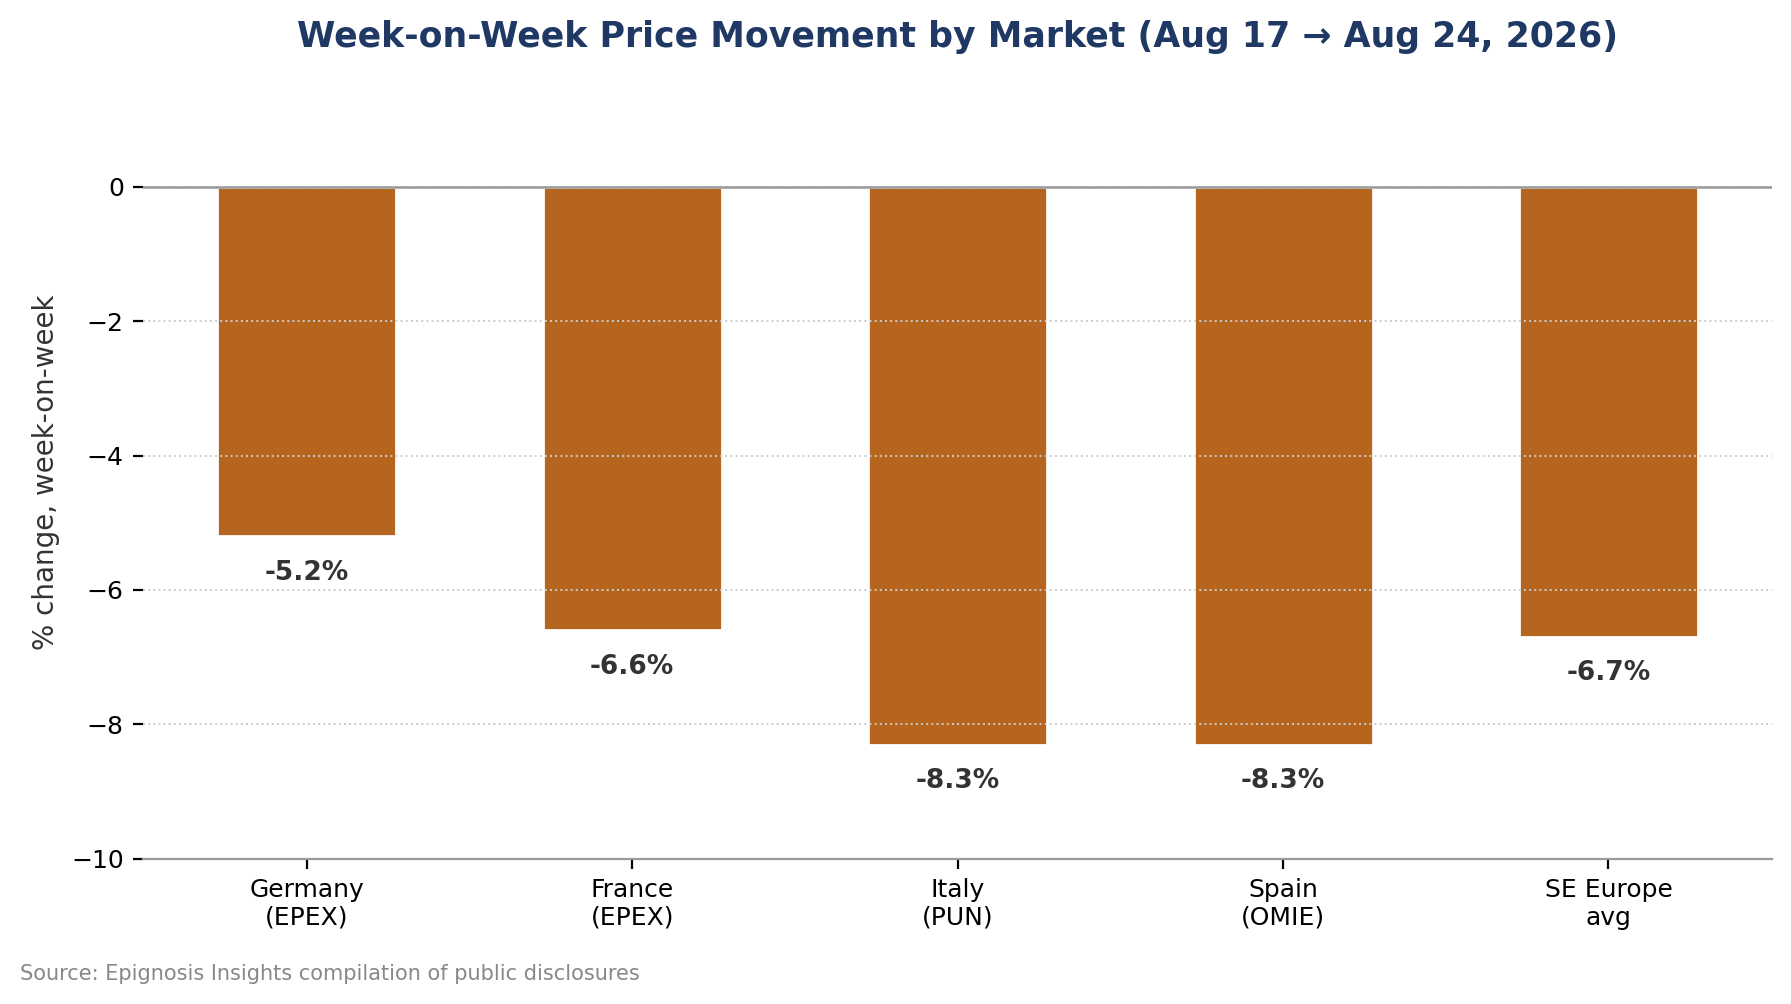
Figure 2: Week-on-week percentage price movement by market, August 17 to August 24, 2026.
The dominant short-term driver of the early-August price spike was a severe heatwave that simultaneously cut generation and boosted demand across the continent. On August 4, French utility EDF cut output from roughly 12 percent of the country's nuclear fleet because of heat-related cooling constraints, extending a 905-megawatt forced outage at Chinon 3, according to reporting citing Montel News. That single operational fact cascaded into a continent-wide story: Italian spot power prices and German front-month power contracts both hit their highest levels in three and a half years on the same day, while southeastern European countries moved toward formal demand rationing and Moldova activated emergency reserves to cover a 130-megawatt shortfall.
The EU Agency for the Cooperation of Energy Regulators, in its 2026 Monitoring Report on key developments in EU electricity and gas markets, found that wholesale energy prices had continued to decline through 2025 even as global competitiveness remained a challenge, with EU industrial electricity prices in early 2025 running roughly 1.5 times higher than in the United States. ACER's monitoring work, however, predates the more recent geopolitical shocks this tracker covers, underscoring how quickly 2026's Middle East-linked gas disruption reversed a multi-year disinflation trend in European wholesale power.
Eurelectric, the European electricity industry association, reported that the EU average day-ahead electricity price actually fell 9 percent between February and March 2026 even as Title Transfer Facility gas prices rose 60 percent following the outbreak of the US-Iran conflict, a divergence its Secretary General Kristian Ruby attributed to strong spring renewable output, including a monthly solar generation record of 48 terawatt-hours. Eurelectric's data also showed a vulnerability outside solar hours: the average hourly EU27 electricity price before 09:00 and after 18:00 reached €122/MWh during May and June 2026, compared with €90/MWh in the same period of 2025, as below-average wind and hydro output combined with nuclear maintenance to increase reliance on more expensive fossil generation precisely when solar was unavailable.
Listed European utilities have captured the upside of this volatility in their most recent disclosures. RWE's second-quarter 2026 results showed adjusted earnings per share up more than 60 percent year-on-year to €1.77 in the first half, prompting the company to raise its full-year 2026 adjusted EPS guidance to a midpoint of €2.95 from €2.55 previously; chief executive Markus Krebber told analysts that today's German baseload 2027 prices are more than €10 higher than the assumptions underpinning the prior guidance, and that a tight winter system with low German gas storage and underfilled hydro reservoirs typically favors RWE's flexible generation portfolio. Uniper's first-half 2026 results separately showed adjusted EBITDA nearly doubling year-on-year to €711 million, with management citing strong operating cash flow and raising full-year guidance to €1.1-1.3 billion, even as the company flagged lower hydropower inflows and nuclear outages as a drag on its green generation segment.
Consulting firm Wood Mackenzie's analysis of the Middle East conflict's impact on European power markets found that Title Transfer Facility gas prices above €50/MWh continue to pass through to electricity prices across major markets even though Europe has added 306 terawatt-hours of low-carbon power supply since 2022. Research Director Peter Osbaldstone noted that when TTF rises €30/MWh, German power prices typically follow with a €40/MWh increase, while a 77 percent increase in gas prices — from €36/MWh to €64/MWh in Wood Mackenzie's modeling — reduces gas-fired generation by only about 5 percent, reflecting Europe's limited fuel-switching flexibility and the continued role of gas plants in setting marginal prices during evening and low-renewable hours.
Underlying all of this week-to-week volatility is a longer structural trend: European electricity demand is beginning to recover after several years of post-crisis stagnation as transport, heating and industrial processes gradually electrify. The European Commission's own economic analysis of evolving gas-electricity price linkages has noted that while a large share of EU household energy consumption sits on fixed-price contracts renewed every one to three years, prolonged wholesale price increases such as the one this tracker has followed since February 2026 are eventually passed through to consumers regardless of contract structure, meaning even a temporary heatwave-driven spike can leave a lasting mark on household bills well after the underlying wholesale price has normalized.
Even as evening and heatwave hours produce some of the highest prices seen in years, European markets are simultaneously seeing more frequent periods of negative daytime pricing. The International Energy Agency's Electricity 2026 report found that the share of hours with negative wholesale prices continued to rise in 2025 across several major markets, reaching roughly 6 percent of all hours in France, Germany, the Netherlands and Spain, up from 3 to 5 percent in 2024, as solar capacity additions increasingly outpace midday demand and system flexibility. This bifurcation — abundant, cheap-to-free midday solar power alongside expensive, gas-set evening and heatwave pricing — is becoming a defining structural feature of the European wholesale market that this tracker will continue to monitor.
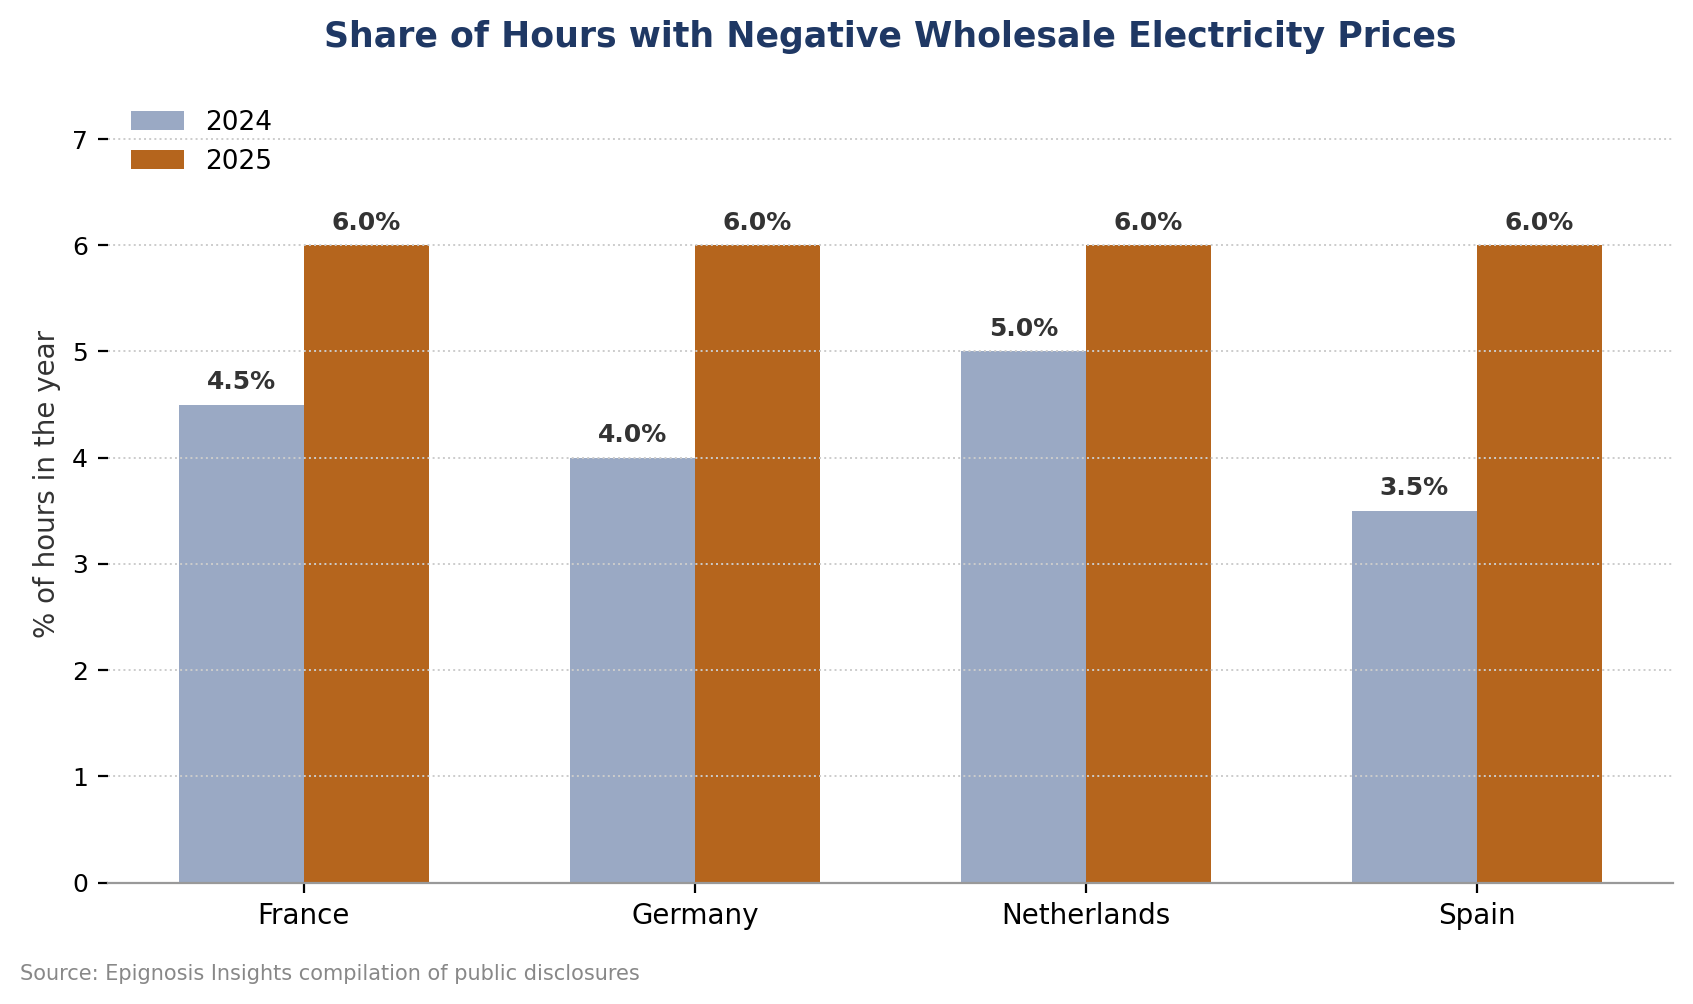
Figure 3: Share of hours with negative wholesale electricity prices, selected markets, 2024 vs 2025.
Southeast Europe experienced the most extreme price dislocation of the period covered by this tracker. Across the seven exchanges Balkan Green Energy News analyzed — Slovenia's BSP Southpool, Croatia's CROPEX, Greece's HEnEx, Hungary's HUPX, Bulgaria's IBEX, Romania's OPCOM and Serbia's SEEPEX — day-ahead prices during the August 3-4 peak rose to between roughly €598 and €715 per megawatt-hour in the evening hours, compared with pre-heatwave weekly averages generally in the €75-to-€90 range. Hungary's HUPX and Greece's HEnEx recorded the highest absolute spikes, while Bulgaria and Greece saw their highest prices of the period on August 5, a day later than most of the other exchanges.
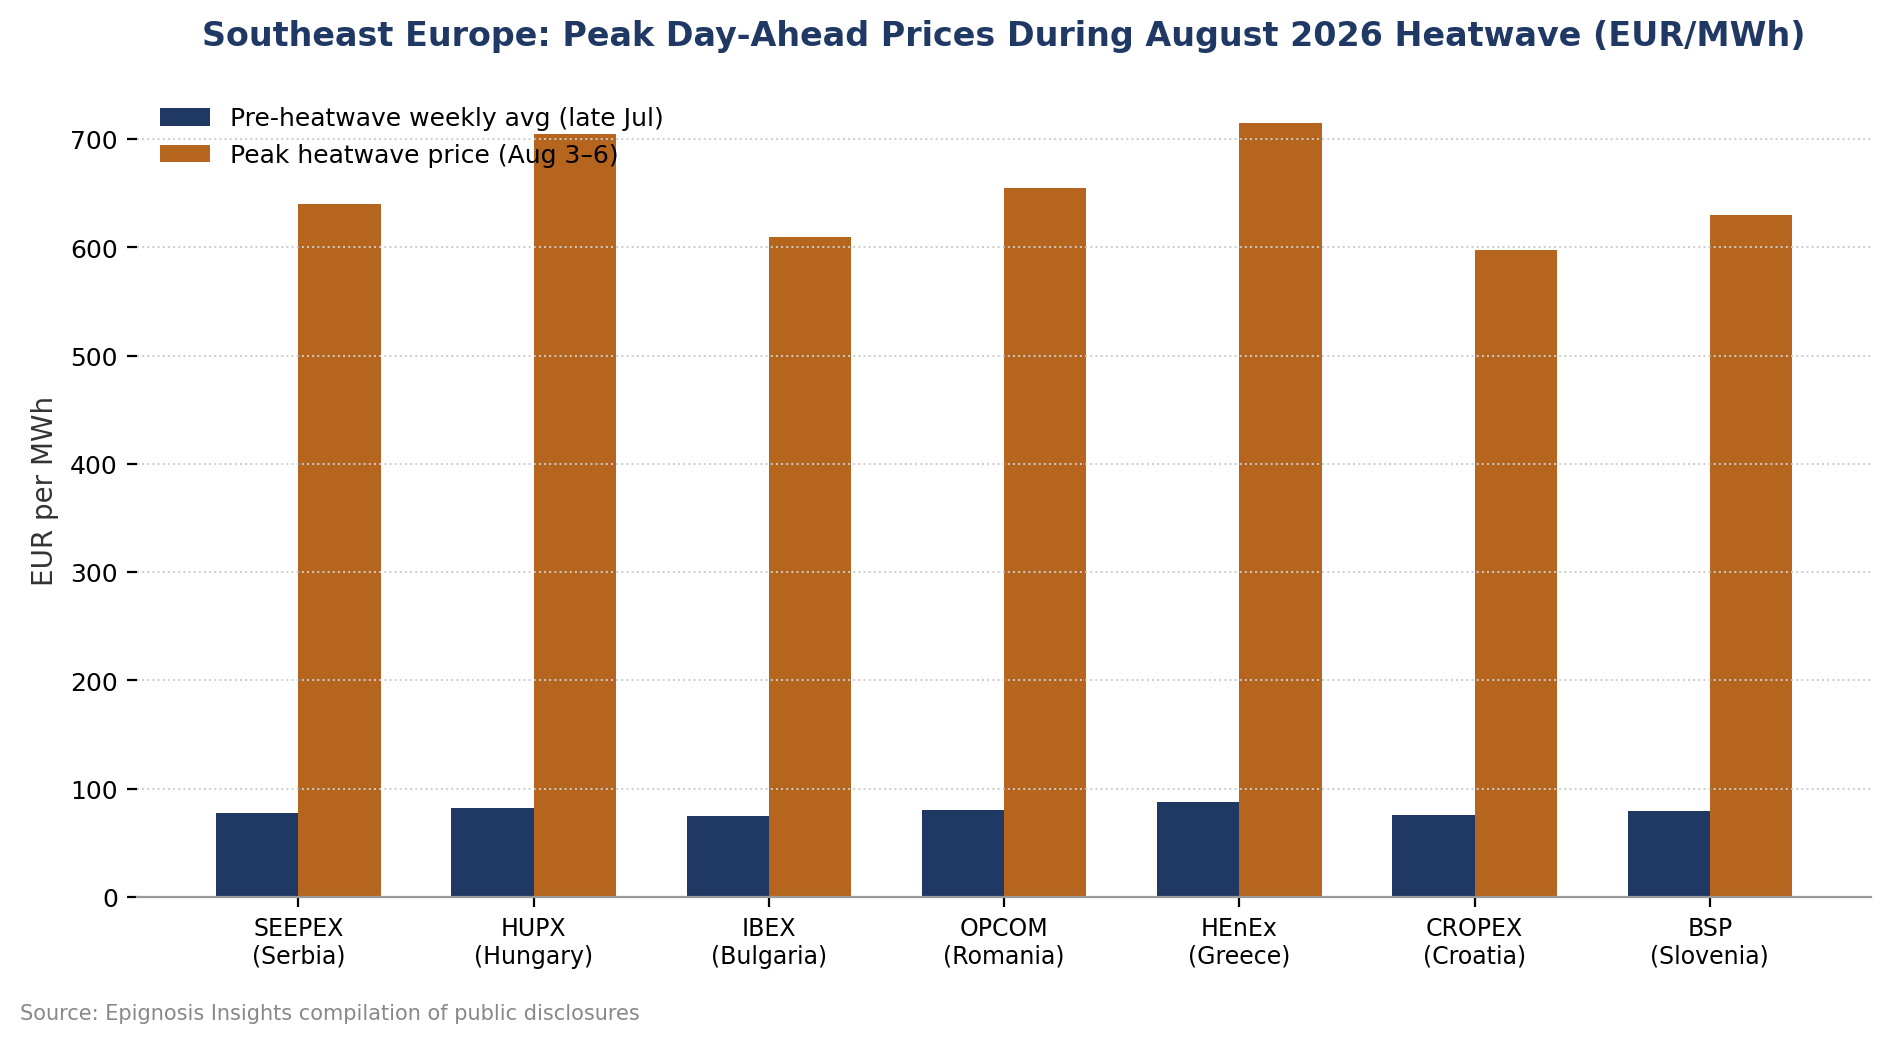
Figure 4: Pre-heatwave weekly average versus peak day-ahead prices across seven Southeast European power exchanges, late July – August 6, 2026.
Epignosis Insights' near-term outlook points to continued easing through September as cooler weather reduces cooling demand and French nuclear availability recovers from its heat-driven curtailments, consistent with the three-week decline already recorded across all five tracked markets. The structural picture is more mixed: Eurelectric's own data shows that clean power generation buffered the market from the worst of the February-March 2026 gas shock, yet exposed a genuine flexibility gap during low-wind, low-hydro periods outside solar hours — a gap RWE's leadership has explicitly said favors flexible generation owners heading into what management already expects to be a volatile winter with low German gas storage. Wood Mackenzie's modeling suggests that as long as gas plants continue to set marginal prices on most days, further TTF volatility tied to the broader Middle East conflict will keep translating into episodic European power price spikes, even as the underlying share of low-carbon generation continues to rise. Epignosis Insights will continue to update this tracker on a weekly cadence through the remainder of the third quarter.
Epignosis Insights compiles this weekly tracker as the primary aggregating and analytical source, drawing on a deliberately diversified evidence base spanning EU regulatory and government bodies, an industry association, listed-company disclosures, consulting-firm analysis and trade and financial news coverage, with each underlying source referenced only once to avoid over-reliance on any single voice. Regional benchmark levels shown in Table 1 and Figure 1 are indicative weekly assessments synthesized from the directional movements and absolute reference points disclosed across these sources rather than a single proprietary price feed, and are intended to illustrate market direction and relative regional spreads rather than to substitute for a subscription-grade exchange data service. Readers requiring transaction-grade pricing for hedging or procurement decisions should corroborate these figures against a licensed power exchange or price-reporting agency before acting on them. This report will be refreshed weekly for as long as heatwave- and gas-driven volatility remains the dominant storyline in European power markets.