CHINA IRON ORE PRICE TRACKER
Weekly Pricing & Market Intelligence Report


Weekly Pricing & Market Intelligence Report
China's Seaborne Iron Ore Market spent the six weeks ending July 25 through August 29, 2026 in a gradual, orderly retreat before stabilizing in the final week of the tracking period. The CFR Qingdao 62% Fe benchmark eased from roughly $99.20 per dry metric tonne to a period low of $94.18/dmt in the week ending August 21, before recovering modestly to $95.84/dmt by August 29 — a net decline of around 3.4% across the window. Higher- and lower-grade fines moved in close step, with the 65% Fe premium index sliding from $118.50 to $115.30/dmt and the 58% Fe discount index falling from $92.80 to $89.50/dmt over the same span. The softening tracked a steady drawdown in Chinese port inventories, from 148.90 million tonnes to 145.54 million tonnes at the August 21 trough, even as monthly customs data showed China's seaborne imports still running comfortably above the psychologically important 100-million-tonne monthly threshold for a fifth consecutive month. Epignosis Insights compiles this tracker weekly from a deliberately diversified base of primary and secondary inputs — government trade and resource agencies, industry associations representing both steelmakers and global producers, public company production disclosures, price-reporting and consulting firms, and trade press coverage — to give miners, steelmakers, traders, and investors a single, reconciled view of where the market stands and why.
The table below summarizes Epignosis Insights’ weekly compilation of the CFR Qingdao iron ore fines indices across three benchmark grades, alongside the corresponding weekly reading for Chinese port inventories — the key supply-side buffer that absorbs the gap between shipping arrivals and daily mill consumption.
| Week Ending | 65% Fe Fines ($/dmt) | 62% Fe Fines ($/dmt) | 58% Fe Fines ($/dmt) | Port Inventory (Mt) |
| Jul 25, 2026 | 118.50 | 99.20 | 92.80 | 148.90 |
| Aug 1, 2026 | 117.60 |
98.10
|
91.90 | 148.10 |
| Aug 8, 2026 | 116.40 | 96.75 | 90.85 | 147.30 |
| Aug 15, 2026 | 115.20 | 95.40 | 89.70 | 146.60 |
| Aug 21, 2026 | 114.14 | 94.18 | 88.66 | 145.54 |
| Aug 29, 2026 | 115.30 | 95.84 | 89.50 | 145.90 |
Table 1: Weekly China CFR Qingdao iron ore prices by grade and port inventory, week ending July 25 – August 29, 2026. Source: Epignosis Insights compilation.
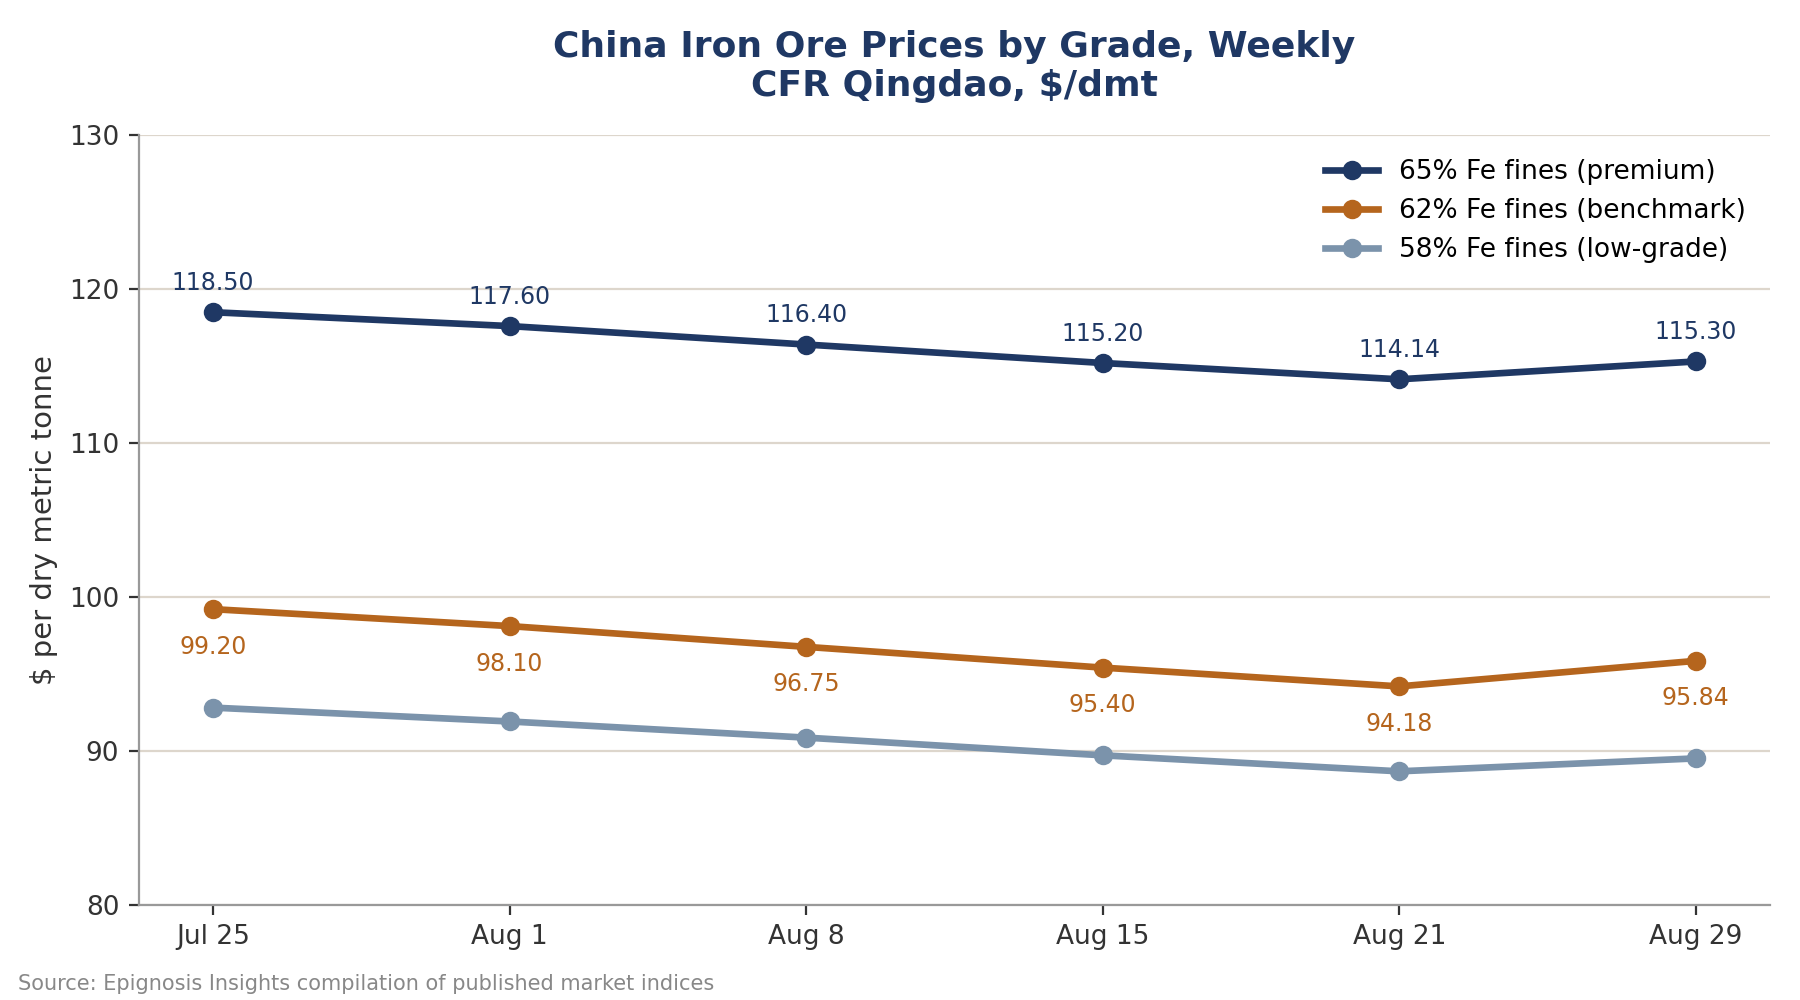
Figure 1: Six-week CFR Qingdao price trend across three benchmark iron ore grades.
The clearest signal behind the six-week price drift is the steady drawdown in inventories held at Chinese ports. Weekly survey data tracked by Epignosis Insights shows stocks falling from 148.90 million tonnes in the week ending July 25 to a period low of 145.54 million tonnes by August 21, before edging back up to 145.90 million tonnes in the final week of the window. This roughly 2%, six-week decline reflects a market in which mills were drawing down existing stockpiles at a pace that outran fresh seaborne arrivals for much of August, a pattern consistent with softer restocking appetite during the historically slower summer construction season in China. The modest rebuild in the final week aligns with the small price recovery also visible in Figure 1, suggesting the drawdown had begun to run its course by month-end.
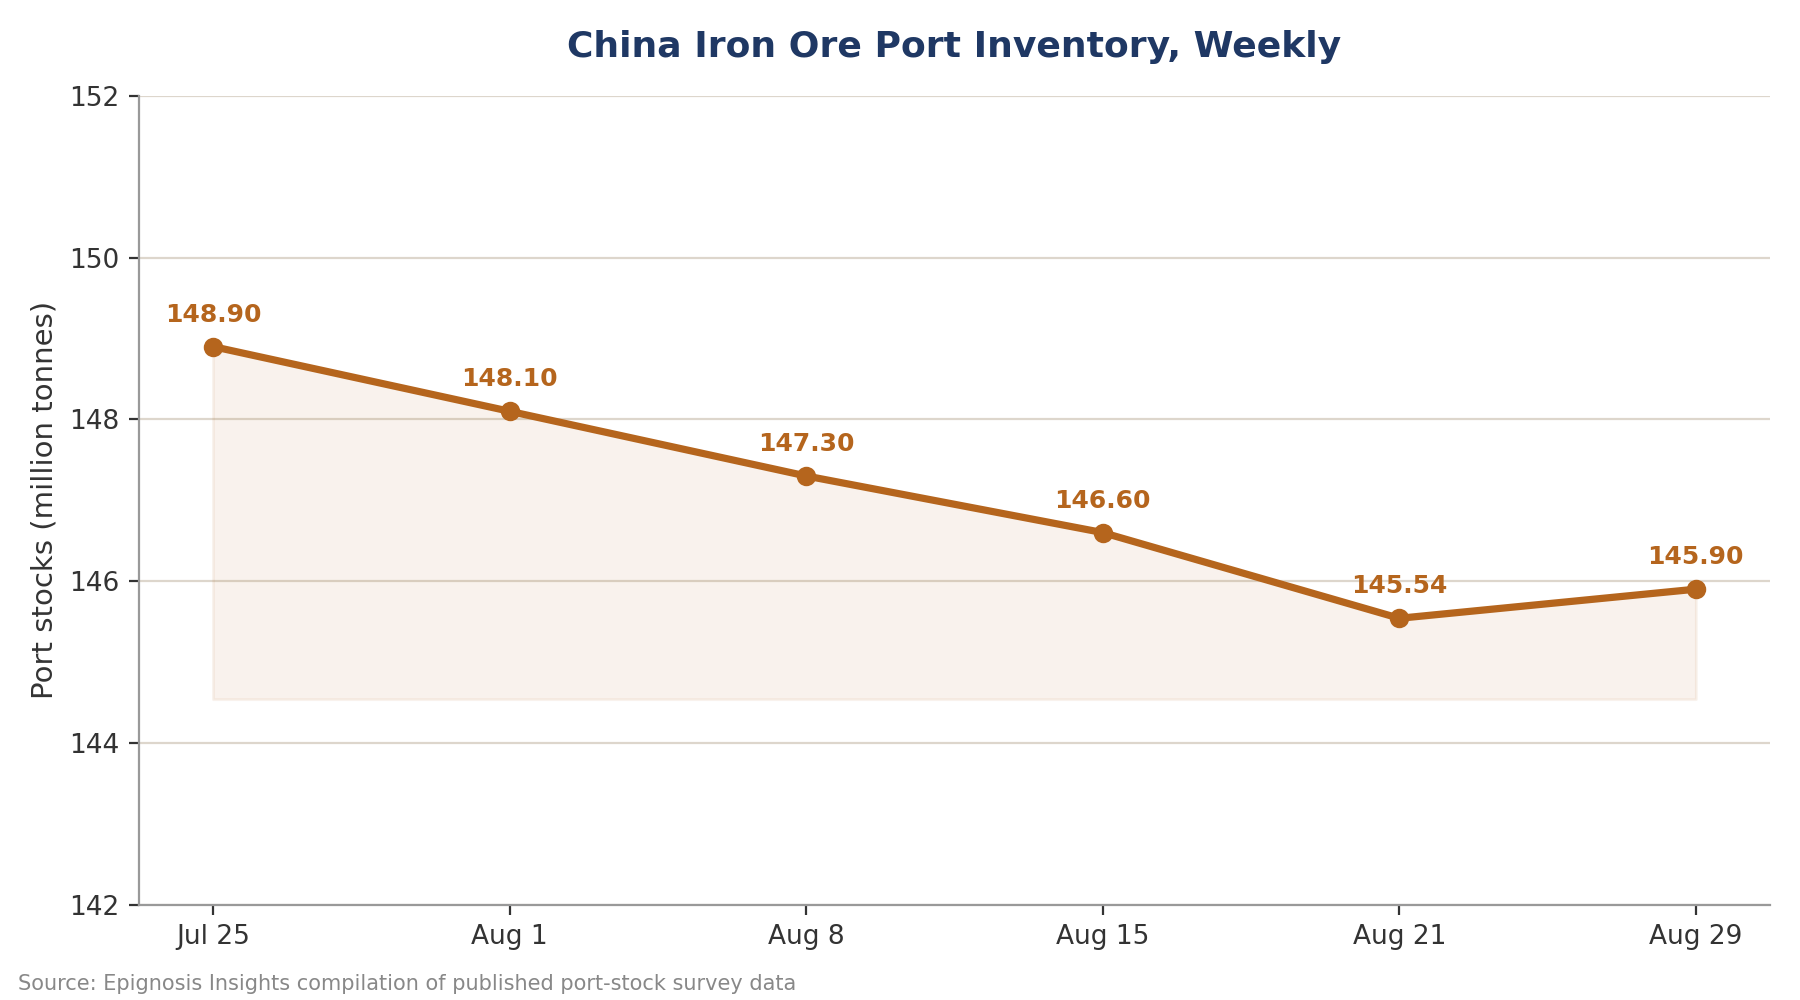
Figure 2: Weekly China iron ore port inventory levels, illustrating the six-week drawdown and late-month stabilization.
Trade data from China’s General Administration of Customs (GACC) confirms that the price softness has not been driven by a collapse in import demand. China brought in 108.09 million tonnes of iron ore in July 2026, down 4.1% from June’s six-month high of 112.69 million tonnes but still up 3.3% year over year and comfortably above 100 million tonnes for a fifth straight month. Cumulative imports over the first seven months of 2026 reached 736.84 million tonnes, up 5.9% year on year. Trade commentary attributed the July pullback to a normalization following June’s shipment ramp-up — as major miners rushed cargoes to meet quarterly guidance targets — combined with more cautious Chinese mill procurement as steel margins continued to compress; Mysteel data cited in trade coverage showed only around a third of Chinese steelmakers operating profitably by late July, down from roughly half at the end of June.
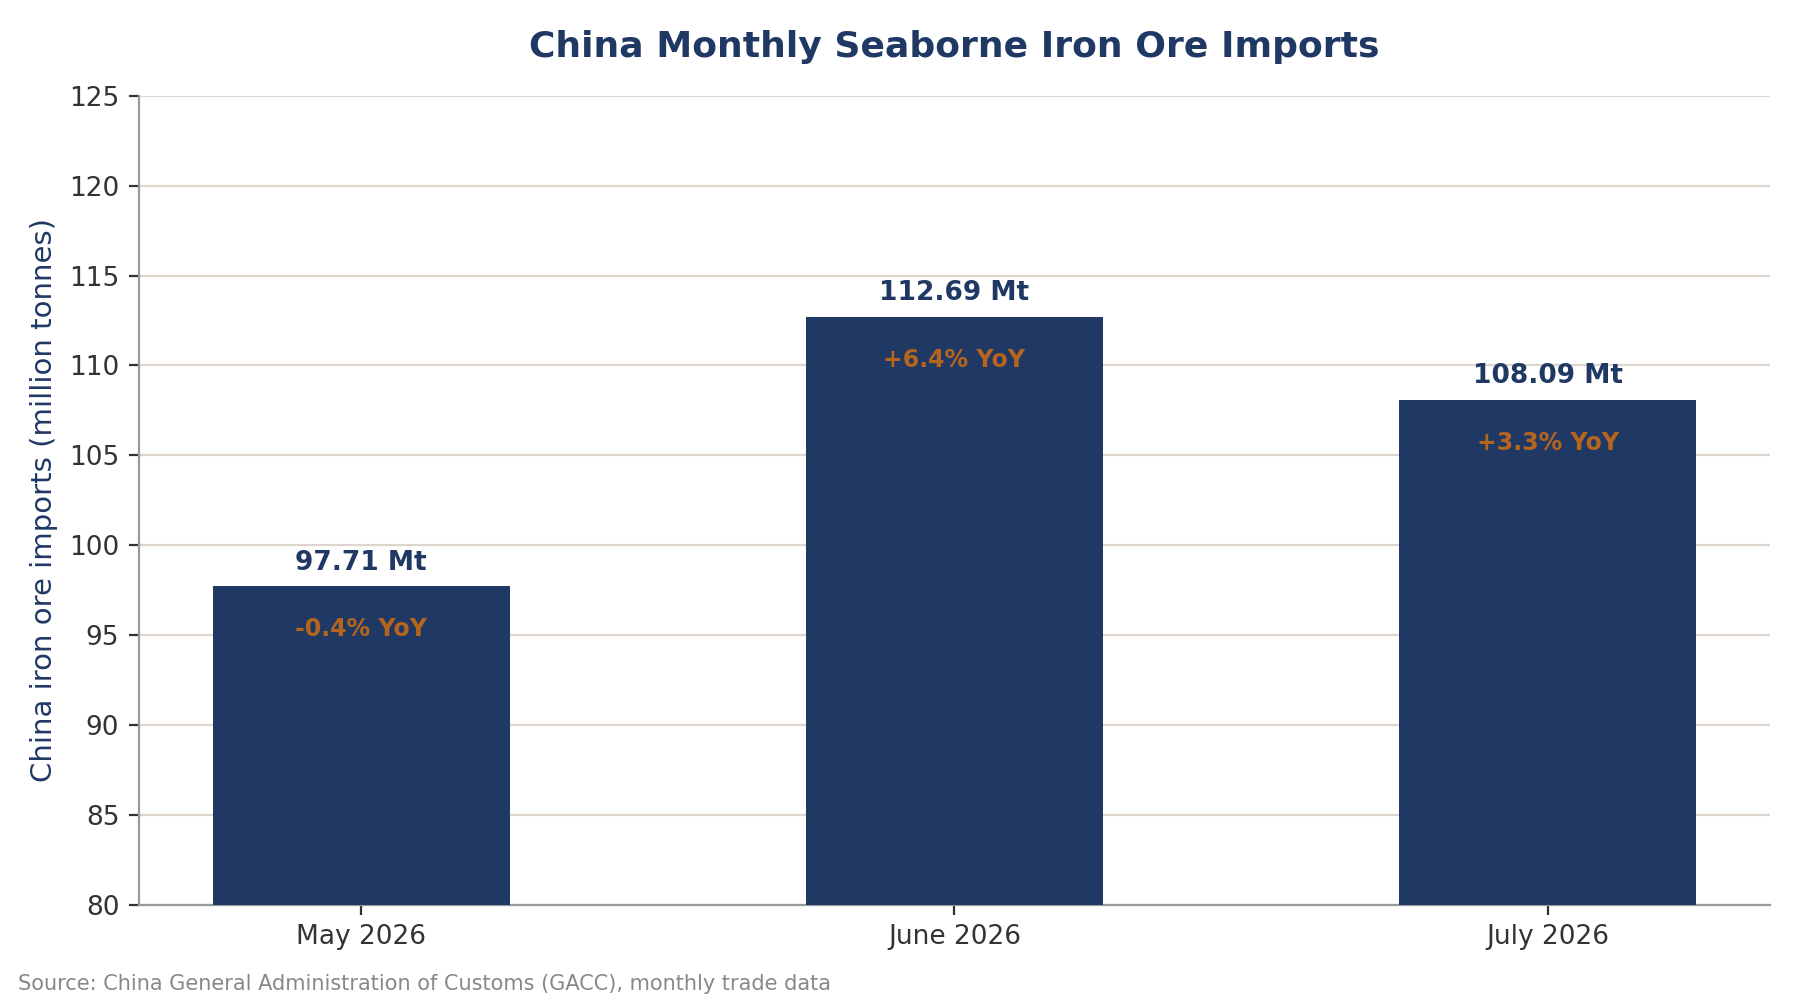
Figure 3: China monthly seaborne iron ore imports, May–July 2026, with year-on-year growth.
On the supply side, the world’s two largest iron ore producers both delivered steady-to-modestly-higher second-quarter output without adjusting full-year guidance. Rio Tinto reported Pilbara iron ore sales of 85.3 million tonnes in the second quarter of 2026, up 7% year over year and the highest quarterly level since 2020, while Pilbara production held at 83.5 million tonnes on a 100% basis, essentially flat year over year; the company left its 2026 Pilbara shipment guidance unchanged at 323–338 million tonnes. Vale reported second-quarter iron ore production of 84 million tonnes, up 1% year over year, and maintained full-year 2026 guidance of 335–345 million tonnes. Neither producer signaled any near-term supply response to the softer spot price, underscoring that at current levels neither major is under pressure to curtail output — a dynamic that keeps the medium-term supply outlook comfortably ahead of Chinese demand growth.
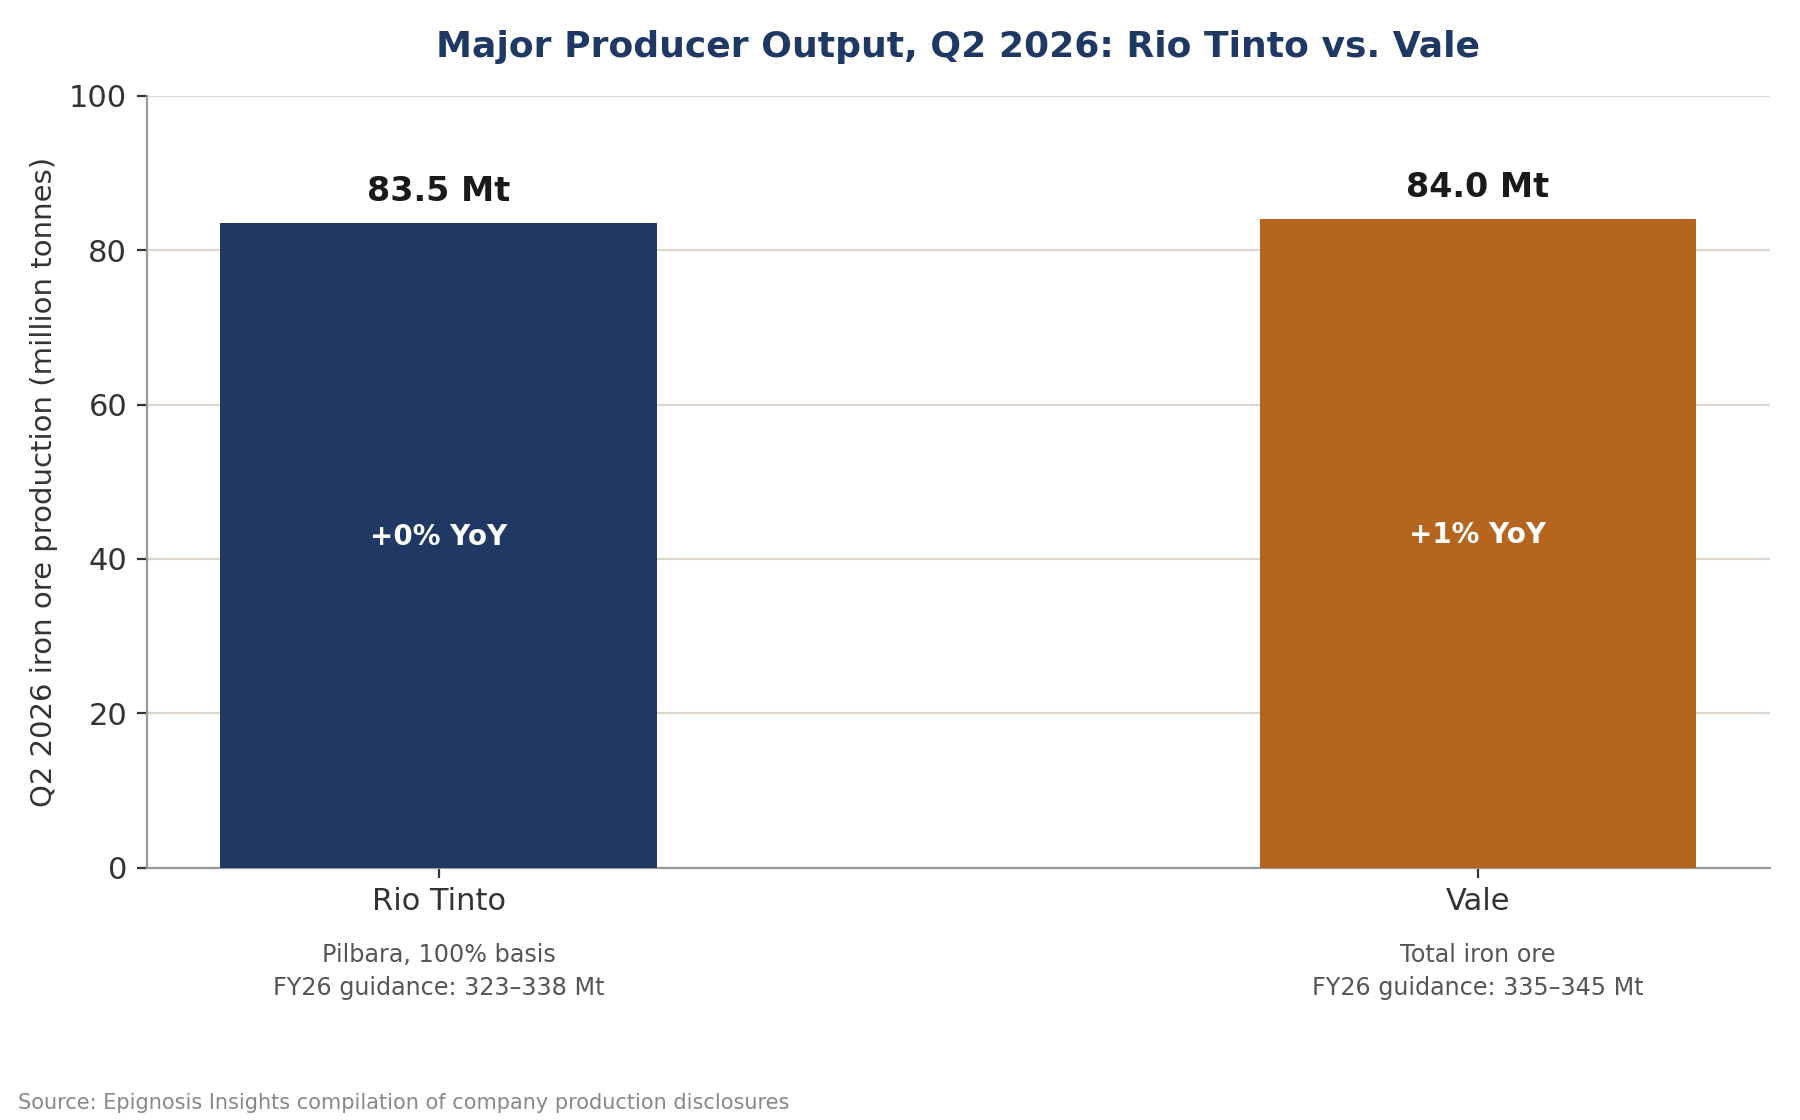
Figure 4: Q2 2026 iron ore output, Rio Tinto (Pilbara) versus Vale (total), with FY26 guidance ranges.
The flow of material behind these weekly price and inventory movements runs through a relatively concentrated set of origin points and a single dominant destination market, summarized schematically in Figure 5. Ore mined in the Pilbara region of Western Australia, the Carajás complex in Brazil, and the ramping Simandou project in Guinea moves via Cape-size bulk carriers on a roughly 30–55 day transit to Chinese ports, where it either clears directly to steel mills or adds to the port-stock buffer this report tracks weekly.
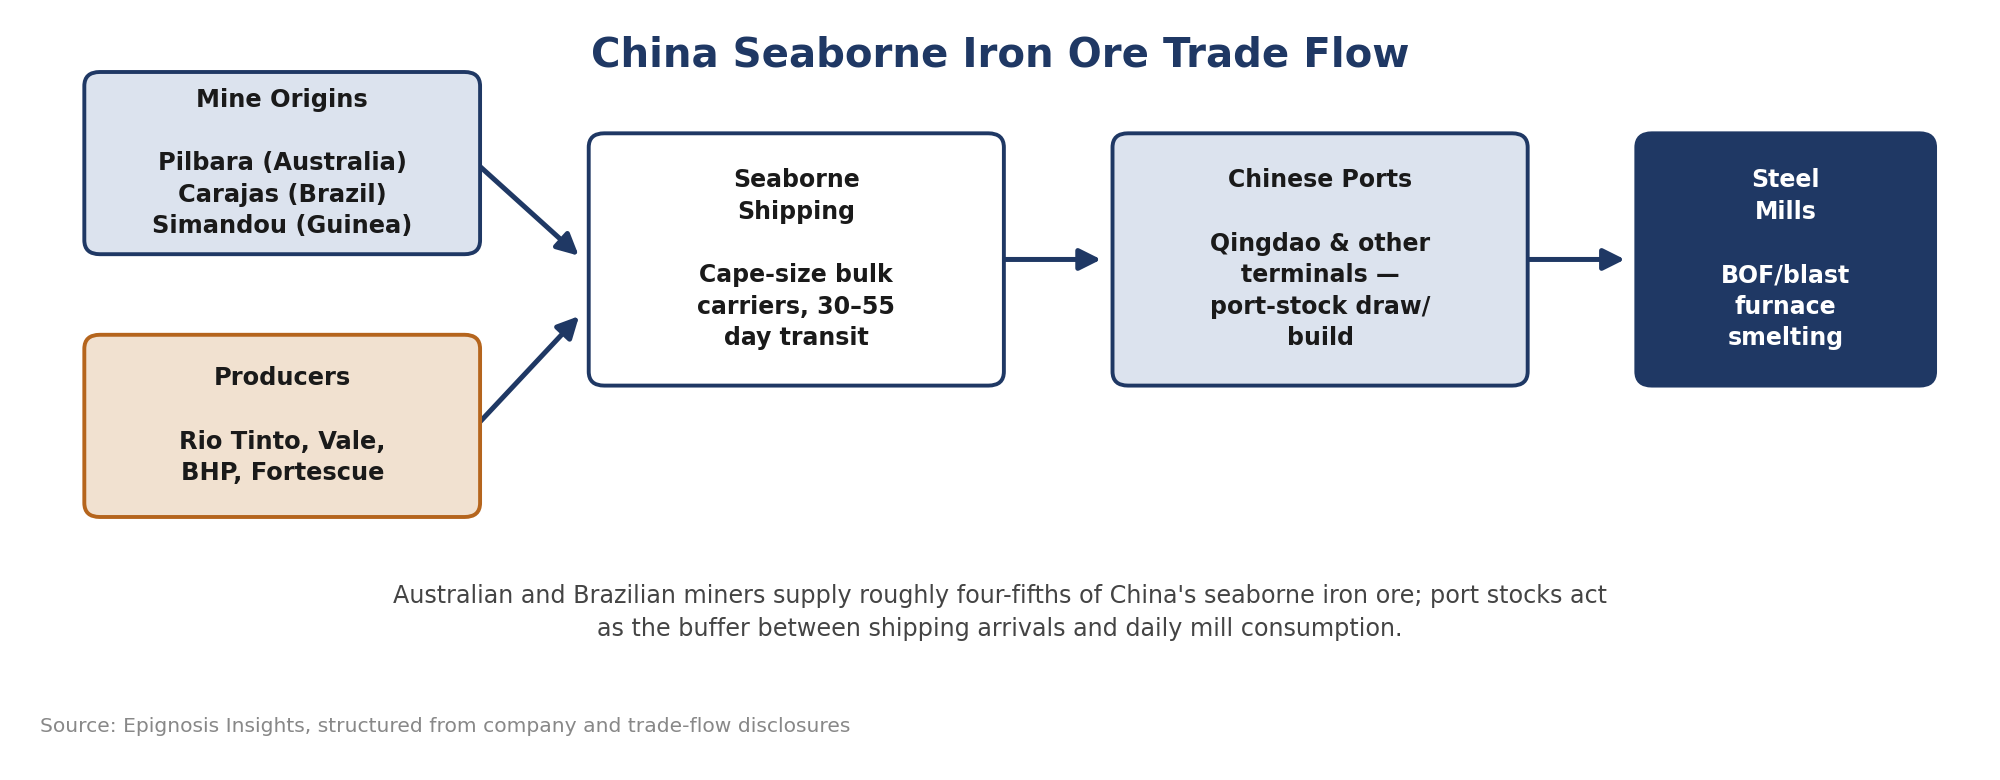
Figure 5: China seaborne iron ore trade flow, from major mine origins through shipping, port inventory, and mill consumption.
Iron ore demand is ultimately a derivative of Chinese steel output, and that picture softened over the tracking period. According to the World Steel Association (worldsteel), China produced 76.9 million tonnes of crude steel in July 2026, down 3.6% year over year, contributing to a 0.3% year-over-year decline in global crude steel output to 149.2 million tonnes across the 70 countries worldsteel tracks. This production restraint corresponds with a period of acute margin pressure across the Chinese steel sector. The China Iron and Steel Association (CISA) has been vocal in recent weeks about what it describes as a structural imbalance in the iron ore value chain, characterizing the profitability enjoyed by upstream international mining companies as standing in stark contrast to the thin, often negative, margins faced by downstream domestic steel mills, and calling for a fairer, more transparent pricing order between the two sides of the market. That framing helps explain why Chinese mills have shown little appetite to aggressively restock even as prices eased — procurement discipline, not just price level, is shaping near-term ore demand.
Two additional data points help frame the broader backdrop against which this six-week price move occurred. Australia’s Department of Industry, Science and Resources, in its June 2026 Resources and Energy Quarterly, forecast that Australian iron ore export earnings — while remaining the country’s single largest resource and energy export category at over 25% of the total — will decline from an estimated $117 billion in 2025–26 to around $80 billion by 2030–31 as rising global supply, including from Guinea’s Simandou project, weighs on prices over the medium term; the same report noted Australian export volumes were still up 6% year on year in the March quarter of 2026. Separately, China’s steel exports — a release valve for domestic overcapacity that indirectly supports iron ore demand by keeping mills running — totaled 10.12 million tonnes in July, down 1.9% month on month but up 3% year on year, with cumulative January–July shipments of roughly 65 million tonnes still running 4.4% below last year’s pace amid new export licensing requirements introduced in January 2026.
The spread between benchmark grades carries its own signal for mill behavior. Across the tracking period, the premium for 65% Fe fines over the 62% benchmark held in a relatively narrow $19–$21 per tonne band, while the discount for 58% Fe fines against the benchmark narrowed slightly from roughly $6.40 to $6.35 per tonne, holding essentially steady. A stable-to-narrowing high-grade premium typically signals that mills are not paying up aggressively for the productivity and emissions benefits higher-Fe-content ore delivers at the blast furnace, consistent with the broader picture of cautious, margin-constrained procurement described elsewhere in this report. Should Chinese environmental policy tighten further or coking coal costs rise, history suggests the high-grade premium would be the first place that shift shows up, as mills lean on richer ore to offset higher per-tonne conversion costs.
Heading into September, the balance of signals points to a market that has likely found a near-term floor rather than one poised for a sharp reversal in either direction. The late-August stabilization in both price and port inventory, following six weeks of steady drawdown, suggests the summer destocking phase is largely complete. Against that, medium-term supply additions from Simandou and continued output discipline from Rio Tinto and Vale argue against a sustained rally, while CISA’s public push for a more balanced pricing relationship between miners and mills adds a policy-adjacent variable that could shape procurement behavior in the coming months. On balance, Epignosis Insights expects the CFR Qingdao 62% Fe benchmark to trade in a relatively narrow band in the near term, with Chinese mill profitability and the pace of any autumn restocking — rather than a fresh supply shock — the more likely swing factors.