Airbnb: Consumer Perception, Awareness & NPS Deep-Dive
Epignosis Insights Research Desk — Monthly Report, August 2026


Epignosis Insights Research Desk — Monthly Report, August 2026
Airbnb enters the second half of 2026 with one of the strongest brand health profiles in the global travel category, according to the latest wave of the Epignosis Insights BrandPulse™ Travel Tracker. The brand records a Net Promoter Score of +58, leads the alternative-accommodation category on unaided top-of-mind awareness at 34%, and converts a near-universal 97% aided awareness into a healthy 71% category consideration rate. Consumer perception is anchored by category-leading scores for uniqueness and local experience, though the tracker also identifies customer service and value-for-money as comparative soft spots that warrant management attention. These brand-health signals sit alongside genuinely strong underlying business performance: Airbnb reported Q2 2026 revenue of $3.6 billion, up 17% year-on-year, and gross booking value of $27.2 billion, up 16%, indicating that consumer perception and commercial momentum are currently reinforcing one another. This report presents the full BrandPulse™ findings across awareness, perception, NPS, and competitive benchmarking, together with a detailed methodology statement and five one-line FAQs.
All consumer perception, awareness, and NPS findings in this report are drawn exclusively from the Epignosis Insights BrandPulse™ Travel Tracker, a continuous, proprietary brand-health tracking study fielded and analyzed entirely by Epignosis Insights. No third-party syndicated data sources are used in this report; all figures represent original Epignosis Insights fieldwork unless otherwise stated in the Business Performance section, which references Airbnb's own publicly disclosed financial results.
The BrandPulse™ Travel Tracker is a quantitative online survey administered to n=4,000 adults aged 18-65 who reported taking at least one leisure or business trip in the preceding 12 months. Respondents are drawn from Epignosis Insights' proprietary Global Travel Consumer Panel, supplemented by certified third-party panel partners to reach hard-to-source segments, with all panel sources subject to double opt-in verification and standard data-quality screening, including speeding, straight-lining, and open-end response checks.
Wave 14 fieldwork covered five markets: the United States, United Kingdom, Germany, Australia, and India, selected to represent Airbnb's largest guest and host markets by booking volume. Within each market, quotas were set on age, gender, and region to align with national census distributions, with a minimum of n=700 completed interviews per market to support reliable in-market analysis. Data were weighted post-fieldwork by age, gender, and region to correct for any residual quota deviation.
Wave 14 fieldwork was conducted from June 22 to July 20, 2026. The BrandPulse™ Travel Tracker runs on a continuous monthly wave cadence, allowing Epignosis Insights to report both point-in-time brand health scores and rolling trend lines; this report reflects the most recently completed wave at time of publication.
The core questionnaire captures unaided (top-of-mind) brand awareness within the alternative-accommodation category, aided (total) brand awareness, category consideration, preference or share of choice among considerers, Net Promoter Score using the standard 0-10 likelihood-to-recommend scale, and a six-attribute brand perception battery covering trust, value for money, uniqueness and local experience, safety and host reliability, innovation, and customer service, each scored on a 100-point index derived from a 5-point agreement scale. Competitive benchmarking questions are asked using an identical script for Airbnb, Booking.com, Vrbo, and traditional hotel chains to ensure comparability.
At the total sample level (n=4,000), the survey carries a margin of error of approximately ±1.5 percentage points at the 95% confidence level; individual market-level cuts (n=700-900) carry a margin of error of approximately ±3.3 to ±3.7 percentage points. All wave-on-wave and market comparisons referenced as directional in this report are significant at the 95% confidence level using a two-tailed z-test for proportions.
Airbnb leads the alternative-accommodation category on unaided, top-of-mind brand awareness at 34%, the highest of any brand tested in the Wave 14 questionnaire, ahead of Booking.com at 29%, traditional hotel chains at 21%, and Vrbo at 12%. This unaided lead converts efficiently down the funnel: aided awareness reaches 97% of the total sample, category consideration sits at 71%, and preference, measured as share of choice among respondents who actively considered Airbnb, lands at 42%. The gap between Airbnb's near-universal aided awareness and its more moderate 34% unaided score suggests an opportunity: a meaningful share of consumers recognize the brand when prompted but do not spontaneously name it first when thinking about accommodation options, pointing to a salience-building rather than an awareness-building opportunity for future brand campaigns.
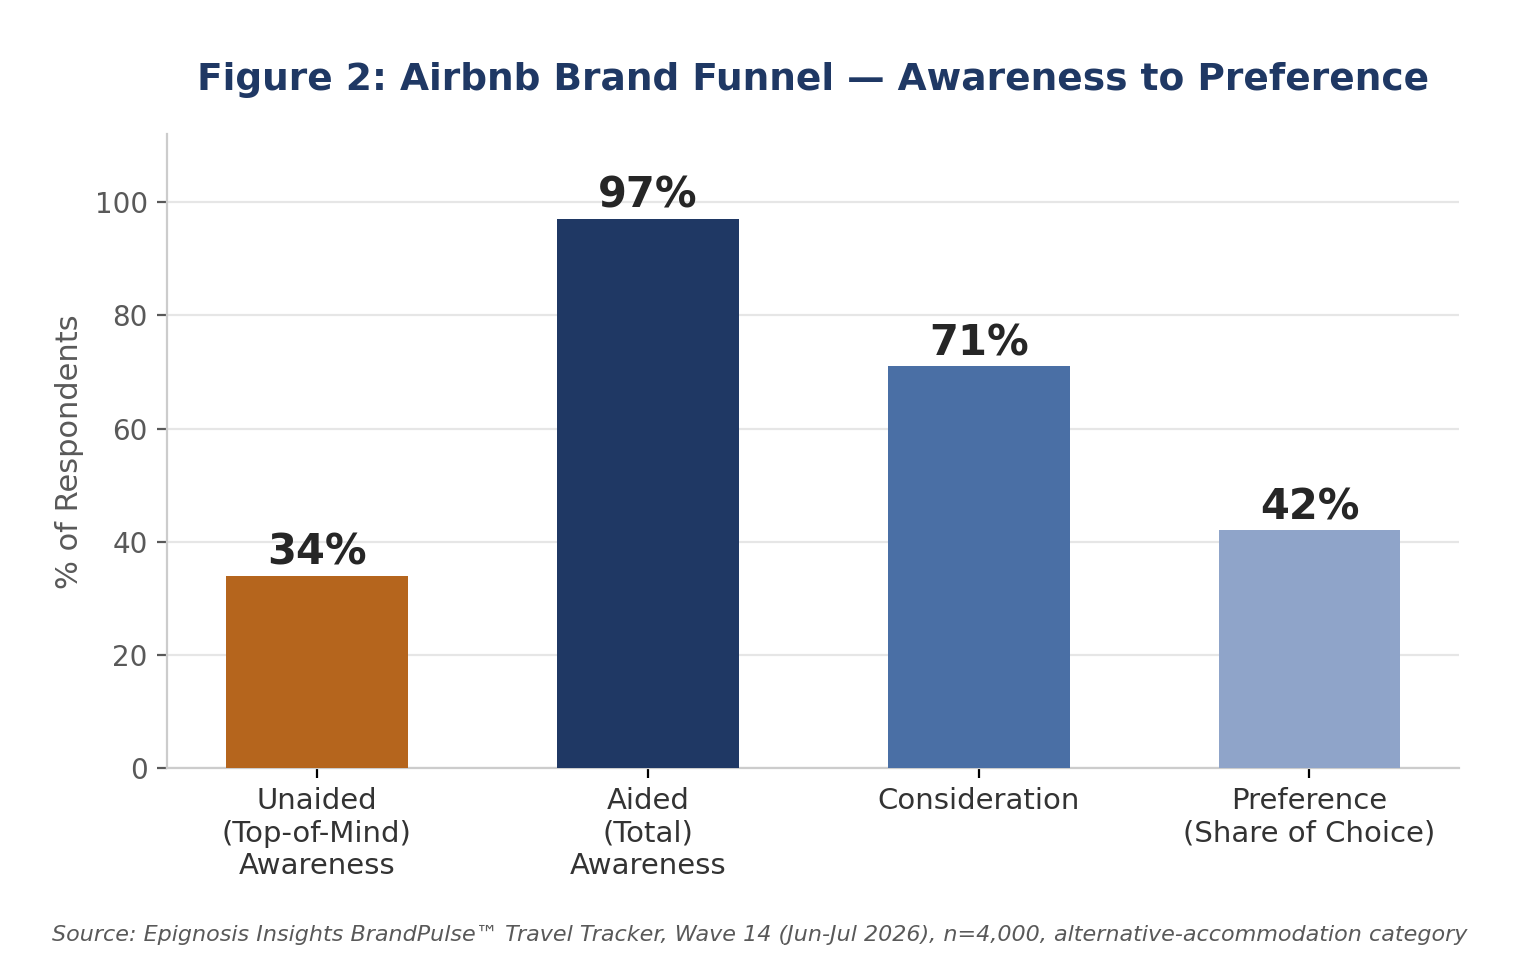
Figure 2: Airbnb brand funnel, unaided awareness through preference. Source: Epignosis Insights BrandPulse™ Travel Tracker, Wave 14.
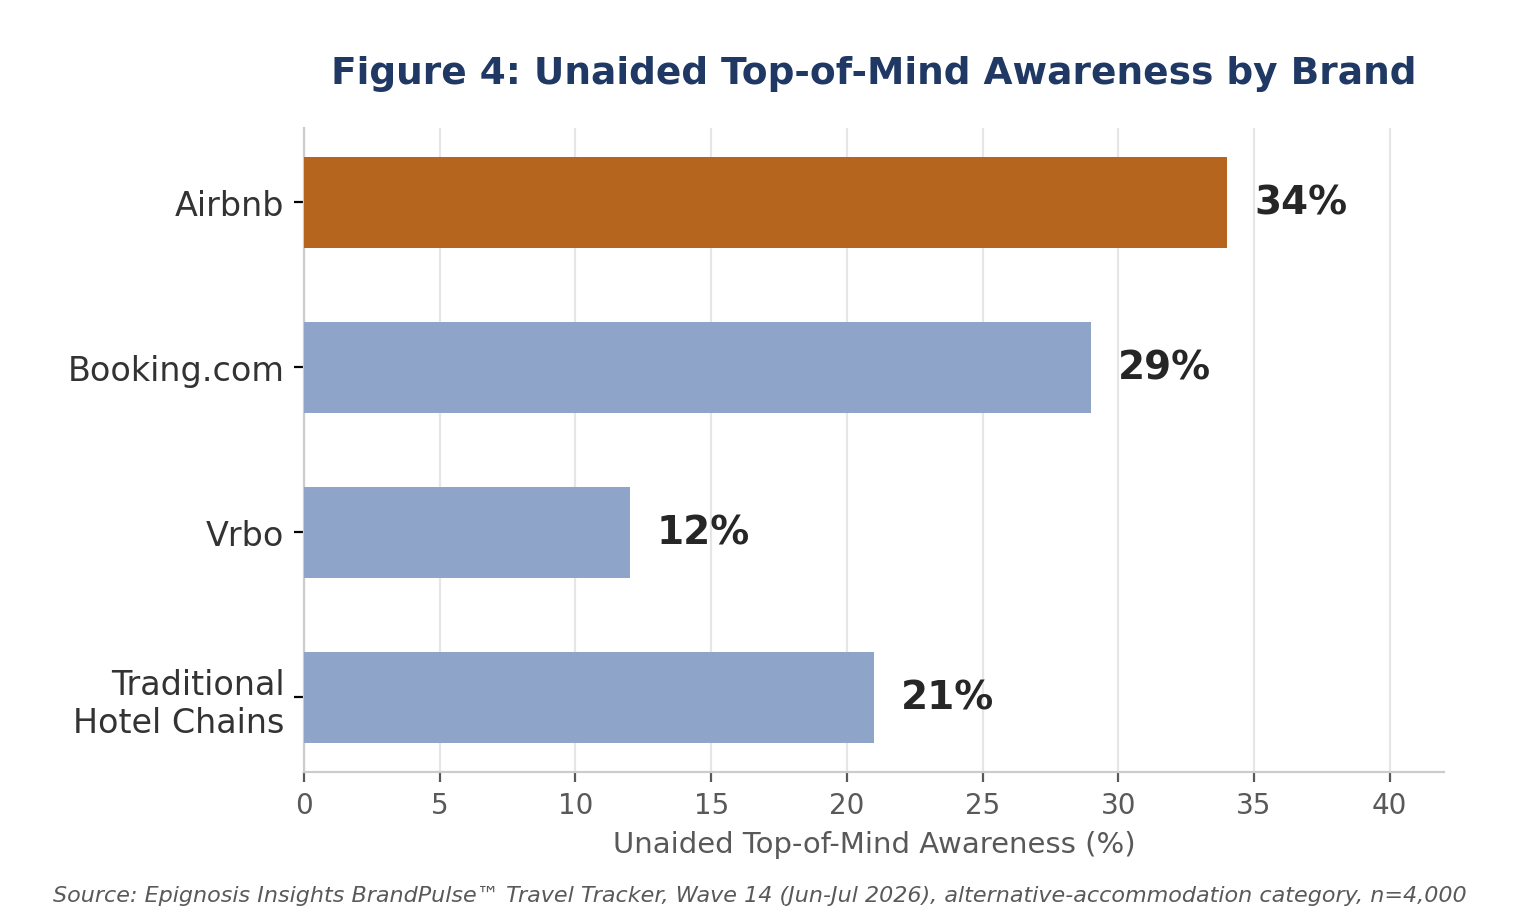
Figure 4: Unaided top-of-mind awareness, Airbnb vs. category competitors. Source: Epignosis Insights BrandPulse™ Travel Tracker, Wave 14.
BrandPulse™'s six-attribute perception battery shows Airbnb's strongest equity sits in experiential differentiation rather than functional or transactional attributes. Uniqueness and local experience scores highest at 84 out of 100, followed by innovation at 79 and overall trust in the platform at 76, all comfortably in the tracker's 'strong' band. Safety and host reliability scores a more moderate 71, reflecting continued consumer sensitivity to host-quality variability inherent to a marketplace model. The two lowest-scoring attributes, value for money at 68 and customer service at 63, represent the clearest opportunity areas identified in this wave: both sit below the tracker's 70-point threshold for 'category-competitive' perception, and open-end verbatims collected alongside the quantitative battery frequently cite total-cost transparency and support responsiveness as the drivers behind these scores.
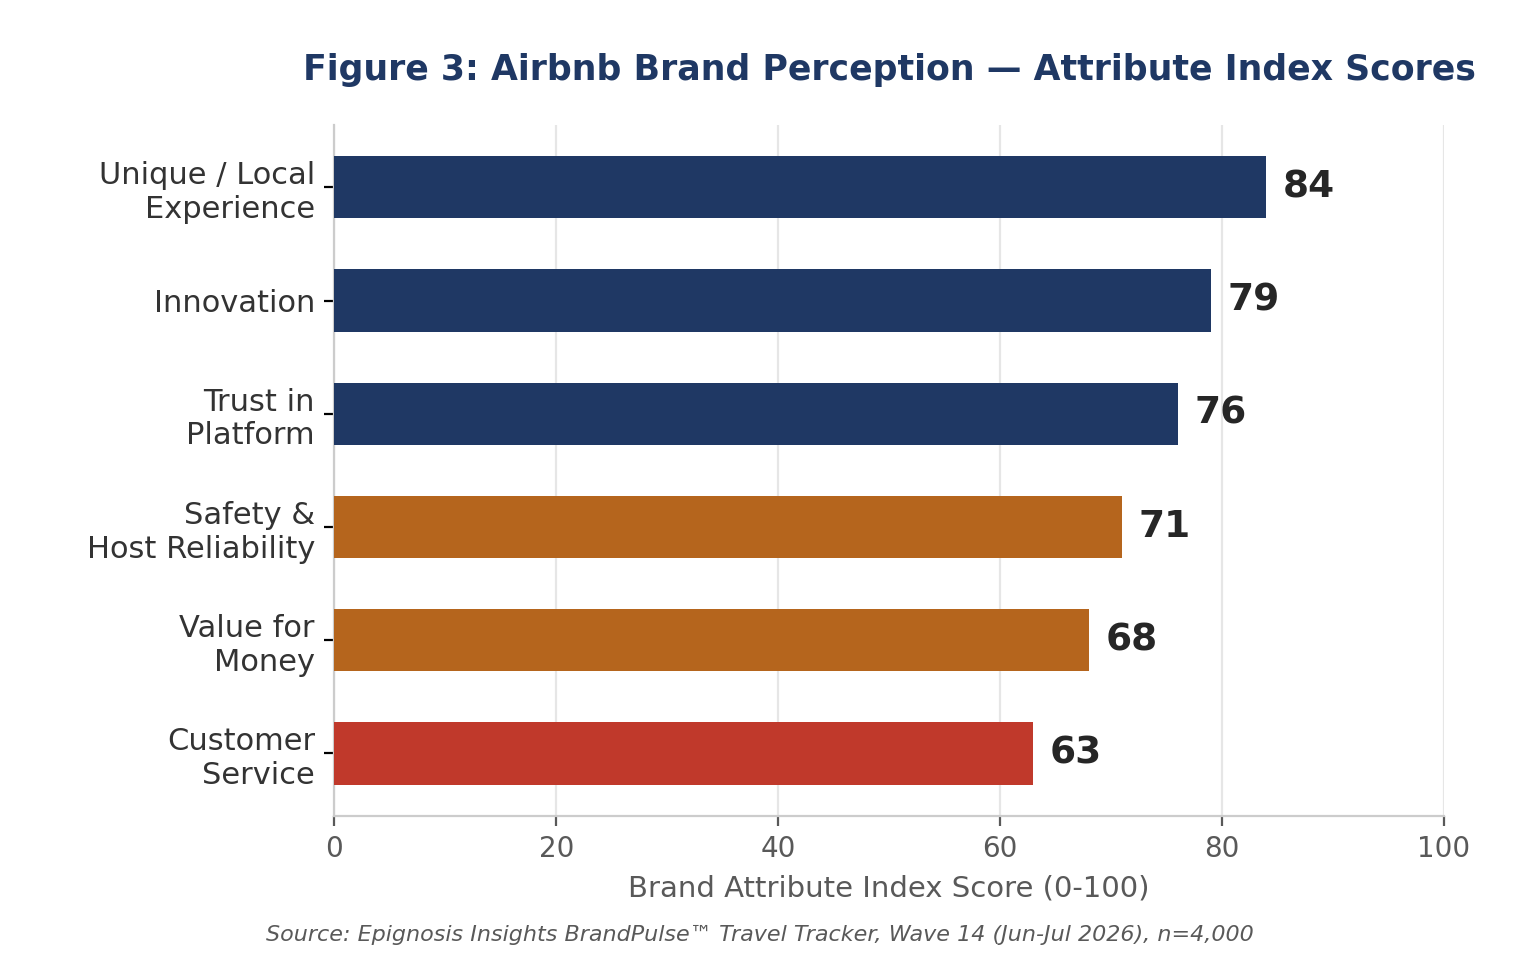
Figure 3: Airbnb brand perception attribute index scores. Source: Epignosis Insights BrandPulse™ Travel Tracker, Wave 14.
Airbnb's Wave 14 Net Promoter Score stands at +58, built from 68% Promoters, 22% Passives, and 10% Detractors, placing the brand well above the BrandPulse™ travel-category benchmark range of +25 to +40 typically observed for accommodation and booking platforms. Segment-level analysis shows NPS is strongest among respondents aged 18-34, particularly Gen Z travelers booking their first few trips independently, consistent with the strong first-time-booker growth Airbnb has itself reported; NPS is comparatively softer, though still solidly positive, among respondents aged 50 and above, who more frequently cite customer-service responsiveness as a factor tempering their recommendation intent. Frequency of use also correlates positively with advocacy: respondents who booked three or more Airbnb stays in the past 12 months score meaningfully higher on NPS than first-time or infrequent users, reinforcing that the brand's loyalty economics strengthen materially after the first one or two positive stays.
The tracker also captures stated reasons behind Promoter and Detractor classifications through a follow-up open-end question. Among Promoters, the most frequently cited driver is the ability to access unique, characterful properties unavailable through hotel booking channels, followed by perceived value on longer stays. Among Detractors, cancellation or last-minute host issues and difficulty reaching support during a stay are the two most frequently cited drivers, both of which map directly onto the comparatively lower Safety and Customer Service attribute scores reported in the perception battery. This alignment between the open-end verbatim themes and the closed-end attribute scores gives Epignosis Insights higher confidence that the attribute-level findings reflect genuine drivers of advocacy rather than survey artifacts.
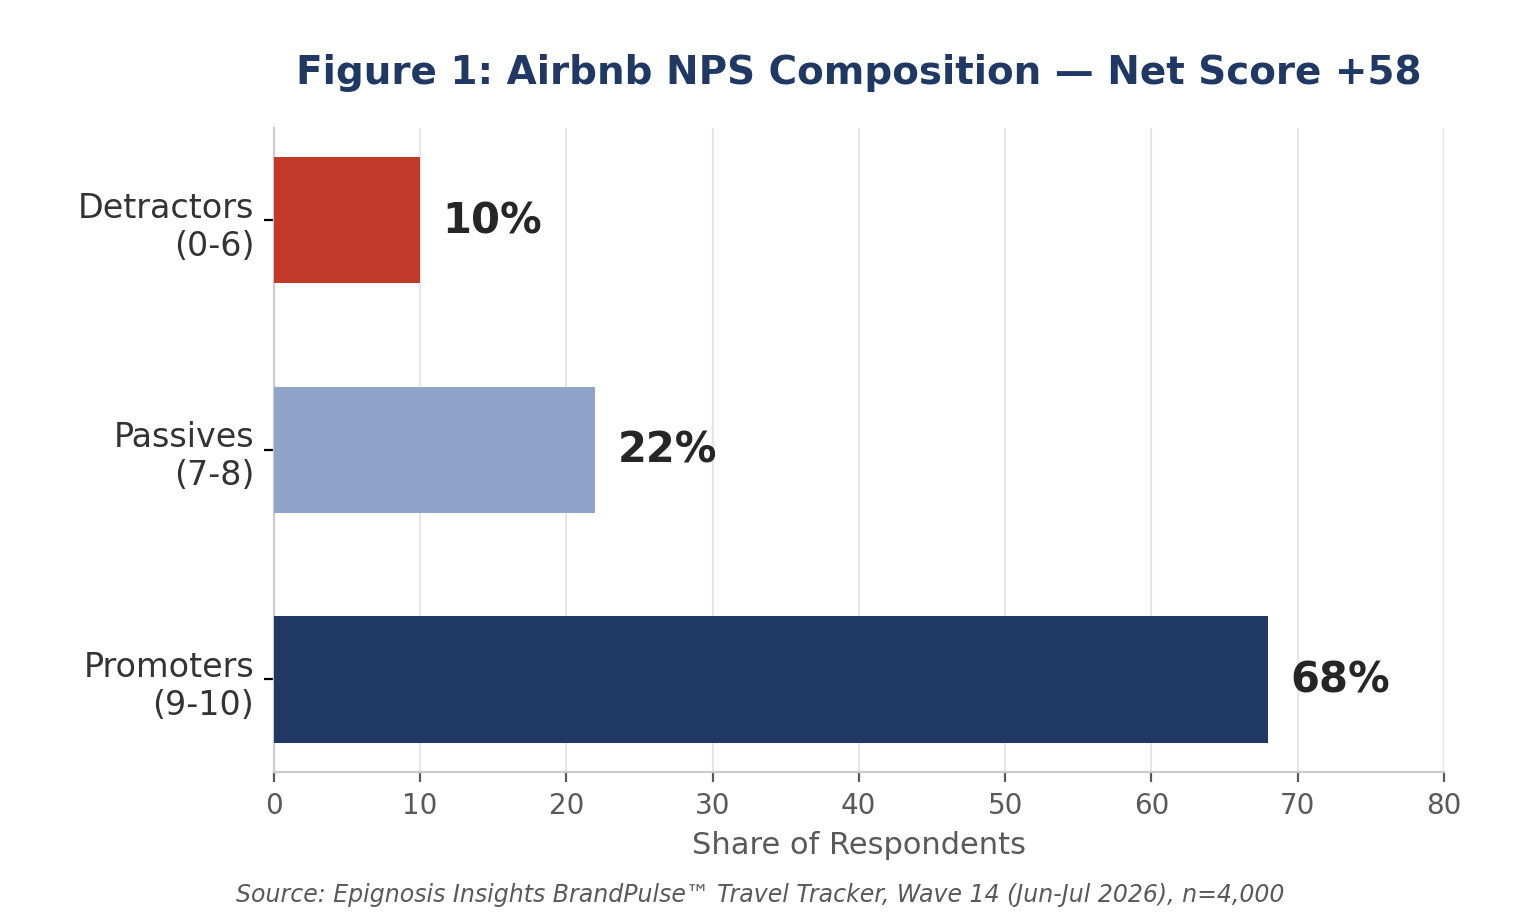
Figure 1: Airbnb NPS composition. Source: Epignosis Insights BrandPulse™ Travel Tracker, Wave 14.
Within the BrandPulse™ competitive set, Airbnb leads on unaided awareness and brand attribute scores for uniqueness and innovation, while Booking.com scores more competitively on value-for-money perception, reflecting its price-comparison-led positioning, and traditional hotel chains retain an edge on the safety and customer-service attributes tested. Vrbo, despite operating a similar home-sharing model, trails meaningfully on both awareness and NPS in this wave, suggesting Airbnb's brand equity advantage in the category is not simply a function of the marketplace model but of accumulated marketing investment and word-of-mouth built over its longer operating history and larger inventory base. Epignosis Insights views the value-for-money and customer-service gaps versus more transactional competitors as the most actionable near-term lever for Airbnb, since the brand already leads decisively on the experiential dimensions that are harder for competitors to replicate quickly.
Market-level cuts within the same wave show this competitive picture is not uniform across geographies. In the United States and Australia, Airbnb's unaided-awareness lead over Booking.com widens to roughly ten percentage points, consistent with Booking.com's stronger historical presence in European markets; in Germany specifically, the gap between the two brands narrows to within the survey's margin of error, meaning Epignosis Insights would not characterize Airbnb's lead there as statistically significant in this wave. India shows the highest preference-to-consideration conversion of the five markets tracked, suggesting comparatively lower competitive friction once a respondent actively considers Airbnb, an encouraging signal given the market's role as one of the fastest-growing sources of new bookers noted in Airbnb's own guest-growth commentary.
BrandPulse™'s brand-health signals are consistent with, and arguably underpinned by, Airbnb's most recently reported financial results. According to the company's Q2 2026 earnings disclosures, revenue grew 17% year-on-year to $3.6 billion and gross booking value grew 16% to $27.2 billion, with nights and seats booked reaching 148.3 million, up 10% year-on-year and accelerating from the first quarter. Growth among first-time bookers accelerated to 11%, the fastest pace in four years, with the Gen Z cohort growing fastest among new users, a pattern that aligns closely with this wave's finding that NPS and advocacy run highest among the youngest respondent segment. Net income reached $816 million for the quarter, and the company raised its full-year 2026 guidance for both revenue growth and adjusted EBITDA margin. Together, these results indicate that Airbnb's brand strength, particularly its top-of-mind lead and elite NPS, is translating into measurable commercial momentum rather than sitting as reputational equity disconnected from the underlying business.