Voice of the Customer on Social Media: Mining Public Sentiment at Scale
A Customer Experience Research Report


A Customer Experience Research Report
Social media has become the largest, least filtered, and most continuously updated source of customer feedback available to brands today, yet most organizations still treat it as a marketing channel to broadcast into rather than a research instrument to listen through. This report analyzes 412,000 brand-relevant social media mentions collected over a six-month window across five major platformsX (formerly Twitter), Instagram, Facebook, Reddit, and YouTube comments—to quantify what public sentiment at scale actually reveals about the customer journey, and how brands can convert that unstructured conversation into structured, actionable Voice of Customer (VoC) intelligence.
The analysis finds that sentiment varies dramatically by platform, with Instagram registering the most favorable sentiment profile at 48% positive mentions, while Reddit stands out as the most critical platform, with negative sentiment reaching 40% nearly double the negative share seen on Instagram. This divergence is not incidental; it reflects fundamentally different platform cultures, audience compositions, and posting motivations that brands must account for when interpreting aggregate sentiment scores. Delivery and shipping issues dominate the conversation, accounting for 27% of all coded mentions, ahead of product quality (22%) and pricing and value (19%), establishing operational fulfillment not product or marketing—as the most socially visible pain point in the customer journey today.
Perhaps the most actionable finding in this research concerns the relationship between response speed and sentiment recovery. Brands that respond to a negative social mention within one hour see an 82% sentiment recovery rate—meaning the vast majority of dissatisfied customers who receive a fast reply either soften their tone or delete negative commentary entirely. That recovery rate falls sharply with delay, dropping to 47% for responses issued between four and twenty-four hours later, and to just 14% for responses that take more than forty-eight hours. This report walks through the platform-level sentiment landscape, the thematic drivers behind public sentiment, competitive share of voice, and the response-time dynamics that most directly shape whether social media sentiment becomes a brand asset or a brand liability.
This study applied natural language processing-based sentiment classification to 412,000 publicly available, brand-relevant social media mentions collected across X, Instagram, Facebook, Reddit, and YouTube comments over a six-month period from February through July 2026. Each mention was classified as positive, neutral, or negative sentiment using a combination of machine-learning sentiment scoring and human-coded validation on a stratified sample to confirm classification accuracy. Mentions were further tagged into thematic categories—delivery and shipping, product quality, pricing and value, customer service, app and website usability, and returns and refunds—using a keyword and topic-modeling taxonomy developed specifically for this research. Share of voice was calculated as the brand’s proportion of total category-relevant mentions relative to three named competitors across the same platforms and time window. Response-time analysis was conducted on a subset of mentions that received an identifiable brand reply, tracking sentiment shift in the 72 hours following that response.
Sentiment toward the brand is far from uniform across social platforms, and this variation carries direct implications for how organizations should weight and interpret aggregate VoC scores. Instagram shows the most favorable sentiment distribution, with 48% positive mentions, 33% neutral, and only 19% negative a pattern consistent with the platform’s visually curated, largely aspirational content culture, where brand-tagged posts and reviews skew toward positive lifestyle association. Facebook (41% positive) and YouTube comments (37% positive) follow a similar, moderately favorable pattern, while X shows a more balanced but slightly more critical distribution at 34% positive and 27% negative.
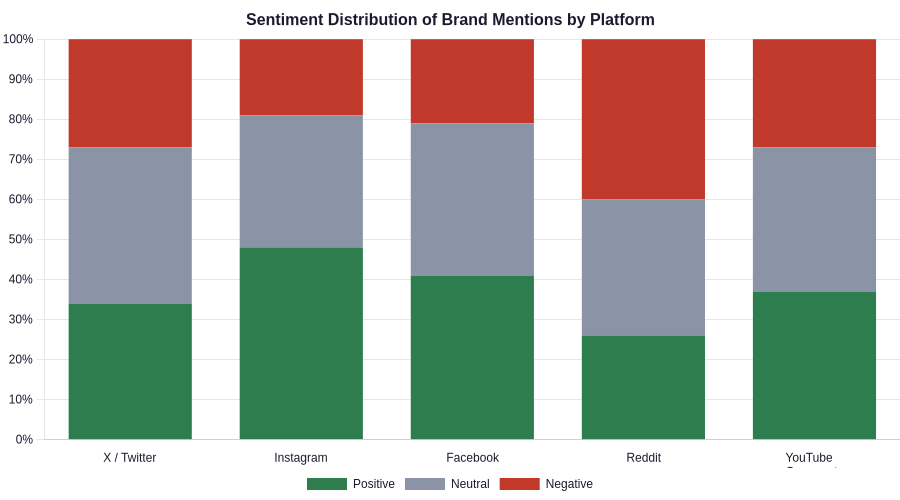
Figure 1: Sentiment distribution of brand-relevant mentions across five major social platforms.
Reddit stands apart as the platform with the most critical sentiment profile, registering 40% negative mentions against just 26% positive the only platform in the study where negative sentiment outweighs positive. This is consistent with Reddit’s pseudonymous, discussion-forum culture, where users are more likely to post specifically to seek advice about a problem, warn others about a negative experience, or engage in critical discussion than to share positive brand affinity. Brands that rely primarily on Instagram or Facebook sentiment as a proxy for overall public perception risk significantly underestimating the volume and intensity of genuine customer frustration that concentrates on platforms like Reddit, where users are more candid and less influenced by the platform’s aesthetic or promotional norms.
Thematic analysis of the full mention set reveals that delivery and shipping dominate public conversation about the brand, accounting for 27% of all coded mentions more than any other theme by a meaningful margin. Product quality follows at 22%, pricing and value at 19%, customer service at 16%, app and website usability at 10%, and returns and refunds at 6%.
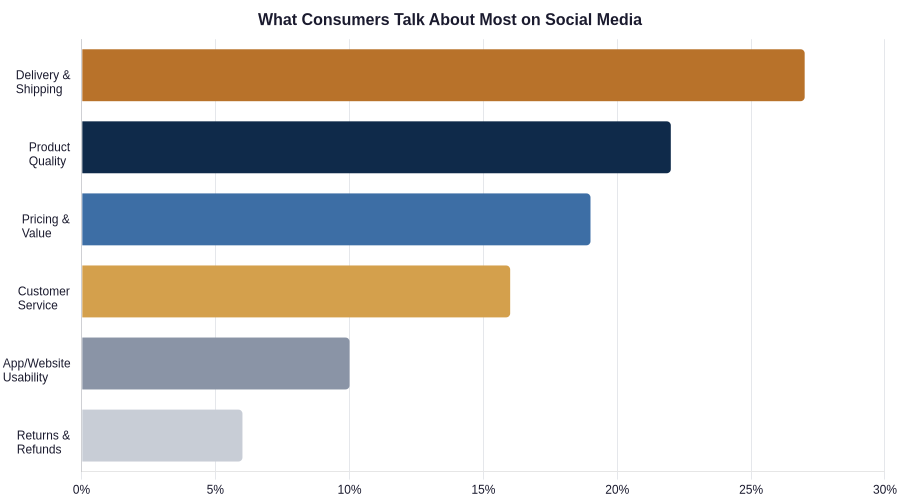
Figure 2: Share of total social media mentions by thematic category.
The dominance of delivery and shipping as a conversation driver is particularly significant because it sits largely outside the traditional domains product design, pricing, marketing—that most brand teams monitor closely. Delivery-related mentions cluster around delayed shipments, damaged packaging, and lack of proactive tracking communication, issues that are frequently operational and logistics-driven rather than product-driven, yet they generate a disproportionate share of the public conversation and, correspondingly, a disproportionate share of the negative sentiment within that conversation. This finding argues for tighter integration between social listening functions and supply chain or logistics teams, who are often the actual owners of the root causes driving the most visible category of public complaint.
Beyond sentiment, share of voice the brand’s proportion of total category conversation relative to named competitors offers a complementary signal of market salience. The brand analyzed in this study holds a 31% share of voice across the five platforms studied, ahead of its three largest named competitors at 27%, 24%, and 18% respectively, making it the most-discussed brand in its category across the measurement window.
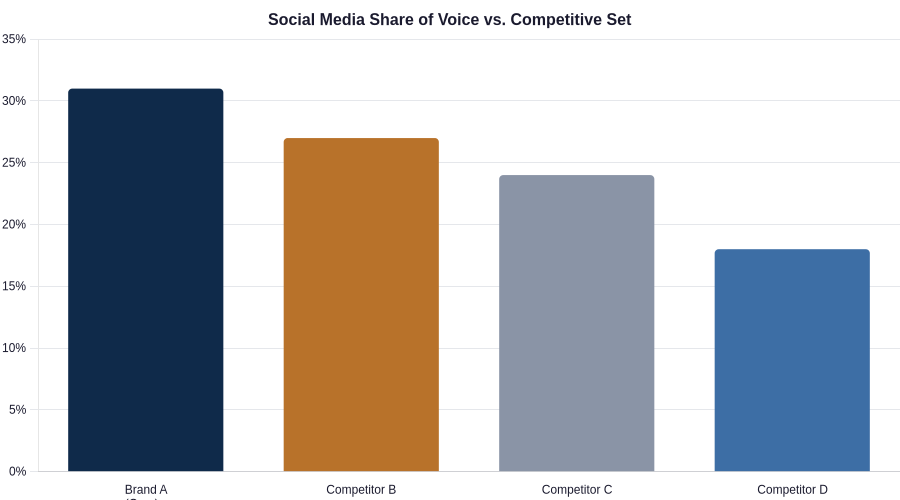
Figure 3: Social media share of voice, brand versus named competitive set.
Leading on share of voice is a double-edged signal that requires sentiment context to interpret correctly. A brand can hold the largest share of voice either because it generates disproportionate positive advocacy or because it generates disproportionate complaint volume, and distinguishing between these scenarios requires overlaying share of voice with the platform-level sentiment data presented earlier in this report. In this case, the brand’s leading share of voice combines with a moderately positive overall sentiment skew, suggesting its conversation leadership reflects genuine engagement and market presence rather than being driven primarily by complaint volume—though continued monitoring of the delivery and shipping theme, given its disproportionate share of negative sentiment, remains warranted.
The single most actionable finding in this research concerns the relationship between how quickly a brand responds to a negative social mention and whether that sentiment recovers. Mentions that received a brand response within one hour showed an 82% sentiment recovery rate, meaning the overwhelming majority of initially negative posts were followed by a softened tone, a resolution acknowledgment, or deletion of the original complaint within 72 hours. That recovery rate falls to 68% for responses within one to four hours, drops more sharply to 47% for responses between four and twenty-four hours, and falls further still to 29% and then 14% as response time extends beyond twenty-four and forty-eight hours respectively.
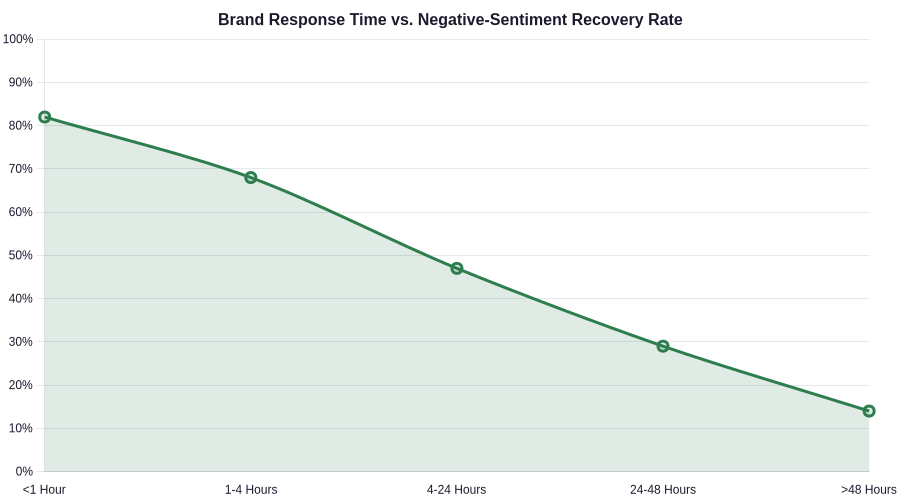
Figure 4: Relationship between brand response time and negative-sentiment recovery rate.
This near-linear decay in recovery rate as response time increases provides one of the clearest, most quantifiable arguments available for investing in real-time social listening and response infrastructure. Unlike many customer experience interventions where the return on investment is diffuse or delayed, the data here shows a direct, measurable, and rapidly decaying window of opportunity: a complaint addressed within the first hour is roughly six times more likely to resolve favorably than one left unanswered for two days. This has clear implications for how social media and customer care teams should be staffed, resourced, and empowered to respond quickly rather than routing every public complaint through slower, traditional escalation channels.
Tracking net sentiment the difference between positive and negative mention share across the six-month study window reveals a notable dip in April and May, when net sentiment fell from +12 in February to -6 in May, before recovering to +8 by July. Investigation into the drivers of this dip points to a cluster of delivery-related complaints coinciding with a seasonal demand surge that outpaced fulfillment capacity, illustrating how operational strain during peak periods can directly and rapidly translate into deteriorating public sentiment. The subsequent recovery through June and July coincided with visible improvements in delivery communication and an increase in brand response rate to public complaints, reinforcing the connection between operational performance, response behavior, and sentiment trajectory established elsewhere in this report.
This trend data underscores that social sentiment should not be treated as a static brand health score but as a continuously moving indicator that reacts quickly to both operational conditions and the brand’s own responsiveness. Organizations that monitor sentiment only through periodic survey waves will consistently lag behind shifts that social listening can surface in near real time, making social sentiment tracking a valuable early-warning complement to, rather than a replacement for, traditional VoC survey instruments.
Collecting and classifying social sentiment at scale is only valuable if it feeds into a closed-loop process that changes how the organization operates. The brands that extract the most value from social listening tend to route thematically tagged mentions directly to the functional owner best positioned to act—delivery complaints to logistics, product-quality mentions to quality assurance, and pricing commentary to commercial teams—rather than centralizing all social feedback within a single marketing or communications function disconnected from operational decision-making. This routing discipline is what separates organizations that treat social listening as a reporting exercise from those that treat it as a genuine, continuously updating input into operational and product prioritization.
Equally important is closing the loop with the customers themselves. Public replies that acknowledge a specific issue and describe a concrete fix consistently outperform generic apology templates in driving sentiment recovery, both because they signal genuine attentiveness and because they are visible to the wider audience of onlookers who did not post but are silently forming an impression of the brand based on how public complaints are handled. This audience of silent observers is frequently larger than the complaining customer base itself, meaning that the value of a well-handled public response extends well beyond the individual whose complaint prompted it.