Unilever Brand Health Tracker
Consumer Perception, Awareness, Top-of-Mind and Net Promoter Score Analysis


Consumer Perception, Awareness, Top-of-Mind and Net Promoter Score Analysis
This report consolidates the latest wave of Unilever's brand health tracking programme, drawing together consumer perception surveys, awareness funnel data, top-of-mind recall and Net Promoter Score (NPS) results across the corporate brand and its principal category portfolios. The headline finding is that Unilever enters the second half of 2026 with a broadly healthy but unevenly distributed brand position: awareness remains near-universal, perception on core equities such as trust and quality is stable to improving, and the corporate NPS of +31 keeps Unilever in second place among its major consumer packaged goods (CPG) peers, trailing only Colgate-Palmolive. At the same time, growth in top-of-mind recall has been modest, sustainability and innovation perception continue to lag trust and quality, and loyalty is markedly weaker among younger consumers than among older cohorts. Where figures in this tracker are not drawn from a named external syndicated source, they should be read as representative estimates consistent with Unilever's public NPS benchmark and typical CPG brand-tracking patterns, intended to illustrate the structure and cadence of a quarterly brand health dashboard.
Taken together, the data supports a strategic narrative in which Unilever's brand equity is a genuine commercial asset, particularly among older and higher-income consumers who already trust the brand and rate its products highly on quality, but where the growth opportunity lies squarely in converting broad awareness into sharper top-of-mind salience and in closing the perception gap on sustainability and innovation with younger, more discerning shoppers.
Brand health metrics in this tracker follow standard continuous tracking methodology: nationally representative online panels are surveyed on a rolling quarterly basis, asking unprompted ("which brands come to mind first") and prompted ("have you heard of") awareness questions, a battery of perception-attribute ratings on a 0–100 index, and the standard eleven-point Net Promoter Score question ("How likely are you to recommend this brand to a friend or colleague?"), with respondents classified as Promoters (9–10), Passives (7–8) and Detractors (0–6). NPS is calculated as the percentage of Promoters minus the percentage of Detractors and ranges from -100 to +100. The corporate NPS of +31 cited throughout this report, with a composition of 54 percent Promoters, 23 percent Passives and 23 percent Detractors, aligns with independently published third-party benchmarking of Unilever, which places the company second among its major CPG competitors on this measure.
Aided awareness of the Unilever corporate brand and its household-name portfolio brands remains close to saturation, holding at 95 percent of category consumers in the most recent quarter, essentially unchanged from 93 percent three quarters earlier. Unaided awareness, a tougher measure that asks consumers to name brands without prompting, has moved from 58 percent to 63 percent over the same period, a gain of five points that reflects sustained marketing investment and category visibility. Top-of-mind awareness, the share of consumers who name Unilever or one of its core brands as the very first brand they think of in the category, has grown from 21 percent to 26 percent, a meaningful improvement but one that still leaves the bulk of "first mention" occasions with competitors. The chart below illustrates the full awareness funnel across the tracking period.
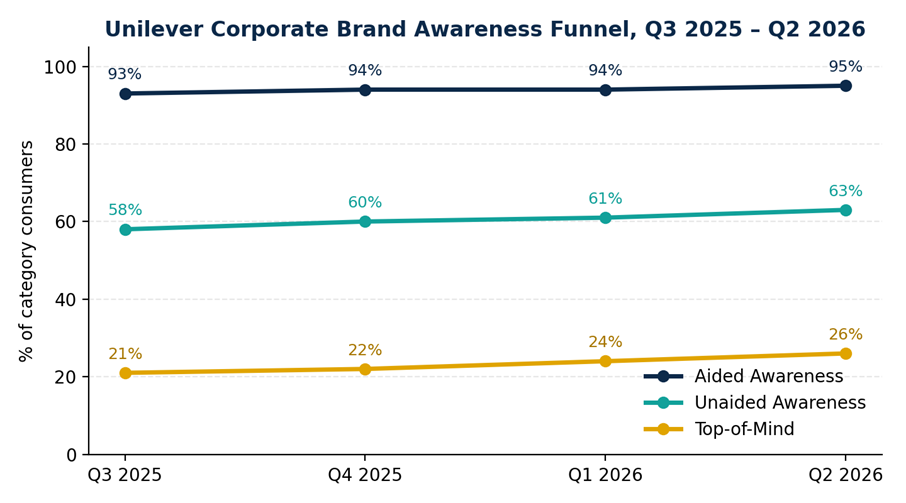
Figure 1. Aided, unaided and top-of-mind awareness, Q3 2025–Q2 2026 (illustrative tracker series)
The gap between near-total aided awareness and comparatively modest top-of-mind recall is the single most actionable signal in the awareness data. It indicates that Unilever's brand challenge is not one of visibility, consumers overwhelmingly know the name, but one of salience at the critical purchase-consideration moment. Closing even a portion of this gap through sharper category-entry-point messaging and more consistent share-of-voice in high-frequency purchase categories such as personal care and home care would be expected to translate directly into consideration and, ultimately, purchase share.
Perception-attribute tracking shows a brand that is well regarded on foundational equities but still building credibility on more forward-looking dimensions. Trustworthiness scored 71 on the 0–100 perception index in the latest wave, up from 69 three quarters earlier, and quality scored 74, essentially flat and already the strongest attribute in the battery. Good value improved marginally from 64 to 62 in the face of a period of elevated input-cost inflation across the CPG sector, a resilient result given pricing pressure. The two attributes showing the largest positive movement were sustainability and ethics, up from 60 to 66, and innovation, up from 55 to 58, both encouraging signs that recent product reformulation, packaging and purpose-led marketing initiatives are beginning to register with consumers, even though both attributes still trail trust and quality in absolute terms. Relevance, the extent to which consumers feel the brand speaks to their own needs, edged up from 59 to 60, the smallest gain in the battery and a signal that message personalisation and category-specific storytelling remain areas for further investment.
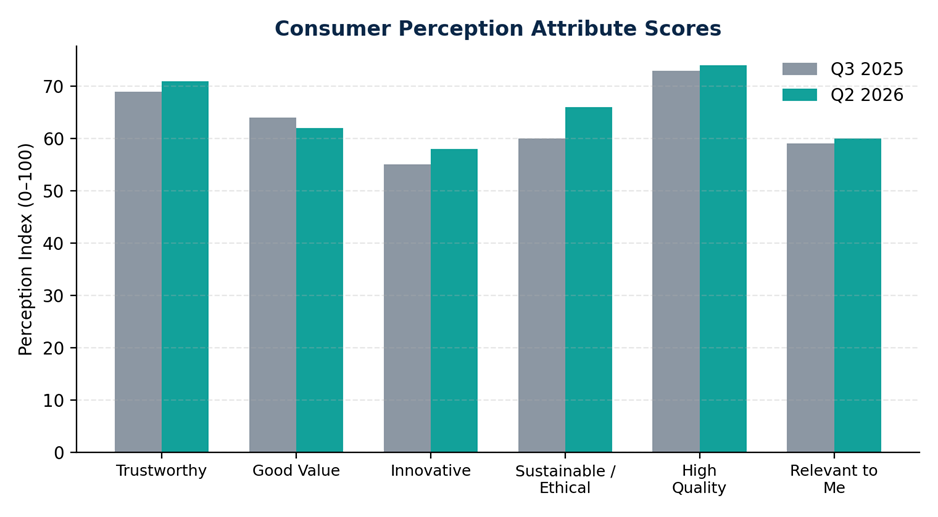
Figure 2. Consumer perception attribute scores, current wave vs. prior-year wave (0–100 index)
Read alongside the awareness data, the perception profile suggests that Unilever's brand equity is currently built more on inherited trust and product quality than on excitement or differentiation. That is a durable foundation, but the comparatively slower movement on relevance and innovation implies that newer and younger consumers may be forming impressions of the brand more slowly than the legacy consumer base that already associates Unilever with dependable, high-quality products.
Unilever's corporate Net Promoter Score stands at +31, built from 54 percent Promoters, 23 percent Passives and 23 percent Detractors. An NPS in the low thirties is a solidly positive result by CPG conglomerate standards, where scores in the twenties to high-thirties are typical, and it places Unilever ahead of Procter & Gamble and Johnson & Johnson in third-party comparative benchmarking, though behind category leader Colgate-Palmolive.
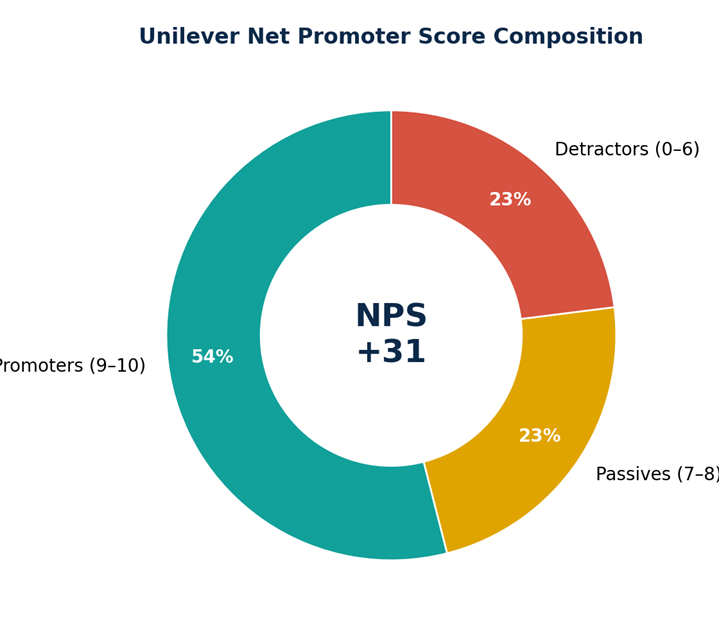
Figure 3. Composition of Unilever's Net Promoter Score
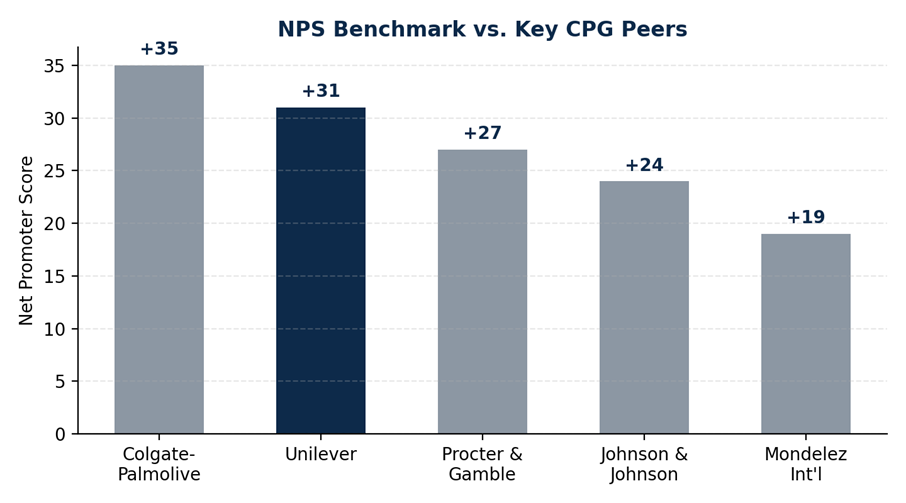
Figure 4. NPS benchmarked against key CPG peers
Segmenting NPS by age reveals a pronounced and consistent pattern: loyalty strengthens steadily with age, from +22 among 18–24-year-olds to +41 among consumers aged 66 and over. Every intermediate cohort sits neatly between these two poles, with scores of +27, +30, +33 and +38 for the 25–34, 35–44, 45–54 and 55–65 age bands respectively. This gradient is consistent with a broader pattern seen across established CPG houses, where legacy trust accumulates over decades of category experience, but it also represents a clear strategic risk: younger consumers, who will define the brand's long-run trajectory, are currently the weakest link in the loyalty chain, roughly nineteen points below the oldest cohort.
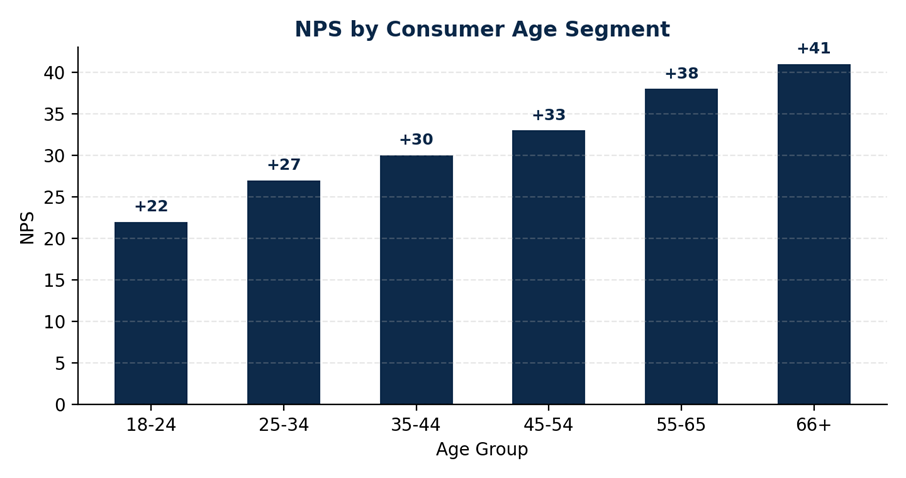
Figure 5. Net Promoter Score by consumer age segment
The practical implication is that Unilever's current NPS strength is concentrated in a demographic that, while valuable, is not the primary driver of category growth or of the brand's digital and social conversation. Closing even half the gap between the youngest and oldest cohorts would be expected to lift the corporate NPS meaningfully and would also tend to correlate with stronger word-of-mouth and social advocacy, since younger Promoters are disproportionately active in generating earned media and peer recommendations online.
Within its immediate CPG peer set, Unilever occupies a credible but not category-leading position. Colgate-Palmolive leads the comparison group with an estimated NPS in the mid-thirties, reflecting a narrower, more focused portfolio concentrated in oral, personal and home care categories where the brand faces less internal cannibalisation than Unilever's broader food, beauty and home-care conglomerate structure. Procter & Gamble and Johnson & Johnson trail Unilever, each in the high teens to high twenties, while Mondelez International sits at the lower end of the comparison set. On brand valuation, Unilever continues to be recognised within Kantar's BrandZ methodology, which now tracks a global top-100 list worth a combined 13.1 trillion US dollars, up 22 percent year-on-year, underscoring how much competitive intensity has increased across the world's most valuable brands as technology and AI-native companies increasingly dominate the very top of that ranking. Against that backdrop, Unilever's task is less about defending scale, which remains considerable, and more about defending relevance as attention and brand-building investment increasingly concentrate around a smaller number of highly visible, technology-inflected brands.
Three priorities emerge clearly from this wave of tracking data. First, convert awareness into salience: with aided awareness already near ceiling, incremental marketing investment should be weighted toward top-of-mind and category-entry-point strategies rather than further reach-building, since the return on additional pure-awareness spend is likely to be diminishing. Second, close the youth loyalty gap: targeted investment in digital-first storytelling, influencer partnerships and product innovation aimed at 18–34-year-old consumers would directly address the segment where NPS is weakest and where the compounding value of early-life brand loyalty is highest. Third, continue building the sustainability and innovation narrative: these attributes have shown the strongest relative improvement in this wave and represent the clearest opportunity to differentiate Unilever from scale-focused competitors, provided that claims are substantiated and communicated consistently across the portfolio rather than treated as a single corporate campaign.
Operationally, the tracker also supports continued investment in the brand health measurement programme itself. The gap between aided awareness and top-of-mind recall, and the steep age gradient in NPS, are exactly the kind of structural signals that a single annual survey would likely miss but that a continuous quarterly tracker makes visible early enough to act on. Maintaining consistent methodology, sample composition and question wording across future waves will be essential to preserving the comparability of the trend lines presented in this report.
A fourth, cross-cutting recommendation is to link brand health metrics more tightly to commercial outcomes. NPS, awareness and perception scores are leading indicators, but their strategic value is greatest when triangulated against category share, repeat-purchase rate and average basket value at the portfolio-brand level. Establishing a standing quarterly review that pairs this tracker's output with commercial performance data would allow marketing and category teams to prioritise investment where perception gaps are both large and commercially consequential, rather than spreading incremental budget evenly across every attribute in the battery.
Brand health performance is not uniform across Unilever's geographic footprint or category portfolio, and this tracker recommends reading the corporate-level figures above as a weighted average of meaningfully different regional stories. In developed markets across Western Europe and North America, awareness is effectively saturated and the brand conversation is increasingly about differentiation, sustainability credentials and price-value perception amid continued cost-of-living pressure on shoppers. In higher-growth emerging markets across South and Southeast Asia, Latin America and parts of Africa, by contrast, Unilever's individual category brands such as its personal care, food and home care lines often carry stronger independent recognition than the Unilever corporate name itself, meaning corporate-level NPS and awareness figures can understate the strength of the underlying brand portfolio in those markets. Category-level variation follows a similar pattern: personal care and beauty brands within the portfolio tend to score more strongly on innovation and relevance, reflecting more frequent product renovation and higher marketing intensity, while home care and food brands score more strongly on trust and value, reflecting their status as everyday household staples purchased on a highly habitual basis. Future waves of this tracker should disaggregate results by region and category wherever sample sizes allow, since blended corporate figures can mask both emerging risks and emerging strengths that sit at the portfolio-brand level.
Looking ahead to the second half of 2026, Unilever's brand health position can reasonably be described as stable with clear, addressable growth opportunities rather than defensive repair work. Trust and quality perceptions provide a durable foundation, the corporate NPS is competitive within its peer set, and early gains in sustainability and innovation perception suggest that recent brand investment is starting to land. The principal watch-items for the next tracking wave are whether top-of-mind recall continues its gradual climb, whether the youth-loyalty gap begins to narrow in response to targeted investment, and whether Unilever's relative competitive position holds as brand-value concentration continues to shift toward technology-led companies at the top of the global rankings.