Global Solid-State Battery Cost Tracker
Monthly Cost & Market Analysis — January to August 2026 Solid-State Battery (SSB) | Composite Cost Index, Chemistry-Tier Benchmarks, Supply & Demand Drivers


Monthly Cost & Market Analysis — January to August 2026 Solid-State Battery (SSB) | Composite Cost Index, Chemistry-Tier Benchmarks, Supply & Demand Drivers
Solid-state Battery (SSB) Cell Costs continued their gradual descent through the first eight months of 2026, even as the technology remained firmly in a pilot-scale, pre-mass-production phase rather than a liquid, spot-traded commodity market. The Epignosis Insights composite cost index, which blends automotive-grade all-solid-state and semi-solid-state cell cost estimates, opened January at an estimated USD 460 per kilowatt-hour and eased steadily to roughly USD 370 per kWh by August, a decline of nearly 20 percent across the tracking window. That improvement was driven less by any single price-setting event, since almost no solid-state cells are yet sold on open commercial terms, and more by a sequence of pilot-line ramp-ups, a new Chinese national technical standard, and incremental yield improvements disclosed by the handful of companies furthest along the commercialization curve. Even after this progress, solid-state cells remained roughly four to five times more expensive than mainstream lithium-ion cells, which held in the neighborhood of USD 80 to 100 per kWh across the same period, underscoring how much of the cost curve still lies ahead before solid-state technology reaches broad automotive affordability. This report walks through the cost trajectory month by month, breaks down the gap between all-solid-state and semi-solid-state chemistries, and sets out the manufacturing and policy forces likely to shape solid-state battery costs into the fourth quarter.
Solid-state battery costs entered 2026 in a range widely cited by industry analysts at USD 400 to 600 per kWh for all-solid-state automotive cells, a multiple of three to five times the prevailing cost of mainstream lithium-ion chemistries. The Epignosis Insights composite, which weights all-solid-state and semi-solid-state cell cost estimates, opened January near USD 460 per kWh and held largely flat through February as the industry's most closely watched pilot facilities were still in the early stages of ramp. A modest but meaningful cost inflection arrived in late January, when a major Japanese materials supplier broke ground on a large-scale solid electrolyte pilot plant in partnership with a leading automaker, a step widely read by the industry as a precondition for eventually driving electrolyte costs down through scale.
The composite eased to roughly USD 440 per kWh in March as several developers reported improving core-tool uptime on their automated pilot lines, a manufacturing metric that industry participants increasingly cite as a better near-term cost indicator than headline materials pricing, since yield losses on immature production lines represent a larger share of total cost than raw material inputs at this stage of the technology's development. April and May saw the cost curve continue its gradual decline, with the composite falling to around USD 430 and then USD 415 per kWh as government-backed research funding rounds targeting cell-level manufacturing cost reductions of at least 30 percent relative to the state of the art began to filter into publicly disclosed project milestones. June marked a more distinct move, with the composite falling to approximately USD 400 per kWh as one of the leading developers disclosed plans to double pilot-line output in the second half of the year, a scale-up that analysts read as directly supportive of near-term unit cost reduction even before full commercial volumes are reached. The most structurally significant development of the tracking window arrived on July 1, when the world's first national standard specifically governing automotive solid-state battery terminology and classification took effect in China, a regulatory milestone that industry participants say is helping standardize supply chain specifications and, in turn, supporting cost comparability and negotiation leverage across the Chinese solid-state supply chain. The composite eased further to roughly USD 385 per kWh in July and USD 370 per kWh by August as Chinese all-solid-state cell costs, quoted domestically in yuan per watt-hour terms, continued to compress toward the lower end of the global range even as they remained several multiples above mainstream liquid lithium-ion cells produced in the same facilities.
The composite index masks a meaningful and persistent gap between the two main solid-state cost tiers tracked in this report. All-solid-state cells, which fully replace the liquid or gel electrolyte with a solid sulfide, oxide or polymer separator, remained the more expensive tier throughout the window, opening January near USD 520 per kWh and easing to roughly USD 430 per kWh by August as pilot-line yields improved but full commercial-scale production remained at least one to two years away for most developers. Semi-solid-state cells, which retain a reduced quantity of liquid or gel electrolyte alongside a partially solid architecture, represent a materially cheaper and more commercially mature tier, having already been installed at scale in production vehicles by at least one automaker offering an extended-range battery pack option. This tier opened January near USD 230 per kWh and eased to roughly USD 190 per kWh by August, reflecting both genuine manufacturing learning-curve effects and the tier's proximity to conventional lithium-ion production processes, which allows semi-solid producers to reuse much of the existing liquid-cell manufacturing base rather than building entirely new inert-atmosphere production environments. For comparison, mainstream lithium-ion cell costs, anchored by the continued global spread of low-cost lithium iron phosphate chemistry, held in a range of roughly USD 80 to 100 per kWh across the tracking window, meaning the all-solid-state cost premium narrowed only modestly, from close to six times the lithium-ion benchmark in January to just above four times by August, while the semi-solid-state premium narrowed from roughly 2.7 times to just under 2.4 times over the same period.
The dominant supply-side theme of the tracking window was pilot-line scale-up rather than any conventional feedstock or commodity price movement, reflecting solid-state batteries' current position as a manufacturing-cost-constrained technology rather than a materials-cost-constrained one. Several of the most closely watched developers reported concrete production milestones during the window: one leading North American developer disclosed that its automated pilot line's core tools were achieving uptime above 90 percent, with plans to double output in the second half of the year, while a major Japanese automaker's demonstration production line, which began operating in early 2025 using a roll-pressing technique for solid electrolyte layers, continued to generate manufacturing process learnings feeding into that company's stated timeline for mass production later in the decade. Government research funding played a supporting but consequential role: a U.S. federal grant round announced in May 2026 allocated several million dollars to university and industry research aimed at scaling solid-state lithium metal anode technology and improving fast-charging performance, part of a broader departmental funding mandate to reduce electrode, cell or pack manufacturing costs by at least 30 percent relative to current state-of-the-art production methods. In China, the introduction of the country's first national technical standard for automotive solid-state batteries on July 1 provided a less direct but still meaningful supply-side tailwind, as standardized terminology and classification make it easier for cell makers, material suppliers and automakers to negotiate specifications and compare costs across an otherwise fragmented and rapidly evolving supply chain. Materials constraints remain a persistent headwind, however: inert-atmosphere processing requirements, low production yields relative to mature lithium-ion lines, and the expense of solid electrolyte materials, particularly sulfide-based formulations, continue to represent the largest components of the all-solid-state cost stack, and industry participants broadly expect these constraints to ease only gradually as production volumes climb from today's pilot scale toward genuine gigawatt-hour-scale manufacturing.
Demand-side dynamics for solid-state batteries in 2026 remained dominated by automaker partnership announcements and staged commercialization roadmaps rather than by end-consumer purchasing decisions, since essentially no vehicles equipped with true all-solid-state cells reached customer hands anywhere in the world during the tracking window. Automotive original equipment manufacturers continued to place parallel bets across multiple chemistry approaches: one major Japanese automaker's sulfide-based program received official domestic production approval in the prior year and has reserved initial capacity for flagship luxury models, with a stated production target later in the decade; a leading North American developer expanded its automotive partnership base during the window, adding a new multi-year collaboration focused on automotive cell development alongside its existing agreement with a major European automotive group; and Chinese battery manufacturers pursued a dual-track strategy, advancing semi-solid-state cells toward near-term mass production while pursuing longer-dated all-solid-state development timelines extending toward the end of the decade. Beyond passenger vehicles, demand signals also broadened into adjacent markets during the window, with at least one developer publicly establishing separate business verticals targeting electric vehicles, artificial-intelligence data center backup power, and aerospace and defense applications, reflecting a broader industry view that early solid-state commercial volumes may arrive first in premium or specialized applications less sensitive to per-kWh cost than mass-market passenger vehicles. This staged, application-by-application rollout pattern is a key reason the cost curve, while improving, remains gradual rather than the kind of sharp cost inflection seen in more mature, higher-volume battery chemistries.
Looking toward the fourth quarter, the tracker's base case anticipates continued gradual cost improvement rather than a sharp inflection, with the composite index expected to ease toward a range of roughly USD 340 to USD 370 per kWh by year-end as pilot-line output increases and yield-related learning continues. The all-solid-state tier is likely to remain the primary source of cost volatility, given its earlier position on the manufacturing learning curve and its greater sensitivity to inert-atmosphere processing costs, while the more mature semi-solid-state tier should continue a steadier, more incremental decline. China's new national technical standard is expected to provide an ongoing structural tailwind to cost transparency and negotiation efficiency across the domestic supply chain, even though it does not directly reduce material or processing costs. The single largest swing factor for the fourth quarter is production-scale execution: announced plans to double pilot-line output at multiple developers, if realized on schedule, would materially improve the cost trajectory heading into 2027, while any delay in scale-up, a persistent risk given the technology's manufacturing complexity, would likely keep costs closer to the upper end of the tracker's forecast range. Government research funding is expected to remain a supporting rather than a determining factor, given that public grant amounts remain small relative to the capital intensity required for full commercial-scale solid-state manufacturing.
Procurement and strategy teams evaluating solid-state battery supply agreements should treat the composite index as a planning benchmark rather than a quotable market price, given how thin and heterogeneous actual transaction volumes remain at this stage of the technology's development. Buyers negotiating early-access or sampling agreements should expect substantial variation around the tracked averages depending on cell format, energy density target, and whether the supply agreement includes joint development work rather than a straightforward cell purchase. Automakers pursuing multiple parallel chemistry bets, a pattern now common across nearly every major original equipment manufacturer active in this space, should also weigh the risk that early volume commitments to one developer's chemistry could prove premature if a competing approach achieves a faster cost decline; the tracker's chemistry-tier breakdown is intended to help surface that relative-pace risk rather than to pick a single winning technology path. On balance, the second half of 2026 looks set to extend the gradual, execution-driven cost improvement seen since January, with the pace of decline remaining closely tied to a small number of companies' pilot-line scale-up schedules rather than to any broader commodity or feedstock market dynamic.
This tracker is compiled and maintained by Epignosis Insights as the primary aggregating source, drawing on a deliberately diversified evidence base rather than any single price-reporting agency, reflecting the reality that solid-state battery cells do not yet trade on an open, liquid spot market in the way established commodities do. Government funding announcements anchor the manufacturing-cost-reduction policy narrative, an industry association anchors the North American commercialization and networking context, a listed developer's own quarterly disclosures anchor the pilot-line production and partnership narrative, a specialist clean-energy research and consulting firm anchors the broader battery cost-curve context, and international automotive trade news anchors the real-time chronology of chemistry-specific commercialization milestones, particularly in China. Each of these source categories is used once in this edition to avoid over-reliance on any single voice, and the composite cost figures presented here should be read as directional, analyst-informed estimates rather than transactable market prices, since actual solid-state cell costs vary substantially by chemistry, format, order volume and the specific stage of each developer's production learning curve.
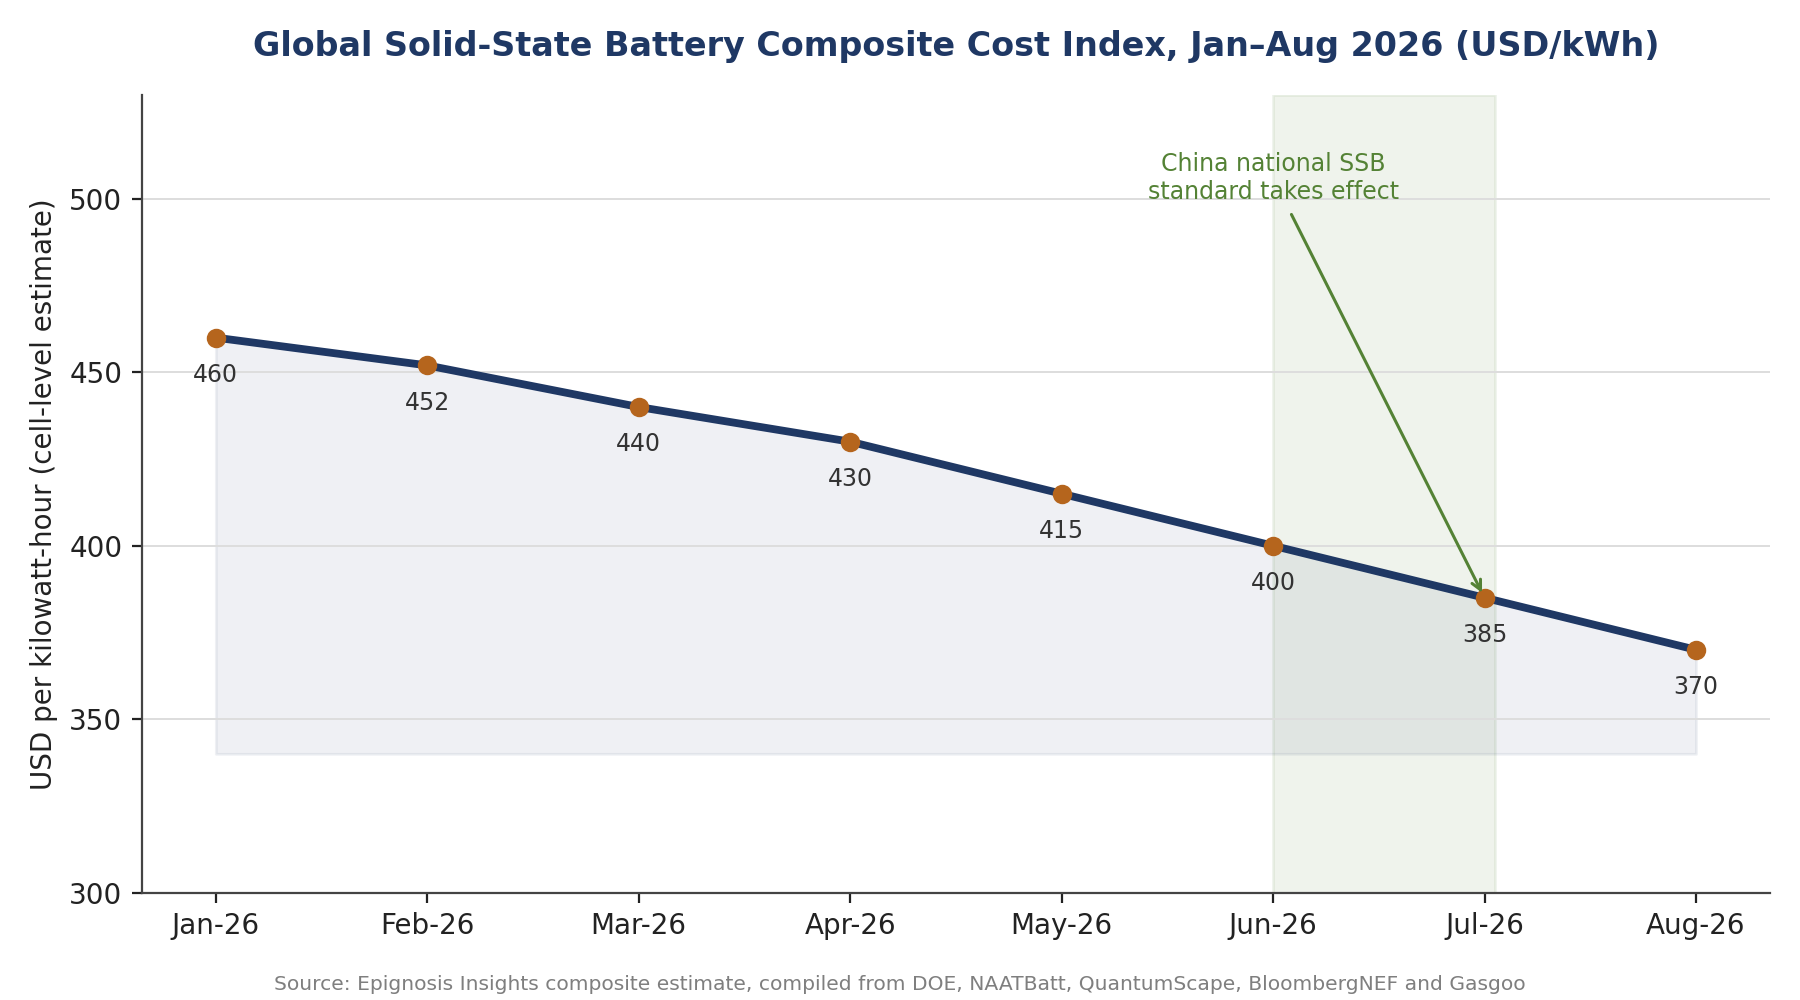 Figure 1. Global solid-state battery composite cost index, January–August 2026 (USD/kWh). Source: Epignosis Insights composite estimate.
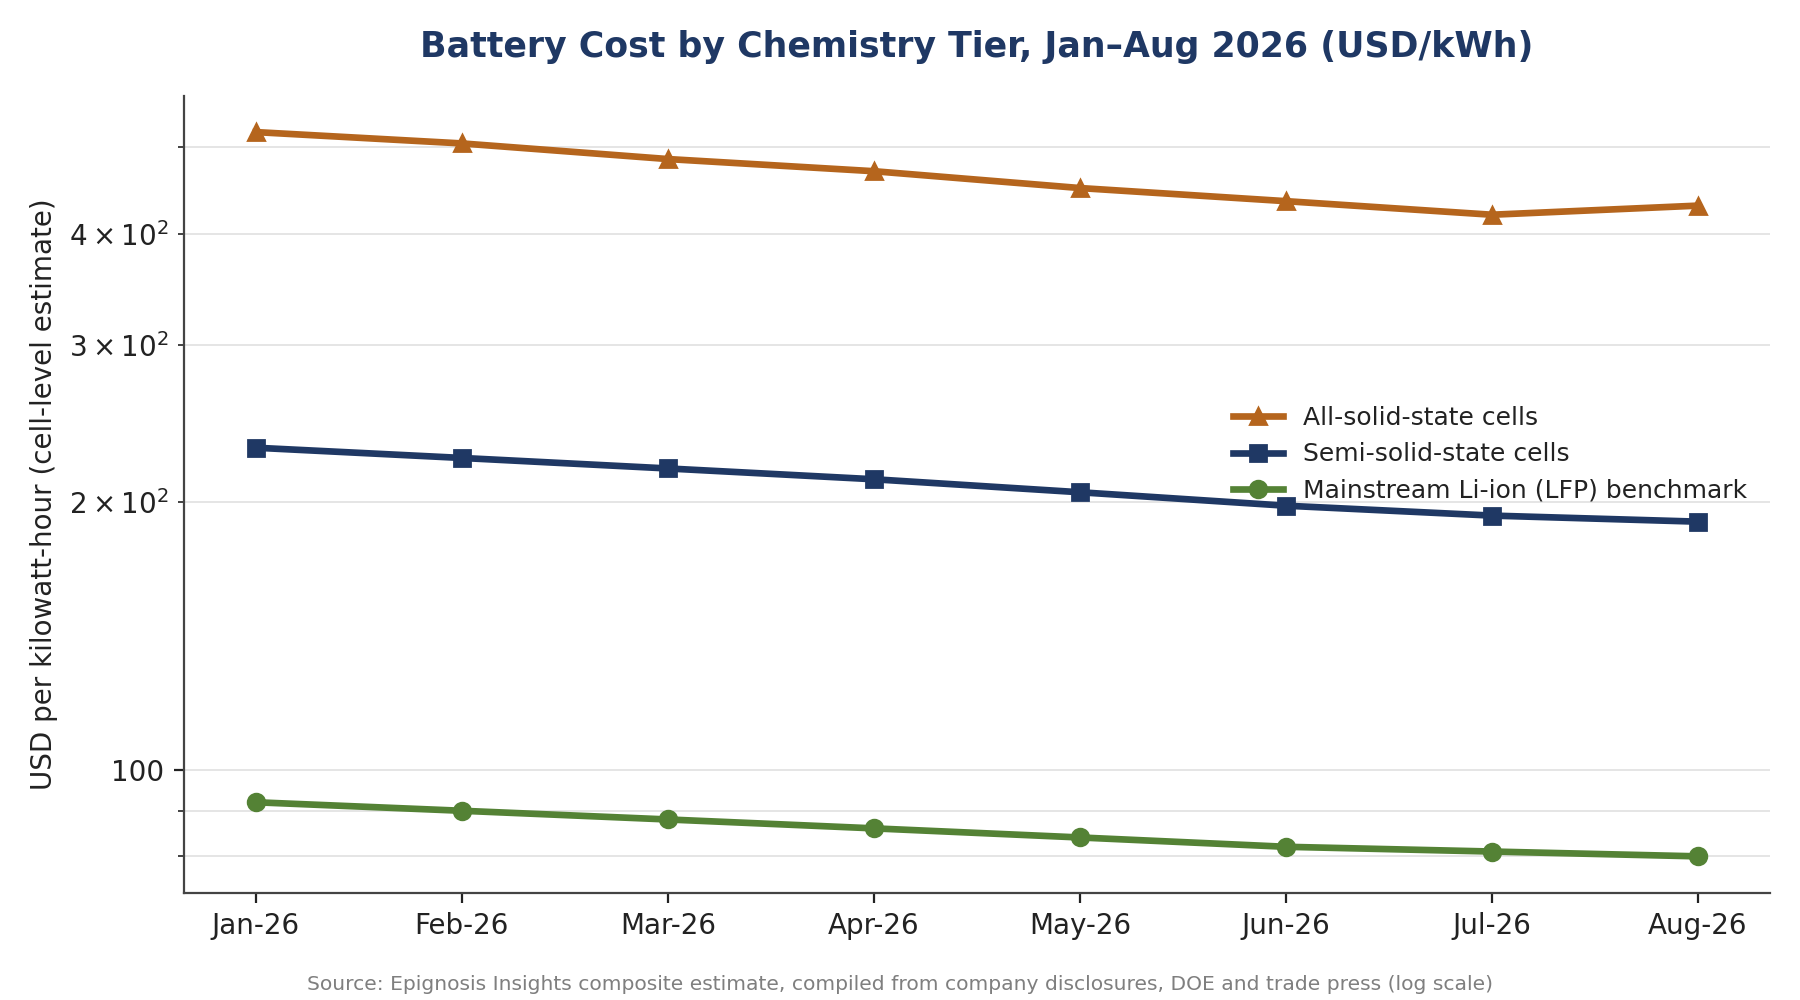
Figure 2. Battery cost by chemistry tier — all-solid-state, semi-solid-state, and Li-ion benchmark (USD/kWh, log scale). Source: Epignosis Insights composite estimate.
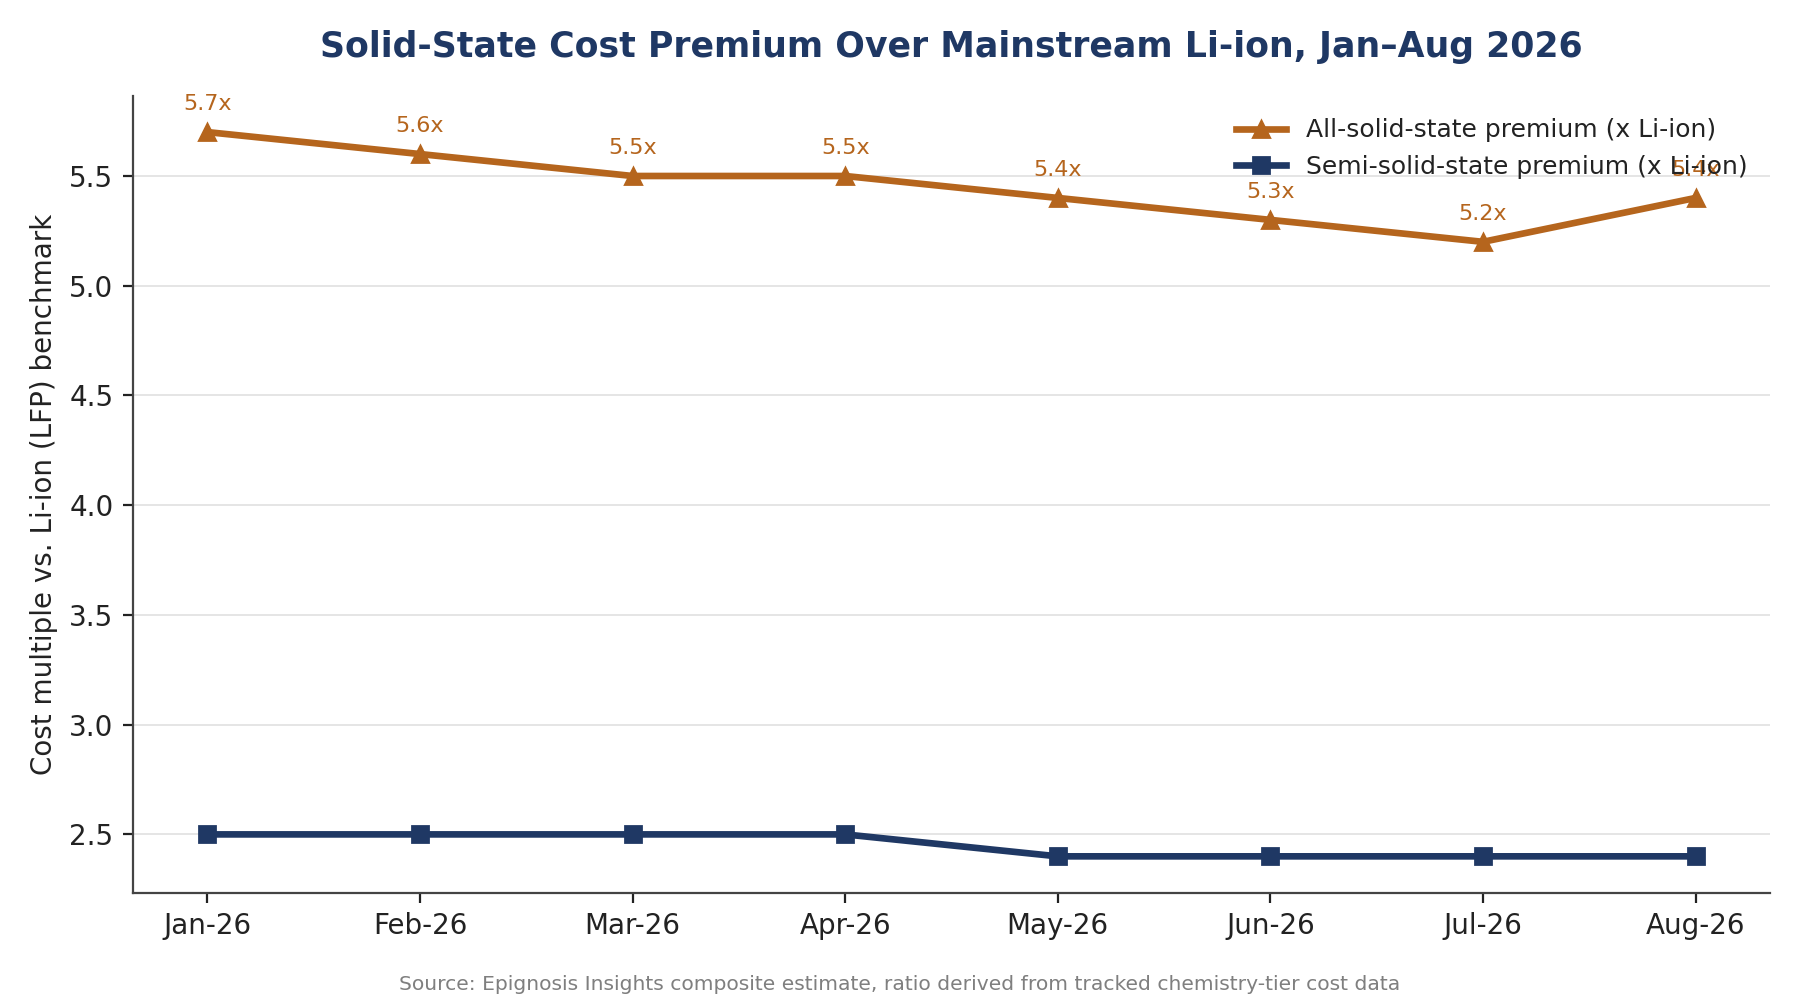
Figure 3. Solid-state cost premium over mainstream Li-ion, Jan–Aug 2026. Source: Epignosis Insights composite estimate.
The table below summarizes the composite and chemistry-tier cost figures charted above. Rows are presented in USD per kilowatt-hour, except the bottom row, which shows the all-solid-state (ASS) cost premium as a multiple of the Li-ion benchmark.
| USD/kWh | Jan-26 | Feb-26 | Mar-26 | Apr-26 | May-26 | Jun-26 | Jul-26 | Aug-26 |
| Global Composite | 460 | 452 | 440 | 430 | 415 | 400 | 385 | 370 |
| All-Solid-State | 520 | 505 | 485 | 470 | 450 | 435 | 420 | 430 |
| Semi-Solid-State | 230 | 224 | 218 | 212 | 205 | 198 | 193 | 190 |
| Li-ion (LFP) Benchmark | 92 | 90 | 88 | 86 | 84 | 82 | 81 | 80 |
| ASS Premium (x Li-ion) | 5.7 | 5.6 | 5.5 | 5.5 | 5.4 | 5.3 | 5.2 | 5.4 |