Global Solar Module Price Tracker
Epignosis Insights Research Desk — Monthly Report, August 2026


Epignosis Insights Research Desk — Monthly Report, August 2026
Global Solar Module Pricing is exiting one of the most severe down-cycles in the industry’s history, and the recovery is proving as regionally uneven as the collapse that preceded it. BloombergNEF data shows blended global module prices peaked near $0.30 per watt in 2022 before a wave of Chinese capacity additions pushed China-origin Tier-1 TOPCon modules down to a floor of $0.085–$0.095 per watt FOB by the first quarter of 2026. That floor is now firming: Wood Mackenzie attributed a 48% jump in Chinese component prices between September and October 2025 to a coordinated set of government interventions, including factory utilization cuts of up to 70%, a pivot away from legacy PERC technology, and the cancellation of a 13% VAT export rebate. China’s own industry body, the China Photovoltaic Industry Association (CPIA), recorded a more modest 2.3% year-to-date rise in module prices through November 2025, alongside a much sharper 38.9% increase in upstream polysilicon prices evidence that the price recovery so far has been concentrated upstream rather than fully passed through to finished modules.
The Chinese domestic and export price trajectory is the anchor for the entire global market, since China still accounts for roughly 85% of nameplate module manufacturing capacity worldwide. Prices fell from the 2022 peak of roughly $0.30 per watt through a prolonged oversupply-driven decline that bottomed out below $0.09 per watt by early 2026, according to BloombergNEF. The market found a firmer floor around the PowerChina 2026 tender, one of the most closely watched domestic demand signals, which cleared at CNY 0.735–0.748 per watt equivalent to roughly $0.103–$0.105 per watt suggesting Chinese manufacturers are maintaining pricing discipline in large domestic tenders even while continuing to accept losses on some export volumes. Market commentary reported by pv magazine, citing Dow Jones editorial analysis, expects China’s export module prices to stabilize around $0.12 per watt in the second half of 2026, with China’s State Administration for Market Regulation (SAMR) complicating the picture by halting, in January 2026, a proposed $7 billion industry plan to consolidate polysilicon overcapacity leaving the pace of further price support genuinely uncertain. PV-Tech reporting adds important texture to the upstream picture: polysilicon spot prices, which had collapsed to roughly CNY 34,000 per tonne by late June 2025, rebounded to above CNY 50,000 per tonne by December 2025, with some producers quoting new orders above CNY 65,000 per tonne — a more than 20% premium to actual transacted prices that signals producers testing the market’s willingness to absorb further increases before committing to volume at those levels.
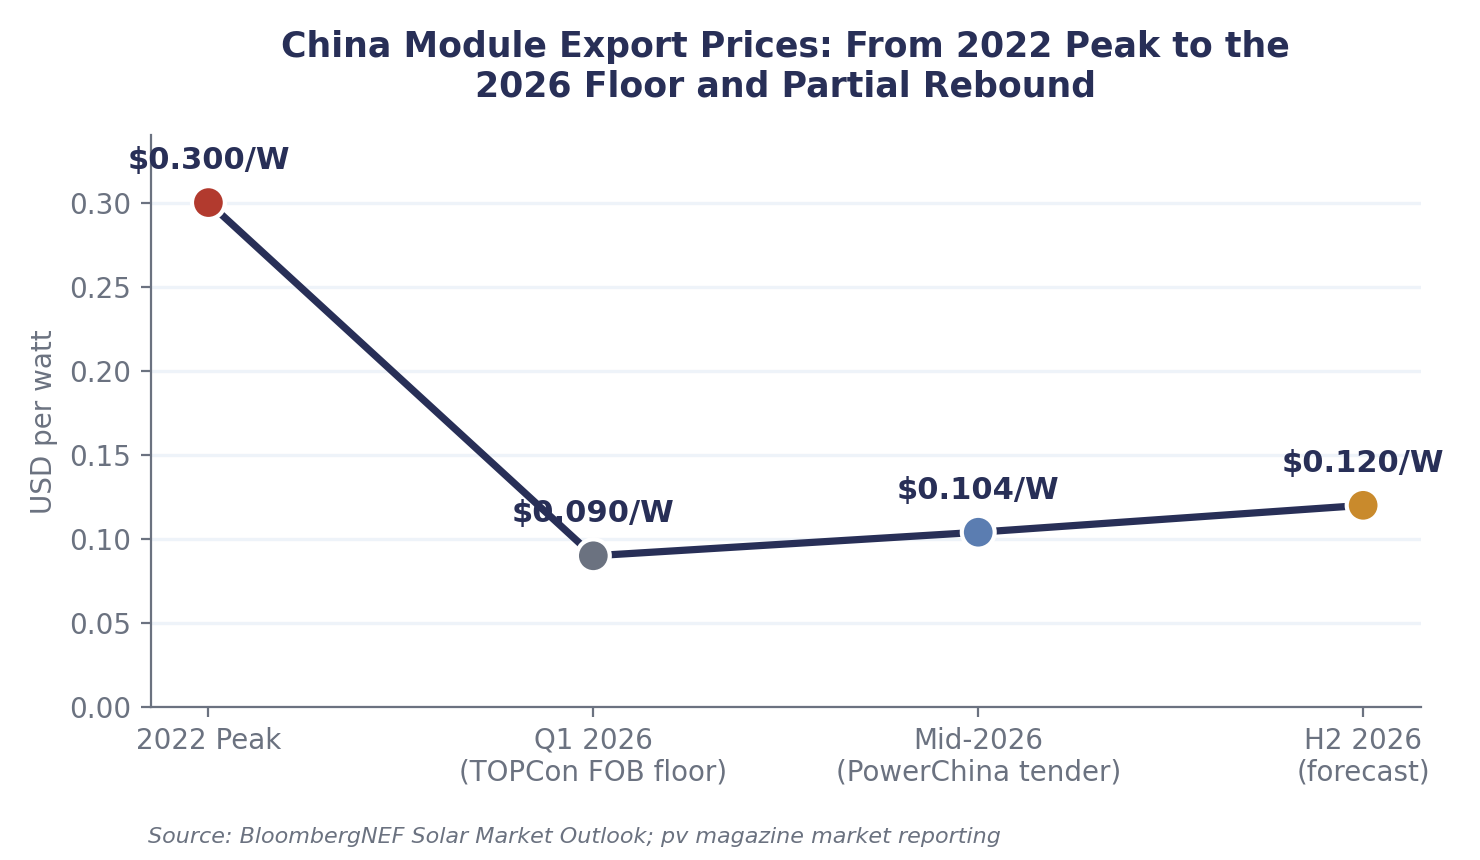
Figure 1: China module export price trajectory, 2022 peak through H2 2026 forecast.
China’s April 1, 2026 elimination of the 9% VAT export rebate on solar products has functioned as the single most consequential policy lever in this cycle, because it removed exporters’ ability to sell below variable cost and still recover margin through the tax credit. Procurement guidance compiled ahead of that deadline showed buyers accelerating orders in January 2026 at $0.086–$0.092 per watt to beat the change, versus a "post-stabilization" price of $0.108–$0.112 per watt for deliveries from May 2026 onward implying an 18–24% pricing gap tied directly to the policy’s timing. Layered on top of that shift, silver costs have surged more than 200% year-over-year, adding materially to cell production costs since silver paste can account for $0.005–$0.008 per watt of module cost, on par with or exceeding the polysilicon contribution at current, much-reduced polysilicon prices. Together, these two forces — a policy-driven price floor and a genuine input-cost increase explain why the recovery in module pricing has outpaced what oversupply data alone would predict.
Trade policy has fragmented what was once a reasonably unified global module market into at least three distinct pricing tiers. In the United States, First Solar’s second-quarter 2026 earnings call disclosed U.S. gross bookings of approximately 1.9 gigawatts at an average selling price of $0.36 per watt roughly four times the concurrent China FOB level a premium sustained by the U.S. Department of Commerce’s antidumping and countervailing duty orders on solar cells and modules from China, Cambodia, Malaysia, Thailand, and Vietnam, with some individual company duty rates finalized above 3,400%. India occupies a middle tier: First Solar’s India bookings for the first half of 2026 totaled approximately 1.1 gigawatts at an average selling price of $0.20 per watt, reflecting India’s Basic Customs Duty structure 25% on cells and 40% on modules layered specifically onto Chinese-origin imports to support the country’s Production-Linked Incentive manufacturing buildout, which had reached roughly 122 gigawatts of domestic module capacity by late 2025. China-origin FOB pricing remains the global floor, but it is decreasingly the price that most large end markets actually pay.
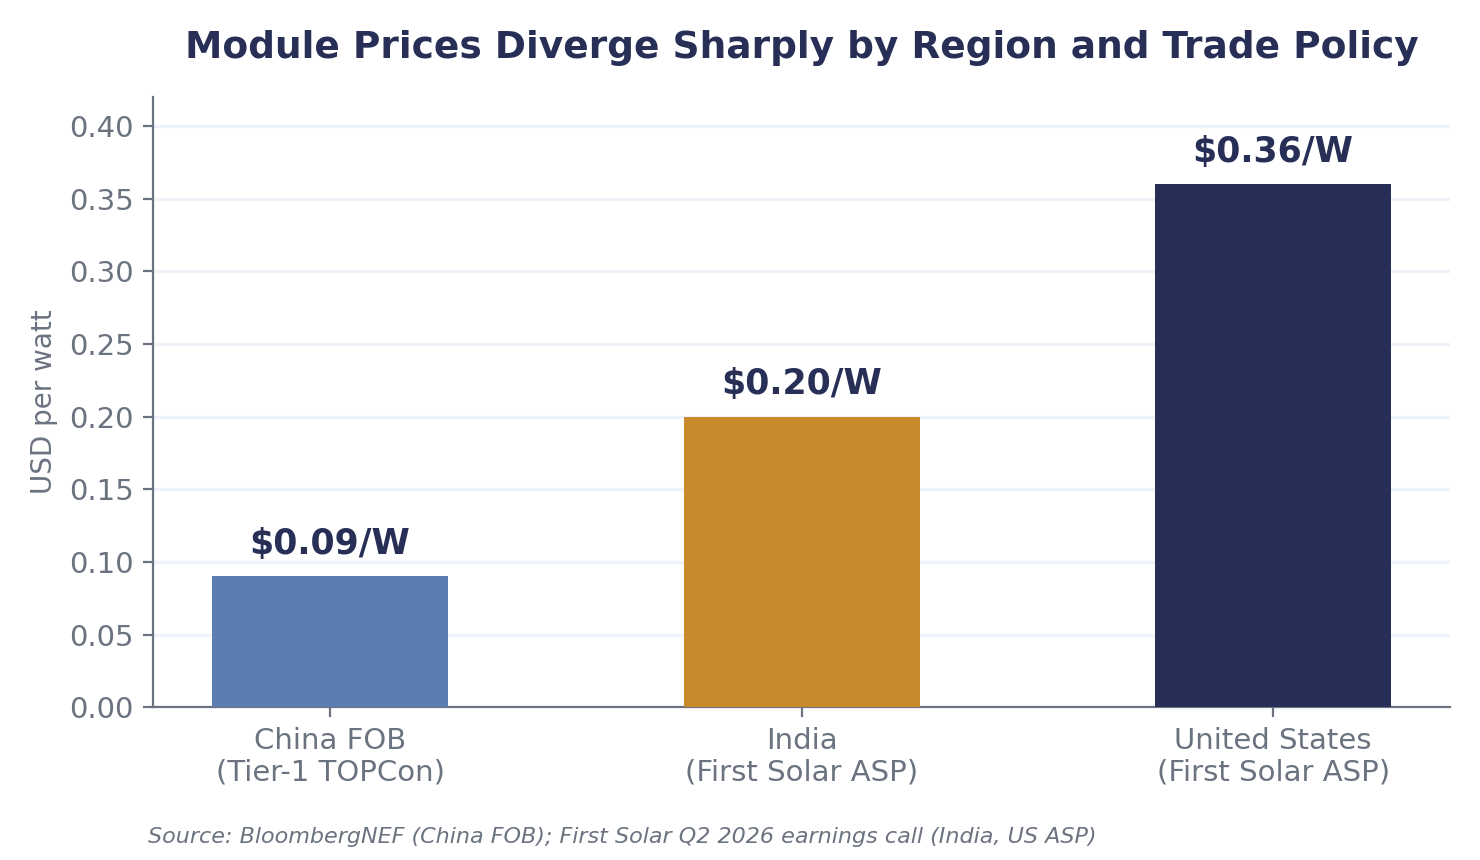
Figure 2: Module average selling price by region and trade-policy regime, Q2 2026.
First Solar’s own investor disclosures provide the clearest window into how the tariff-protected U.S. market is actually pricing. The company ended the second quarter of 2026 with a contracted backlog of 45.1 gigawatts and an aggregate transaction value of $13.6 billion, net sales of approximately $1.06 billion, a gross margin near 57%, and net income of $423 million, up roughly 24% year-over-year despite net sales declining modestly on a reported basis. Management flagged that a pending Section 232 investigation into polysilicon and derivative tariffs remains a source of policy uncertainty, holding back an estimated 1.8 gigawatts of already-finished capacity in Malaysia and Vietnam pending clarity, while guiding third-quarter 2026 module sales to a range of 3.9 to 4.5 gigawatts and full-year 2026 net sales of $4.9–$5.2 billion. The combination of a near-record backlog and continued policy overhang illustrates a market where demand visibility is strong but near-term shipment timing remains hostage to trade-policy decisions still pending in Washington.
None of the recent price firming changes the structural reality that the industry remains dramatically oversupplied. BloombergNEF estimates global module manufacturing capacity at roughly 1,100 gigawatts against forecast 2026 installation demand of just 649 gigawatts itself a year-over-year decline from 655 gigawatts in 2025 and the first drop in global solar demand in 24 consecutive years of growth. InfoLink Consulting separately estimated polysilicon inventory at over 570,000 metric tons in early 2026, equivalent to roughly 300 gigawatts of latent module supply sitting upstream of the finished-goods market. That capacity overhang is precisely why the recent price increases have been driven by coordinated policy intervention and trade barriers rather than by any genuine tightening of supply and demand manufacturers are, in effect, being pushed toward pricing discipline by government policy because market forces alone were driving the industry toward continued, unsustainable losses.
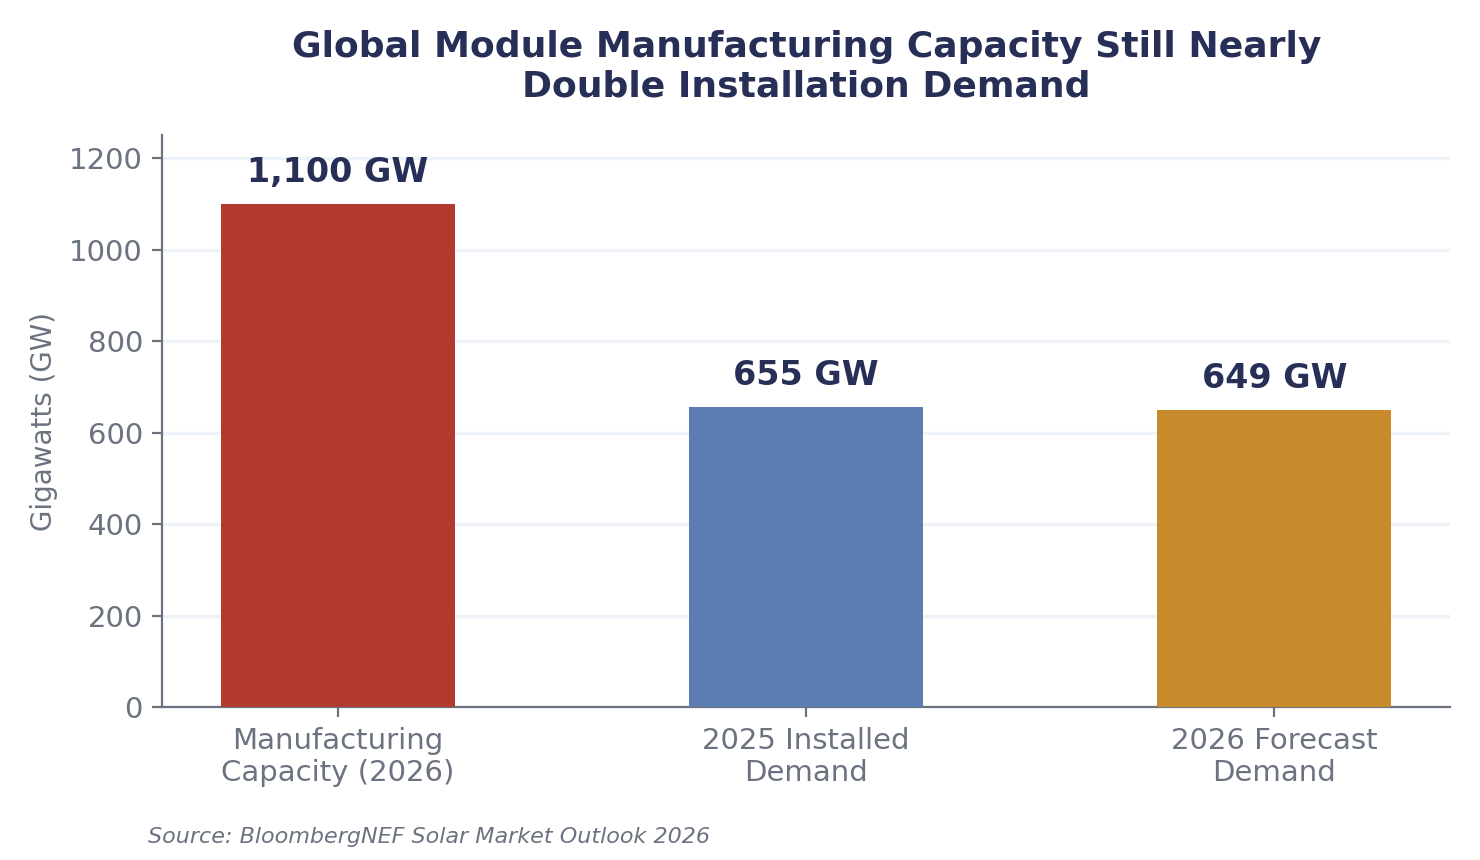
Figure 3: Global module manufacturing capacity versus installation demand, 2025–2026.
The trajectory into the fourth quarter of 2026 depends on three overlapping variables. First is whether China’s SAMR resumes its paused polysilicon consolidation effort; without it, Wood Mackenzie-style forecasts of sustained price appreciation lose their primary mechanism, and pv magazine’s sourcing suggests polysilicon prices could instead drift back toward cash-cost levels. Second is the outcome of the pending U.S. Section 232 investigation into polysilicon and derivative products, which First Solar’s own management describes as a live source of uncertainty holding back committed capacity in Southeast Asia. Third is the pace of demand recovery in China’s domestic market relative to the PowerChina tender benchmark, which at $0.103–$0.105 per watt currently sits below the $0.12 per watt level the market expects exporters to need for sustainable margins. Procurement teams evaluating supply agreements should treat the current $0.085–$0.12 per watt China FOB range as the realistic near-term band, while U.S. and India buyers should expect their respective tariff- and duty-driven premiums to persist as long as current trade policy remains in place. Taken together, the data across government tariff schedules, industry association price indices, company earnings disclosures, and independent consulting-firm forecasts point toward the same conclusion from different angles: 2026 is a year of policy-engineered price stabilization layered on top of genuine structural oversupply, not a return to either the scarcity pricing of 2021–22 or the unrestrained price collapse of 2024–25.
Pricing pressure is not distributed evenly across end-use segments, and that unevenness is itself a signal for where demand is proving most resilient. Utility-scale procurement, which prioritizes lowest landed cost and bankability over brand, has been the primary beneficiary of the China FOB price floor and continues to absorb the bulk of Southeast Asian and Chinese export volume wherever tariff exposure allows. Commercial and industrial buyers sit in between, often willing to pay a modest premium for shorter lead times or Tier-1 bankability ratings without requiring the full domestic-content premium that utility-scale U.S. projects increasingly demand to qualify for tax credit adders. Residential markets, by contrast, have proven far less price-sensitive to the swings described above, since module cost represents a comparatively small share of total installed system cost once labor, inverters, racking, and customer acquisition are included which is one reason First Solar’s premium-priced U.S. bookings have continued to clear at $0.36 per watt even as commodity-grade China FOB pricing sat roughly a quarter of that level for most of the first half of 2026.
Even with the first year-over-year demand decline in over two decades, the regional mix of solar installations is shifting in ways that matter for pricing power. BloombergNEF projects India will overtake the United States as the world’s second-largest solar market in 2026, adding over 50 gigawatts of new capacity a 6% year-over-year increase driven primarily by utility-scale projects and government-backed rooftop subsidies, and reinforcing why First Solar and other manufacturers are prioritizing India-specific capacity and pricing strategies. Beyond India, the Middle East, North Africa, and Sub-Saharan Africa are emerging as a meaningful next wave of demand, with combined installations forecast at roughly 30 gigawatts in 2026, while Southeast Asian markets including Vietnam, Thailand, and the Philippines continue adding capacity even as some of that same regional manufacturing base remains entangled in U.S. antidumping proceedings. The net effect is a demand base that is diversifying away from its historical concentration in China, the U.S., and Europe — which should, over a multi-year horizon, reduce the market’s sensitivity to any single country’s trade policy, even though in 2026 itself trade policy remains the dominant price driver.
Four variables are most likely to move Asian and global module prices over the remainder of 2026. The first is whether China’s SAMR revives its paused $7 billion polysilicon consolidation plan; PV-Tech reporting notes the regulator has given no indication the plan will resume, and without it, industry price floors depend entirely on individual producers’ voluntary discipline. The second is the timing of the pending U.S. Section 232 polysilicon and derivatives investigation, which First Solar’s own management says is holding back roughly 1.8 gigawatts of already-finished Malaysian and Vietnamese capacity pending clarity, and could either tighten U.S. supply further or, if resolved favorably for importers, compress the U.S. price premium. The third is silver: with prices up more than 200% year-over-year and silver paste now a larger share of module cost than polysilicon at current depressed polysilicon levels, any further move in precious metals markets will feed directly into cell costs faster than most producers can reprice contracts. The fourth is the pace of technology transition fromTOPCon to heterojunction (HJT) and back-contact cell architectures, which use substantially less silver — a shift industry analysis expects to reach meaningful scale only from 2027–2028, meaning silver-cost risk sits inside nearly every module contract signed through the end of this cycle.
| Date / Period | Benchmark | Price |
| 2022 (peak) | Global blended module price | ~$0.30/W |
| Sep–Oct 2025 | China component price move | +48% |
| YTD to Nov 2025 | China module price (YTD change) | +2.3% |
| Q1 2026 China FOB | Tier-1 TOPCon | $0.085–$0.095/W |
| Q2 2026 First Solar | U.S. bookings ASP | $0.36/W |
| Q2 2026 First Solar | First Solar India bookings ASP | $0.20/W |
| H2 2026 (forecast) | China module export price | ~$0.12/W |