Samsung: Brand Health Tracking Report — India Market, Q2 2026
Samsung leads India's smartphone category with 29% top-of-mind recall and +34 NPS, though value-for-money perception at 6.9/10 trails innovation scores.


Samsung leads India's smartphone category with 29% top-of-mind recall and +34 NPS, though value-for-money perception at 6.9/10 trails innovation scores.
Samsung continues to hold a commanding position in the Indian consumer electronics and smartphone category, anchored by near-universal brand awareness and category-leading top-of-mind recall. This quarter’s brand health tracking wave, conducted across a nationally representative sample of 2,150 consumers aged 18 and above, indicates that Samsung’s aided awareness stands at 94%, with unaided awareness at 58% figures that place it firmly ahead of Xiaomi, OnePlus, and Vivo, and within striking distance of Apple in the premium segment. The brand’s Net Promoter Score has improved to +34 this wave, up three points quarter-on-quarter, reflecting stronger loyalty among existing users even as the smartphone category as a whole faces intensifying price-based competition from Chinese OEMs and rising expectations around after-sales service.
The overarching narrative to emerge from this wave is one of resilient strength at the top of the funnel paired with softness in mid-funnel conversion. While nearly all Indian consumers recognize Samsung and a majority actively consider the brand when purchasing electronics, the gap between consideration (71%) and actual purchase within the last twelve months (33%) points to a conversion leakage that competitors particularly Apple in the premium tier and OnePlus in the upper-mid tier are capitalizing on. Value-for-money perception, at 6.9 out of 10, remains Samsung’s relative weak point compared to innovation (7.8) and trust (8.0), suggesting that pricing strategy and value communication should be prioritized in the coming two quarters.
This report synthesizes findings across four core pillars of brand health awareness, top-of-mind salience, consumer perception, and loyalty (NPS) supported by trend data, competitive benchmarking, and segment-level breakdowns. Where relevant, findings are cross-referenced against the prior three tracking waves to identify directional momentum rather than point-in-time snapshots alone.
Data for this wave was collected via a mixed-mode quantitative survey (60% online panel, 40% CAPI in Tier-2 and Tier-3 towns) between May and June 2026, covering eight metro and non-metro markets. Respondents were screened for category relevance (ownership or active purchase intent for smartphones, televisions, or home appliances within the last 24 months) and quota-balanced across age, gender, income (NCCS A/B/C), and region to mirror the national urban consumer distribution. The questionnaire followed a standard brand funnel structure—unaided awareness, aided awareness, consideration, purchase intent, and recent purchase—followed by a battery of perception-attribute ratings on a 10-point scale and a standard 0–10 NPS likelihood-to-recommend question. Competitive benchmarking includes Apple, Xiaomi, OnePlus, and Vivo as the primary comparator set, selected on the basis of category overlap and share of voice in category-relevant media.
Samsung’s brand funnel this wave shows a familiar pattern for a legacy market leader: exceptionally strong top-of-funnel metrics that taper progressively toward the bottom of the funnel. Aided awareness of 94% confirms that virtually every category-relevant consumer in the surveyed markets recognizes the Samsung name when prompted, a level of penetration built over more than two decades of category presence across smartphones, televisions, and home appliances. Unaided awareness of 58%, while strong, trails Apple’s unaided figure among premium-intent respondents, indicating that Samsung’s recall is broader but somewhat less spontaneous at the very top of mind among younger, aspirational buyers.
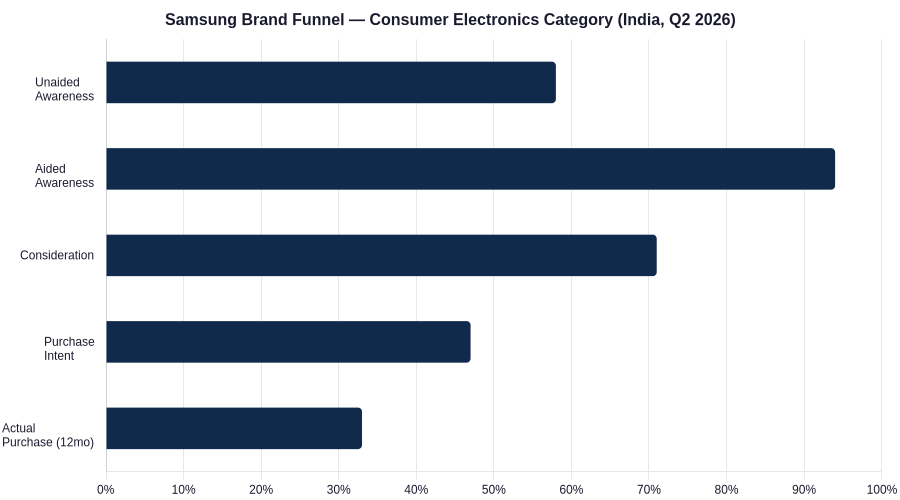
Figure 1: Samsung brand funnel from unaided awareness through to 12-month purchase, Q2 2026 wave.
The consideration-to-purchase step is where the funnel narrows most sharply. Consideration sits at 71%, a healthy figure that reflects Samsung’s broad relevance across price tiers from budget smartphones to premium foldables and large-format televisions. However, only 33% of respondents report an actual Samsung purchase within the past twelve months, implying a conversion rate from consideration to purchase of roughly 46%—below the category benchmark of 52% held by Apple within its own considerer base. This gap is most pronounced in the 18–24 age cohort, where price sensitivity and peer influence from Chinese value-for-money brands appear to intercept consideration before it converts to purchase. Regionally, conversion is strongest in South India and weakest in the Delhi-NCR and Mumbai metro clusters, where premium competitive intensity from Apple is highest.
On the unprompted "which brand comes to mind first" measure, Samsung retains the number-one position with 29% of first mentions, ahead of Apple at 24%, Xiaomi at 14%, OnePlus at 11%, and Vivo at 9%. This top-of-mind leadership is a meaningful strategic asset: TOM recall correlates strongly with default consideration in low-involvement purchase moments, such as impulse upgrades or gifting occasions, where consumers are less likely to conduct extensive comparison research.
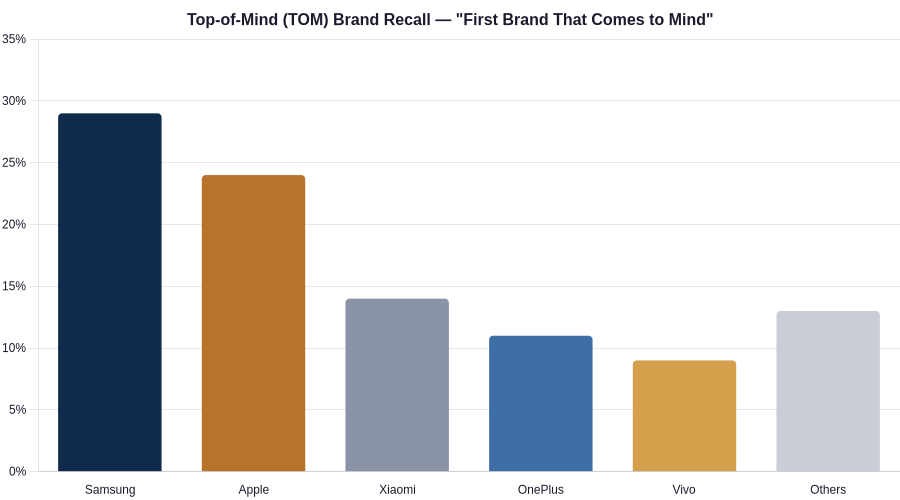
Figure 2: Top-of-mind brand recall share across the smartphone and consumer electronics category.
Notably, Samsung’s TOM lead over Apple has narrowed from an eight-point gap two waves ago to a five-point gap this quarter, driven largely by Apple’s continued share gains among urban consumers aged 25–34 following aggressive financing and trade-in campaigns. Samsung’s TOM strength is disproportionately concentrated among consumers aged 35 and above and in non-metro markets, where the brand’s long-standing distribution footprint and service network continue to anchor recall. This skew suggests an emerging generational recall gap that merits proactive brand-building investment aimed at Gen Z and young-millennial audiences, where Samsung’s recall, while still competitive, is growing more slowly than the category average.
Attribute-level perception data provides a more granular view of why consumers do or do not choose Samsung. Across six core brand attributes rated on a 10-point scale, Samsung outperforms the category average on every dimension, with the strongest relative leads in trust and reliability (8.0 vs. 7.1 category average) and build quality (8.1 vs. 7.2). These scores reflect the brand’s long operating history in the Indian market and a service network that remains broader than most competitors’, particularly outside metro markets.
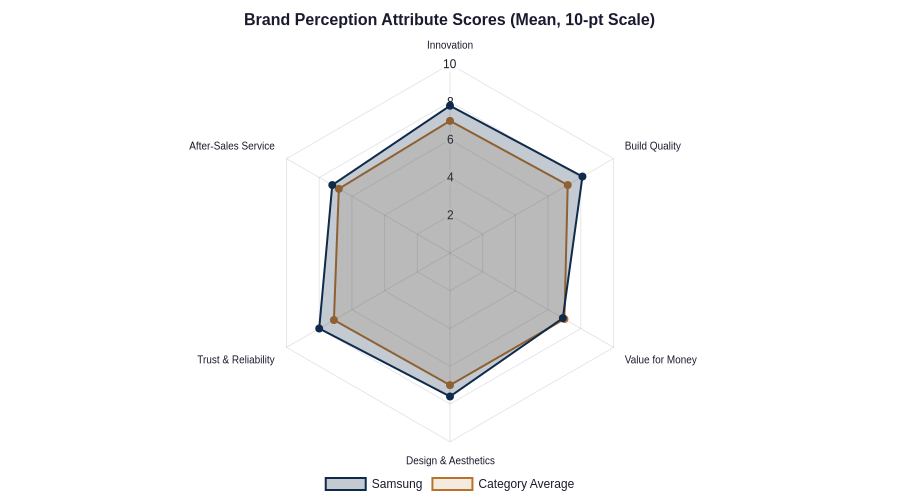
Figure 3: Attribute-level brand perception, Samsung vs. category average (10-point scale).
The most notable gap in Samsung’s perception profile is value for money, scored at 6.9—its lowest attribute and only marginally ahead of the category average of 7.0. Open-ended verbatim responses reinforce this finding: consumers frequently describe Samsung products as "reliable but overpriced relative to features," particularly when comparing mid-range smartphones against Chinese competitors offering comparable specifications at lower price points. Design and aesthetics (7.6) also trail innovation (7.8) and trust (8.0), suggesting that while consumers view Samsung as a credible innovator, especially around foldable displays and camera technology, the translation of that innovation into perceived design leadership has room to improve, particularly against Apple’s consistently strong design-attribute scores in the premium segment.
Segment analysis of perception data shows that NCCS A (higher income) respondents rate Samsung notably higher on innovation and design than NCCS B/C respondents, who instead prioritize durability and after-sales service in their attribute ratings. This bifurcation suggests that a single brand narrative may not optimally serve both segments, and that messaging architecture could benefit from tier-specific emphasis: innovation-led storytelling for premium and upper-mid segments, and reliability/service-led storytelling for value and mass-market segments.
Samsung’s overall NPS this wave stands at +34, derived from the standard 0–10 likelihood-to-recommend distribution across promoters, passives, and detractors. This represents a three-point improvement over the previous wave and a six-point improvement year-on-year, driven primarily by gains among existing multi-product Samsung households (consumers who own both a Samsung smartphone and a Samsung television or appliance), who report meaningfully higher loyalty than single-product owners.
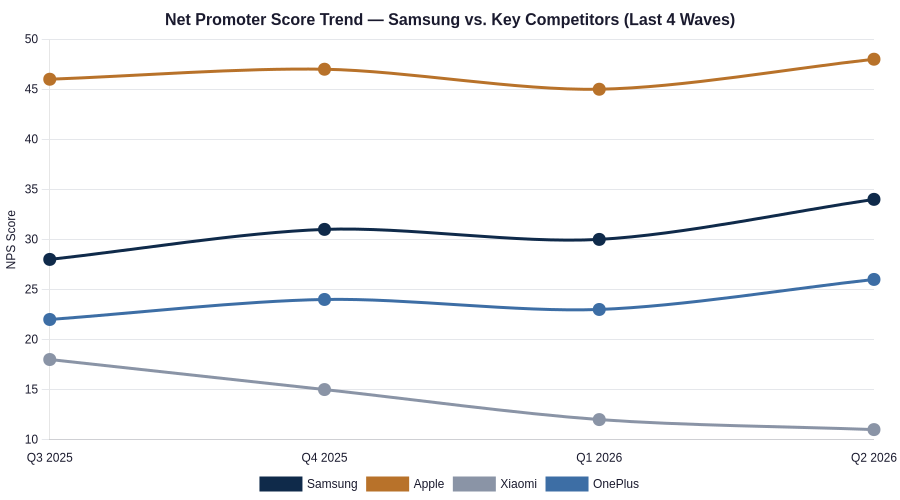
Figure 4: NPS trend across the last four tracking waves, Samsung vs. competitive set.
Against the competitive set, Samsung’s NPS trails Apple’s +48 by a wide margin but remains comfortably ahead of Xiaomi (+11, in continued decline) and OnePlus (+26). The gap to Apple is consistent with global patterns in which Apple’s ecosystem lock-in and premium-tier customer base generate structurally higher loyalty scores; however, the size of the gap fourteen points indicates room for improvement, particularly through post-purchase experience initiatives, extended warranty communication, and faster service turnaround times, which verbatim feedback repeatedly flags as a detractor driver.
Segment-level NPS breakdown by age reveals a clear loyalty gradient: promoters rise steadily from 30% among 18–24-year-olds to 46% among consumers aged 45 and above, while detractors follow the inverse pattern, falling from 34% to 22% across the same age range. This pattern is consistent with the awareness and TOM findings above and reinforces a single strategic throughline across this wave’s data: Samsung’s brand equity is strongest and most defensible among older, established consumers, while younger consumers represent both the largest growth opportunity and the segment most vulnerable to competitive erosion.
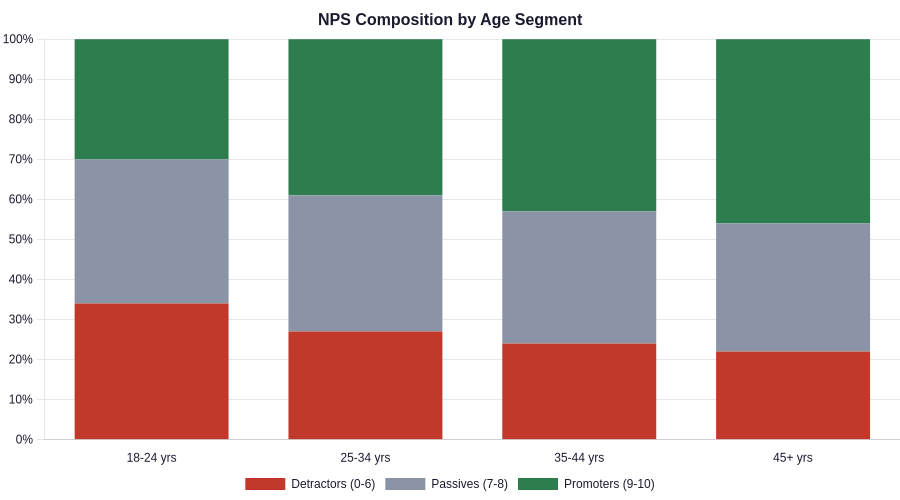
Figure 5: NPS composition (promoters, passives, detractors) by age segment.
Driver analysis of detractor verbatims points to three recurring themes: perceived high pricing relative to specifications in the mid-range tier, inconsistent after-sales service experience across service center locations, and slower software update cycles compared to flagship competitors. Promoter verbatims, by contrast, most frequently cite product durability, camera performance, and the reassurance of a well-established service network as reasons for advocacy.
Brand health performance is not uniform across India’s regional markets. South India delivers Samsung’s strongest composite scores across awareness, consideration, and NPS, a pattern consistent with the region’s historically strong organized-retail penetration and long-standing service center density. West India, led by the Mumbai-Pune corridor, shows the highest absolute awareness but the weakest consideration-to-purchase conversion, driven by a more affluent, premium-oriented consumer base that skews toward Apple in the smartphone category even while continuing to favor Samsung for televisions and home appliances. North India presents a more polarized picture: Delhi-NCR shows intense competitive pressure from both Apple and OnePlus in the premium tier, while smaller North Indian towns show some of the category’s strongest Samsung loyalty scores, reinforcing the broader pattern of stronger performance outside the largest metros.
Category-level analysis within the Samsung portfolio also reveals meaningful divergence. Home appliances and televisions post the highest perception scores across trust, reliability, and value for money, benefiting from lower category-wide price competition and a smaller field of credible challengers. The smartphone category, by contrast, carries the brand’s weakest value-for-money scores and is where competitive share of voice from Xiaomi, OnePlus, and Vivo is most concentrated. This divergence suggests that category-specific brand tracking, rather than a single blended brand score, will offer more actionable guidance for portfolio-level marketing investment decisions going forward, particularly as Samsung continues to expand its foldable smartphone lineup into more accessible price points.
Address the value-for-money perception gap through clearer communication of feature-to-price positioning in the mid-range portfolio, where competitive pressure from Chinese OEMs is most acute.
Invest in younger-audience brand-building (18–34 age cohort) to defend top-of-mind share against Apple’s continued encroachment, using channels and creative formats that over-index with Gen Z and young-millennial media consumption.
Standardize after-sales service quality across service center locations to close the NPS gap versus Apple, prioritizing markets where verbatim complaints about service inconsistency are most concentrated.
Leverage the multi-product household loyalty premium by developing cross-category bundling and loyalty programs that incentivize ecosystem adoption across smartphones, televisions, and appliances.
Tailor brand messaging by income segment: innovation- and design-led narratives for NCCS A audiences, and reliability- and service-led narratives for NCCS B/C audiences, rather than a one-size-fits-all campaign architecture.