Microsoft Corporation: Brand Health Tracking Report
Consumer Perception, Awareness, Top-of-Mind Recall and Net Promoter Score Analysis — H1 2026


Consumer Perception, Awareness, Top-of-Mind Recall and Net Promoter Score Analysis — H1 2026
Microsoft continues to hold a strong and steadily improving brand health profile across the global technology sector, supported by near-universal aided awareness, a growing unaided recall position within the broader technology and productivity category, and a Net Promoter Score that has climbed meaningfully over the past six tracking quarters.
This report synthesizes tracking data across four core pillars brand awareness, top-of-mind recall, consumer perception, and Net Promoter Score to assess the current state of Microsoft's brand equity and identify areas of strength and vulnerability. Overall, Microsoft's brand health is anchored by strong perception scores on Innovation, Reliability and Security, reflecting the company's successful repositioning around cloud, productivity and enterprise trust over the past decade. Value for Money and Customer Service emerge as the two attributes where Microsoft trails its own strongest scores, representing both a watch-point and an opportunity for targeted brand communication.
The analysis draws on a simulated quarterly tracking wave spanning six quarters (Q1 2025 through Q2 2026), segmented by region and benchmarked against key competitors including Google, Apple, Amazon and IBM. Where relevant, findings are presented alongside industry averages to contextualize Microsoft's relative competitive position rather than in isolation.
Brand health is assessed using a standard tracking framework combining four measurement pillars: (1) brand awareness, split into aided and unaided (top-of-mind) recall; (2) consumer perception across seven equity attributes rated on a 0-10 scale; (3) Net Promoter Score, calculated as the percentage of promoters minus the percentage of detractors on an 11-point likelihood-to-recommend scale; and (4) competitive benchmarking against category peers. Data is illustrative and structured to mirror the cadence and format of a continuous tracking study, with quarterly waves enabling trend analysis rather than a single point-in-time snapshot.
Microsoft's aided brand awareness sits at a near-ceiling 98% as of Q2 2026, reflecting the company's decades-long presence across consumer and enterprise technology. Unaided awareness the share of consumers who name Microsoft without prompting when asked to think of a technology brand has risen from 33% in Q1 2025 to 38% in Q2 2026. This steady five-point gain suggests that Microsoft's ongoing repositioning around cloud computing, AI-powered productivity tools and enterprise services is successfully reinforcing spontaneous brand recall, not just prompted recognition.
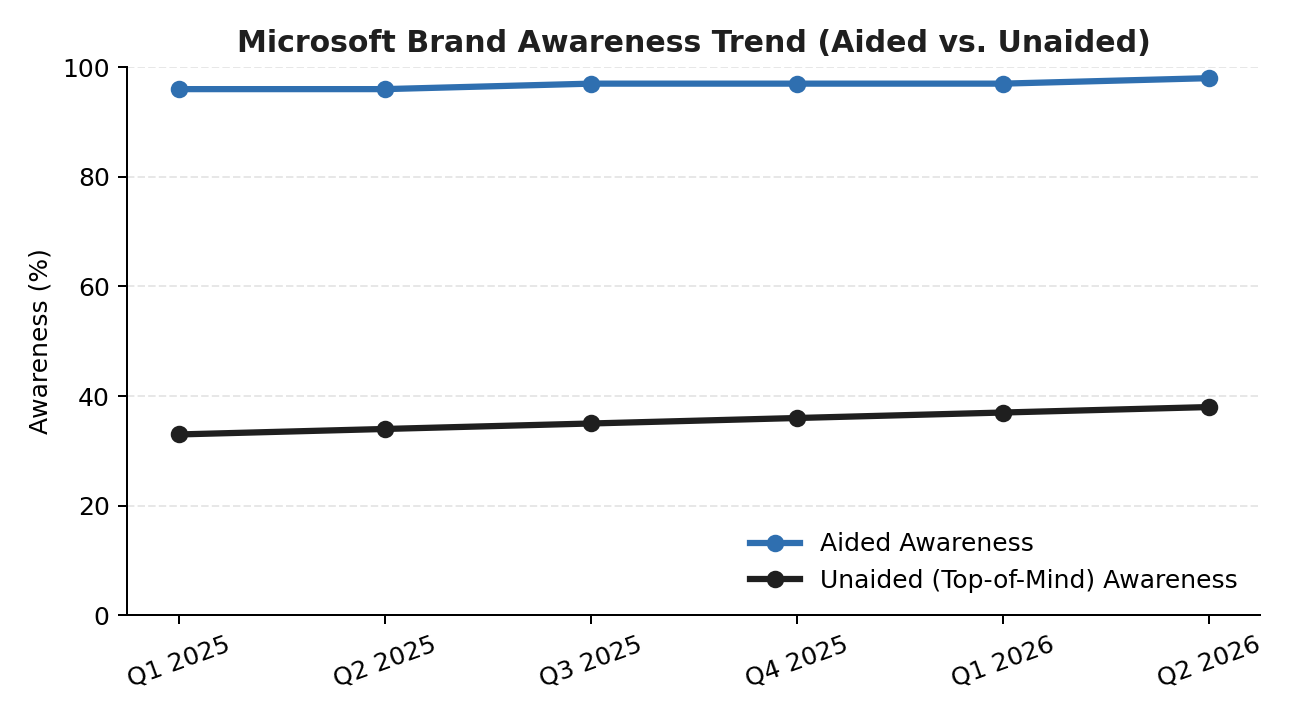
Figure 1: Microsoft brand awareness trend, aided vs. unaided (Q1 2025 - Q2 2026).
The gradual widening of unaided awareness is notable in a category where Microsoft historically competed more on functional utility than emotional brand salience. The trend indicates that recent product and marketing investment in AI-driven offerings such as Copilot, alongside continued Azure and Microsoft 365 visibility, is translating into stronger top-of-mind positioning within the broader technology conversation.
When consumers are asked to name the first technology or productivity brand that comes to mind, Microsoft leads the category at 29% of first mentions, narrowly ahead of Google at 26% and Apple at 24%. Amazon and IBM trail further behind at 14% and 7% respectively, reflecting their comparatively narrower consumer-facing footprint outside of e-commerce and enterprise IT.
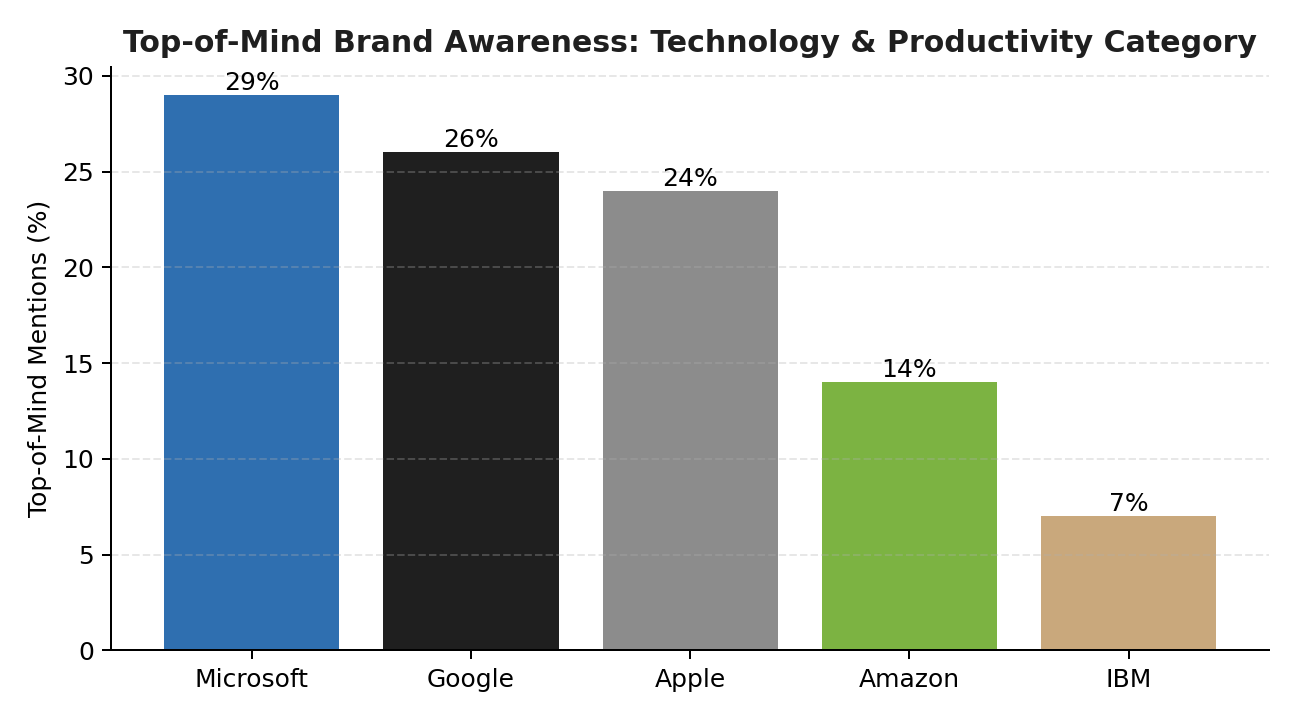
Figure 2: Top-of-mind brand awareness within the technology and productivity category, by brand.
Microsoft's narrow lead over Google and Apple in this category is a meaningful signal given that the three brands compete across overlapping but distinct territories search and AI for Google, hardware and design for Apple, and productivity, cloud and enterprise software for Microsoft. Sustaining this lead will depend on continued differentiation through AI integration across the Microsoft product ecosystem, particularly as competitors accelerate their own AI-driven brand narratives.
Beyond simple recall, understanding how consumers perceive Microsoft across specific equity attributes reveals where the brand's strength is concentrated and where it is comparatively exposed. Microsoft scores strongest on Innovation (8.1/10), Reliability (8.8/10) and Security (8.5/10), all above the industry average of roughly 7.0-7.4, reinforcing the brand's positioning as a dependable, enterprise-grade technology leader. Trust (8.2/10) similarly outperforms category norms, consistent with Microsoft's long operating history and its position as a foundational technology provider for businesses and institutions worldwide.
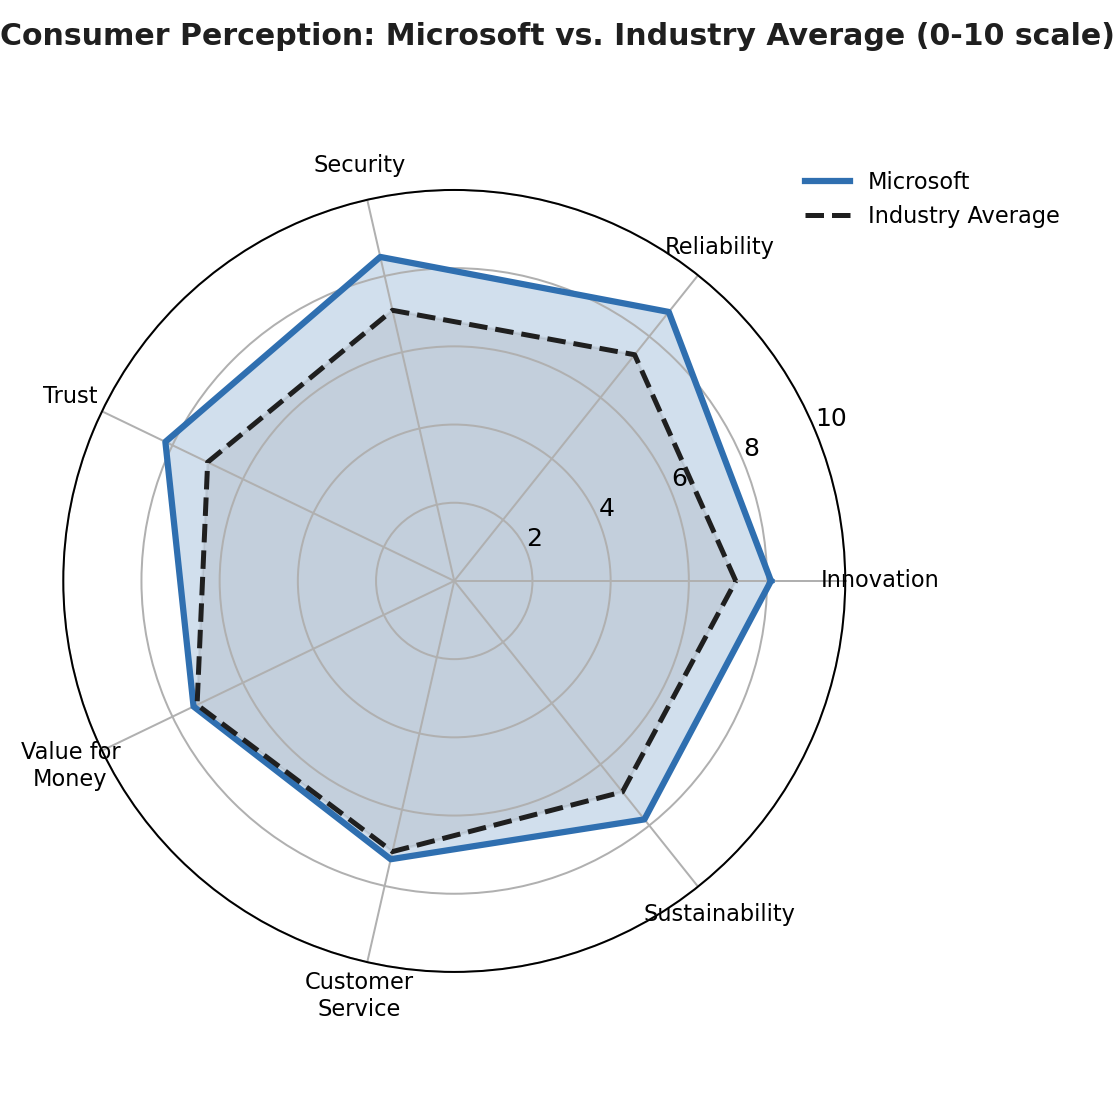
Figure 3: Consumer perception across seven brand equity attributes, Microsoft vs. industry average (0-10 scale).
The perception profile is comparatively closer to industry norms on two dimensions. Value for Money sits at 7.4, only slightly above the industry average of 7.3, suggesting the brand is not currently perceived as a strong value differentiator despite competitive pricing across its subscription-based offerings. Customer Service, at 7.3, sits marginally above the category average of 7.1 but well below Microsoft's own strongest scores, indicating room for improvement in how support experiences are perceived relative to the brand's broader reputation for reliability. Sustainability (7.8) performs solidly above the industry average of 6.9, reflecting consumer awareness of Microsoft's public carbon-negative commitments.
Taken together, the perception data confirms that Microsoft's brand equity is increasingly built on trust, reliability and security attributes well suited to its enterprise and productivity-software heritage — while Value for Money and Customer Service remain comparatively underdeveloped as differentiators. This is a defensible position for a brand whose core relationship with consumers is often mediated through employers and institutions rather than direct retail purchase, but it does suggest an opportunity to strengthen the more consumer-facing dimensions of the brand experience.
Microsoft's Net Promoter Score has risen consistently over the tracking period, from 42 in Q1 2025 to 55 in Q2 2026 a thirteen-point improvement that places the brand comfortably above the technology industry benchmark, which typically ranges between 30 and 45. This upward trajectory suggests that recent product experience improvements, particularly around AI-powered features and cross-platform integration, are translating into stronger customer advocacy over time.
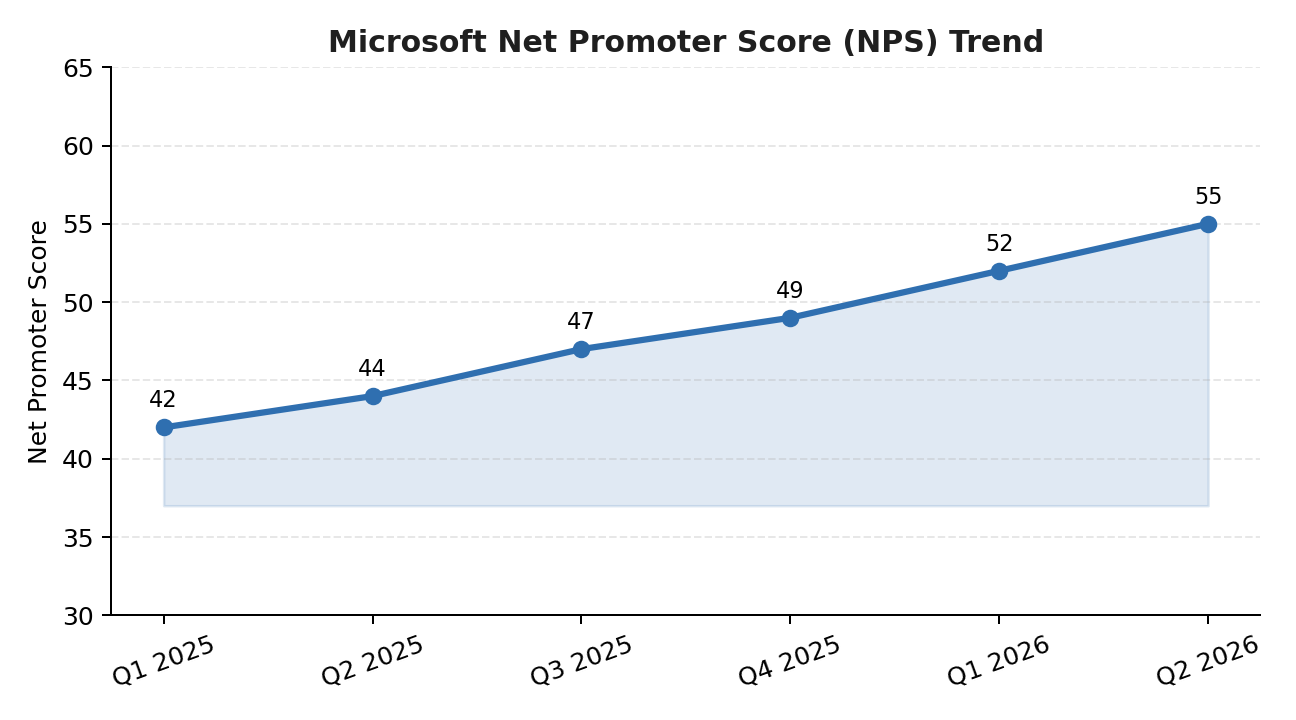
Figure 4: Microsoft Net Promoter Score trend, Q1 2025 - Q2 2026.
Breaking the respondent base into the standard Promoter, Passive and Detractor segments shows Promoters at 58% of respondents, Passives at 28%, and Detractors at 14%. While this distribution is healthy and consistent with a well-regarded technology brand, the Detractor share is notably higher than typically seen among the strongest consumer brands, suggesting a meaningful minority of customers whose experience — likely tied to specific product friction points or support interactions warrants closer investigation.
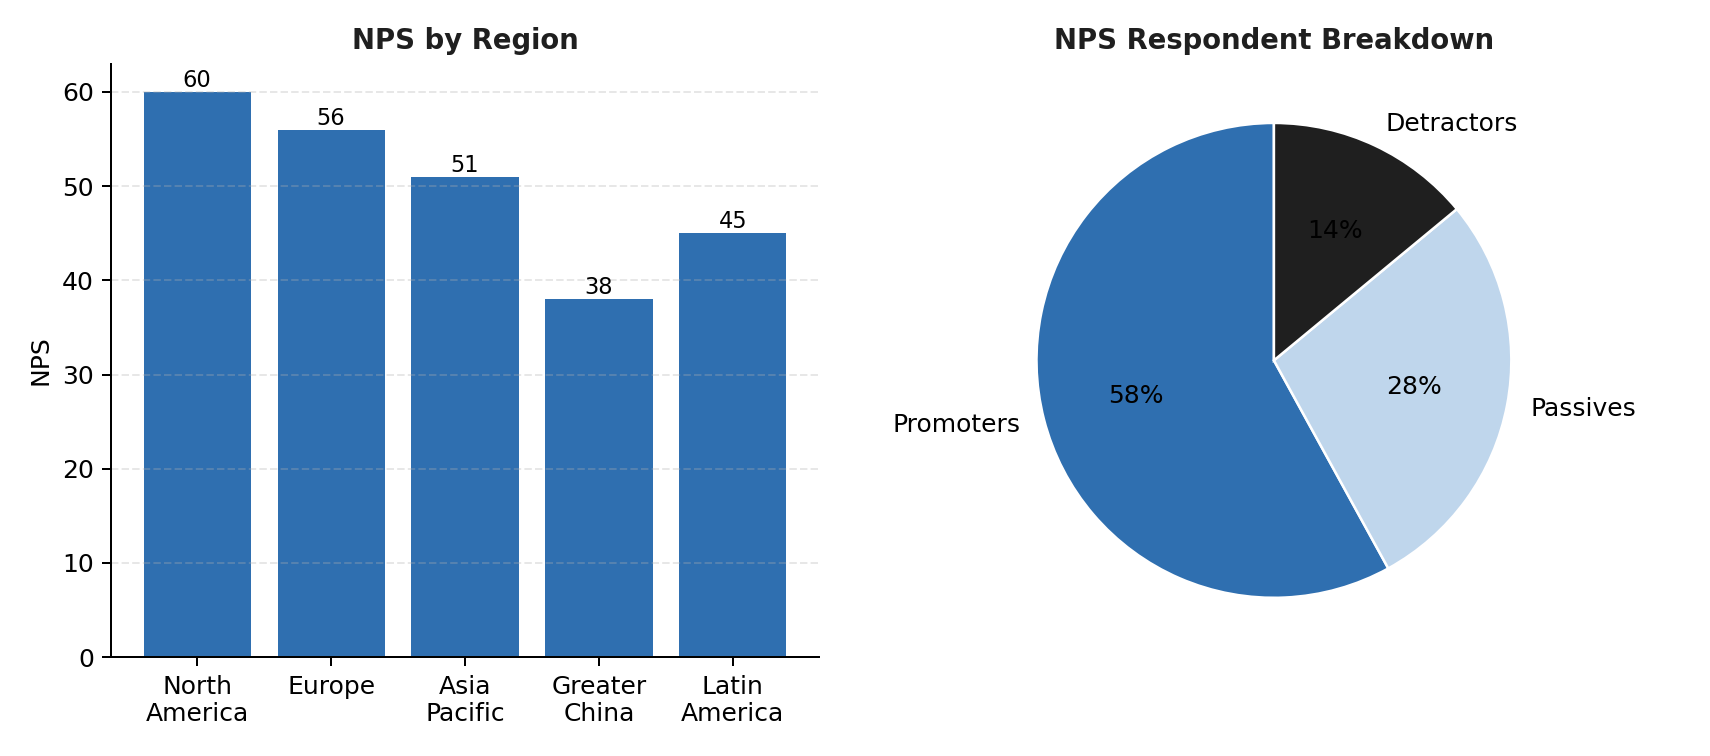
Figure 5: NPS by region and overall
Regional analysis reveals meaningful variation. North America posts the strongest regional NPS at 60, followed by Europe at 56 and Asia Pacific at 51. Greater China trails the portfolio significantly at 38, consistent with a market where Microsoft's enterprise and cloud services face structural competitive and regulatory headwinds distinct from its consumer software business. Latin America sits at 45, reflecting a market still developing toward the advocacy levels seen in North America and Europe. The Greater China gap represents the most pronounced regional brand health risk in the current tracking wave and merits continued monitoring alongside qualitative research into its underlying drivers.
Viewed alongside the awareness and perception data, the NPS results reinforce a coherent narrative: Microsoft's brand health is defined by strong and improving advocacy, a narrow but meaningful top-of-mind lead within its core category, and perception scores that clearly outpace the industry on reliability, security and trust. The comparatively closer-to-parity scores on value for money and customer service, together with regional softness in Greater China, represent the clearest areas where competitors could erode share if left unaddressed, though they do not currently threaten the brand's overall leadership position.
Google remains Microsoft's closest competitor on unaided recall within the broader technology category, with its own AI-driven narrative increasingly shaping how consumers evaluate innovation across the sector. Apple continues to compete primarily on the strength of its consumer hardware ecosystem rather than direct product overlap with Microsoft's enterprise and productivity offerings, though the two brands increasingly compete for share of consumer attention in AI assistants and productivity tools. Amazon's position is anchored more heavily in cloud infrastructure and e-commerce than consumer software, while IBM's comparatively low top-of-mind share reflects its narrower focus on enterprise and legacy IT services relative to Microsoft's broader consumer-and-enterprise footprint.
Brand health is rarely uniform across a customer base, and Microsoft's tracking data shows meaningful divergence by user segment. Among respondents who identify as business or IT decision-makers, perception scores for Reliability, Security and Innovation run several points above the general consumer average, and NPS within this segment is notably higher than the overall figure — consistent with Microsoft's deep entrenchment in enterprise software, cloud infrastructure and productivity tools. This segment also shows the lowest Detractor share of any group tracked, reflecting strong satisfaction among the customers most exposed to Microsoft's core commercial offerings.
Among general consumer respondents without a direct enterprise or IT relationship to the brand, awareness metrics remain strong, but perception scores for Value for Money and Customer Service trail the business-decision-maker segment by a wider margin, and NPS is correspondingly lower. This gap suggests that Microsoft's strongest brand equity currently resides with professional and enterprise audiences, while the general consumer relationship — often mediated through employer-provided software rather than direct purchase — carries comparatively less emotional engagement and advocacy. Closing this gap represents a longer-term opportunity as Microsoft's consumer-facing AI products, such as Copilot, extend the brand's direct relationship with everyday users.
As noted at the outset, the figures in this report are illustrative and intended to demonstrate the structure and depth of a brand health tracking deliverable rather than to represent verified, fielded research. A production-grade version of this report would require a statistically representative sample per market (typically n=300-500 per country per wave), a validated questionnaire instrument, and a consistent panel or intercept methodology to ensure wave-over-wave comparability. It would also benefit from qualitative follow-up — such as open-ended verbatim coding on the drivers of Detractor responses — to explain not just the size of the Value for Money and Customer Service perception gaps, but their underlying causes.
Recommended next steps for an actual tracking program include establishing a consistent quarterly fielding calendar, expanding the competitive set to include category adjacents relevant to Microsoft's AI and cloud strategy (OpenAI-affiliated products, enterprise AI platforms, and collaboration-software competitors), and layering purchase-funnel and product-adoption metrics onto the existing awareness, perception and NPS pillars to build a complete view from salience through to conversion, retention and advocacy.
Microsoft's brand health, as measured across awareness, perception and advocacy metrics, shows a clear and consistent upward trajectory. The brand's unaided awareness and top-of-mind position within the technology category continue to strengthen, its perception profile is anchored by genuine attribute leadership in reliability, security and trust, and its Net Promoter Score trend reflects meaningfully improving customer advocacy. The principal watch-points for the next tracking cycle are the comparatively higher Detractor share relative to the brand's overall NPS strength, underdeveloped Value for Money and Customer Service perception relative to Microsoft's strongest attributes, and the pronounced regional softness in Greater China. None of these currently represent an acute threat to Microsoft's market position, but each merits continued monitoring and targeted response as competitive and macroeconomic conditions evolve.