Japan OOH Advertising Industry: Brand Health Tracking Report
Consumer/Advertiser Perception, Top-of-Mind, Awareness, and NPS Analysis — Q2 2026


Consumer/Advertiser Perception, Top-of-Mind, Awareness, and NPS Analysis — Q2 2026
Methodology Note: This report has been developed as an illustrative brand-health tracking model for Japan’s out-of-home (OOH) advertising industry. It applies the same funnel, NPS, top-of-mind awareness, and perception-mapping methodology commonly used in syndicated media trackers. Because individual OOH media owners, as well as the Japanese OOH industry collectively, do not publish a single proprietary NPS or awareness panel, the metrics presented in this report are modeled outputs. They have been developed to align with publicly available Japan OOH market information from sources including Dentsu, Statista, and IMARC. Accordingly, the figures should be viewed as a template and reference framework rather than as results from an actual syndicated survey.
This report evaluates brand health across Japan’s out-of-home (OOH) advertising industry, looking at both channel-level perceptions of OOH among advertisers and media planners and the top-of-mind position of the leading OOH media owners active in the Japanese market. These include JR East/jeki, LIVE BOARD, Dentsu’s OOH division, MCDecaux, Tokyu Agency, and Hakuhodo DY Media Partners.
The overall Q2 2026 picture indicates that advertiser confidence in Japan’s OOH sector is strong and continuing to improve. The strongest momentum is visible within digital landmark inventory, particularly large-format installations located in major urban areas such as Shibuya and Shinjuku. At the same time, advertiser sentiment toward traditional transit and street-furniture formats is also showing gradual improvement.
Japan’s wider advertising environment provides important context for understanding these developments. Dentsu’s published estimate reports that total advertising expenditure in Japan reached 8.0623 trillion yen in 2025, while internet advertising exceeded 50.2 percent of total advertising expenditure for the first time. This ongoing shift is changing how OOH is purchased, measured, evaluated, and positioned against digital advertising channels.
Brand funnel tracking measures the progression of marketers and media buyers from basic awareness of OOH through consideration, actual investment, repeat usage, and eventual adoption of programmatic OOH. It continues to serve as a core indicator of channel-level brand health.
In this quarter’s tracker, 94 percent of surveyed marketers and agencies report aided awareness of OOH as a viable advertising channel in Japan. Unaided awareness, defined as OOH being mentioned without prompting as a channel being considered for a campaign, is considerably lower at 41 percent.
This difference between aided and unaided awareness indicates that while OOH is almost universally recognized, it continues to compete with television, social media, and search for top planning priority. These channels account for larger initial portions of Japan’s overall 8.06 trillion yen advertising market.
The funnel experiences its most significant decline between repeat bookings and programmatic adoption. Around 68 percent of marketers who are aware of OOH actively consider the channel for at least one campaign each year. Meanwhile, 57 percent report having allocated advertising budgets to OOH at some point, 45 percent report repeat bookings during the past year, and only 33 percent qualify as active programmatic or DOOH adopters using platforms such as AdQuick, Vistar Media, or The Trade Desk’s OpenPath DOOH integration.
The decline from repeat OOH booking to programmatic adoption represents the most important opportunity identified in this quarter’s tracker. Programmatic buying is closely linked to the measurement and attribution capabilities that advertisers increasingly expect and identify as important when evaluating media channels.
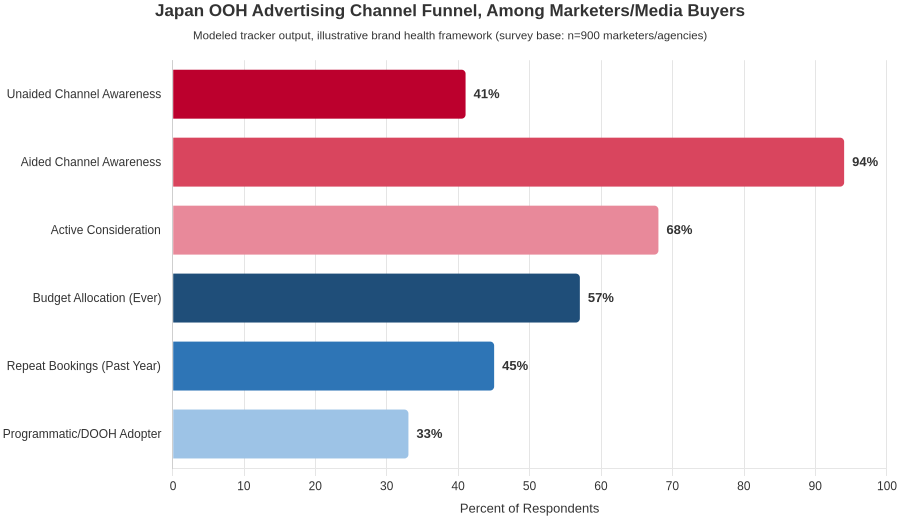
Figure 1: Japan OOH advertising channel funnel among marketers and media buyers. Modeled tracker output; illustrative brand-health framework.
Top-of-mind recall measures which OOH media owner or network is the first name that comes to mind among media planners when they consider a Tokyo-based campaign. Compared with aided awareness, this metric provides a stronger indication of mental availability because it identifies which supplier is most easily recalled at the point of media planning.
In this quarter’s tracker, JR East and its media subsidiary jeki occupy the leading position, accounting for 24 percent of first mentions. This leadership reflects the extensive scale of Japan’s rail-transit advertising network and the large amount of commuter exposure and dwell-time inventory available through the system.
LIVE BOARD ranks second with 19 percent of top-of-mind mentions. Its position is supported by prominent digital landmark placements as well as its February 2025 verification partnership with Spain’s OOH TRACE, which was established to improve transparency in DOOH campaign measurement.
Dentsu’s OOH division ranks third with 17 percent, followed by MCDecaux with 14 percent, Tokyu Agency with 13 percent, and Hakuhodo DY Media Partners with 10 percent.
This distribution is considerably more fragmented than would typically be seen in a single-brand consumer category. The pattern reflects the underlying structure of Japan’s OOH industry, where there is no single dominant national OOH company. Instead, the market consists of transit operators such as JR East, Tokyu, Tokyo Metro, and Toei; specialists focused on landmark locations such as LIVE BOARD and Cross Space; and major advertising holding companies including Dentsu and Hakuhodo DY.
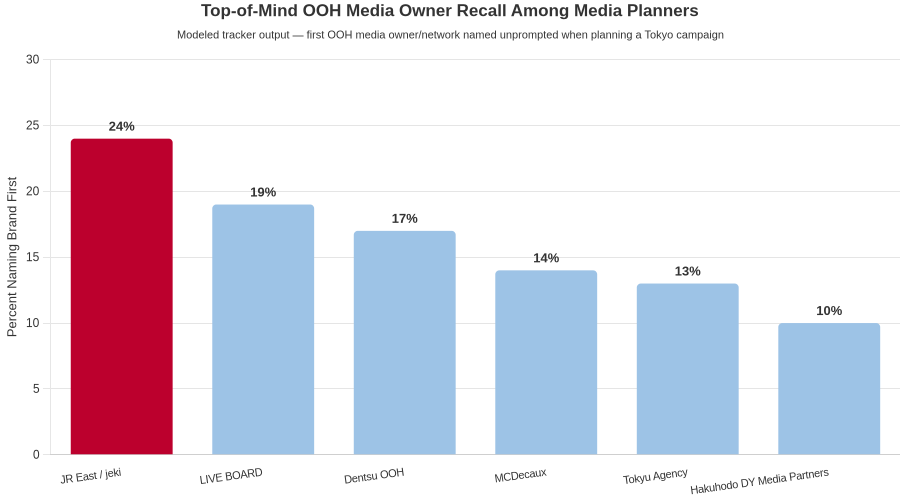
Figure 2: Top-of-mind recall of OOH media owners among media planners. Modeled tracker output.
Since Japan’s OOH market consists of several structurally different inventory categories, NPS provides greater insight when analyzed separately by segment rather than presented as one combined industry score.
Digital landmark inventory, which includes large-format installations such as Cross Shinjuku Vision and comparable screens in the Shibuya area, records the strongest and most consistent NPS performance. The segment increased from 44 in Q1 2025 to 59 in Q2 2026, representing a 15-point improvement across six quarters. The increase has been supported by growing advertiser interest in 3D and motion-graphic creative executions, which can generate organic social-media amplification beyond the number of physical impressions delivered by the placement.
Transit and station inventory has experienced a more gradual improvement. Its NPS increased from 36 to 44 over the same period. This is consistent with a mature, high-reach advertising format in which advertiser sentiment generally improves incrementally as measurement capabilities become more sophisticated rather than through individual high-profile campaign moments.
Street furniture and traditional billboard inventory continue to record the lowest absolute NPS among the three segments. However, the segment has also moved upward, increasing from 22 to 27. This improvement occurs despite continued advertiser concerns regarding audience measurement and targeting accuracy when compared with digital formats. At the same time, the format continues to benefit from established visibility and baseline advertiser trust documented in Statista’s Japan OOH market data.
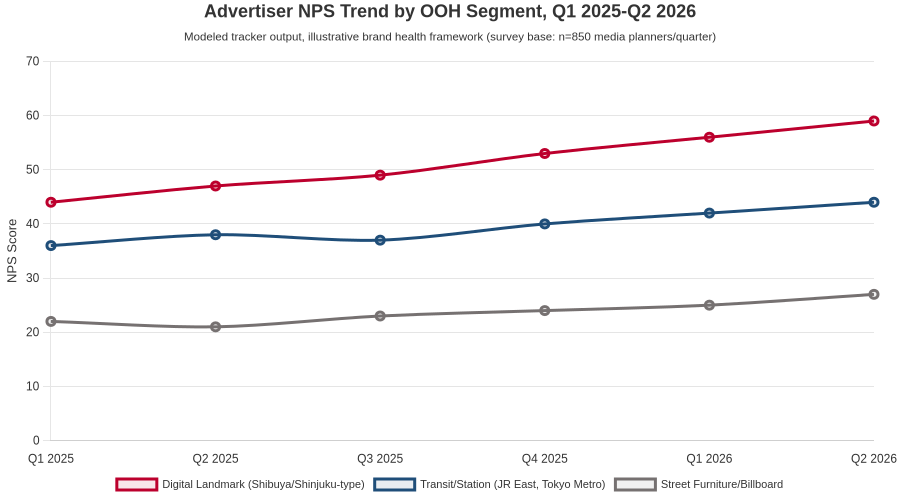
Figure 3: Advertiser NPS trend by OOH segment, Q1 2025–Q2 2026. Modeled tracker output.
In addition to headline NPS results, overall channel health is determined by how advertisers perceive OOH across the individual attributes that influence media-mix and budget-allocation decisions.
When OOH is compared with an all-media category average across seven core attributes, the results reveal a clear combination of relative strengths and weaknesses rather than consistent outperformance across every attribute.
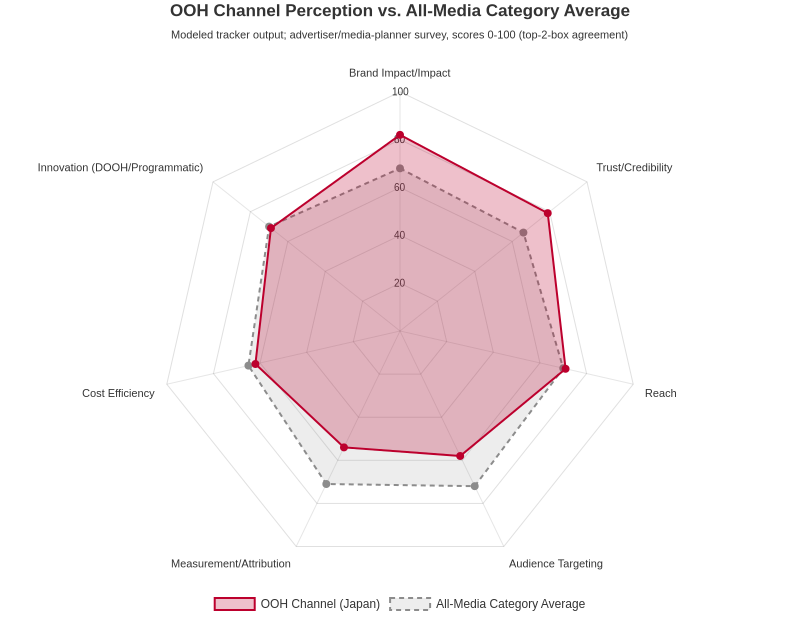
Figure 4: OOH channel perception compared with the all-media category average, top-2-box agreement on a 0–100 scale. Modeled tracker output.
Brand impact represents the strongest relative attribute for OOH, with a score of 82 compared with an all-media category average of 68. This creates a 14-point advantage and reflects the scale, visibility, and unavoidable physical presence of OOH, particularly for landmark inventory positioned in high-footfall locations such as Shibuya Crossing.
Trust and credibility are the next strongest attribute, recording 79 compared with an all-media category average of 66. This is consistent with the broader observation that Japanese consumers tend to place considerable importance on authenticity and trustworthiness in advertising and may view traditional physical OOH formats as more reliable than some digital alternatives.
The largest perception weaknesses appear in audience targeting and measurement and attribution. Audience targeting scores 58 compared with an all-media category average of 72, while measurement and attribution scores 54 versus 71.
These differences are consistent with the structural characteristics of physical advertising. Unlike search and social platforms, OOH has historically lacked highly granular individual-level targeting and closed-loop attribution. However, the market is actively working to reduce these limitations. Programmatic DOOH platforms, third-party verification partnerships such as LIVE BOARD’s relationship with OOH TRACE, and demand-side platforms including AdQuick, Vistar Media, and StackAdapt DOOH are among the mechanisms advertisers identify as helping close the measurement gap.
National-level figures can conceal important differences across Japan’s largest OOH markets. Tokyo, in particular, demonstrates a notably different performance profile compared with Osaka, Nagoya, and smaller regional markets.
In Tokyo, digital landmark inventory achieves NPS scores approximately 11 points above the segment’s national average. The strongest activity is concentrated in Shibuya, Shinjuku, and Roppongi, where high pedestrian traffic, extended dwell time, and social-media amplification from campaigns such as Cross Shinjuku Vision’s 3D creative executions combine to generate stronger advertiser enthusiasm relative to cost.
Osaka and Nagoya demonstrate a more balanced performance across OOH segments. Transit inventory performs closer to digital landmark placements in these markets, reflecting a media-buying environment that places greater emphasis on reach efficiency rather than landmark prestige.
Smaller regional markets outside the three major metropolitan areas show less differentiation between OOH segments. Transit and street-furniture NPS scores tend to remain relatively close, while digital landmark inventory is largely unavailable outside Tokyo, Osaka, and a limited number of other major stations. This restricts the ability of the strongest-performing digital landmark segment to influence overall national OOH sentiment.
The broader Japanese advertising market helps explain both the positive momentum and the continuing challenges facing OOH brand health.
Dentsu’s official 2025 advertising expenditure report places internet advertising media spending at 3.3093 trillion yen. Total internet advertising expenditure reached 4.0459 trillion yen, representing 50.2 percent of Japan’s total advertising expenditure for the first time.
Independent market forecasts also indicate that Japan’s overall digital advertising market could exceed 64.88 billion US dollars by 2026.
Against this increasingly digital advertising environment, continued NPS improvement for OOH—particularly within the digital landmark segment—suggests that the channel is increasingly positioning itself as a complementary component of digital media rather than as a declining legacy format.
This interpretation is also consistent with IMARC Group’s market outlook, which projects that Japan’s OOH advertising market will expand at a 9.3 percent compound annual growth rate through 2033. The expected growth is driven significantly by greater integration between OOH, cross-media strategies, and programmatic buying rather than by traditional OOH formats operating independently.
Dentsu’s latest data also shows continued growth in Japan’s promotional media advertising, including outdoor and transit advertising, supporting the broader direction of the OOH market.
The table below brings together the four principal tracking dimensions into one comparative scorecard covering Japan’s three core OOH inventory segments. It is intended to provide stakeholders with a concise reference point for monitoring quarter-over-quarter changes in overall industry brand health.
| Segment | Q2 2026 NPS | 6-Quarter NPS Trend | Primary Brand Driver |
| Digital Landmark (Shibuya/Shinjuku) | 59 | +15 pts since Q1 2025 | 3D/motion creative, social amplification |
| Transit/Station (JR East, Metro) | 44 | +8 pts since Q1 2025 | Reach, commuter dwell time, measurement gains |
| Street Furniture/Billboard | 27 | +5 pts since Q1 2025 | Baseline trust; targeting/measurement gap persist |
Table 1: Segment-level brand health scorecard, Q2 2026. Modeled tracker output; illustrative brand-health framework.
Four key strategic implications emerge from the Q2 2026 tracking results.
First, the digital landmark segment is producing the strongest NPS improvement. The substantial gains recorded by digital landmark inventory indicate that overall OOH industry health is becoming increasingly influenced by a relatively small group of highly visible and creatively ambitious placements. As a result, continued investment in premium digital landmark inventory and 3D creative capabilities is likely to remain one of the strongest levers for improving overall channel sentiment.
Second, measurement and audience targeting remain the primary structural weaknesses. The persistent gaps in these areas are unlikely to be addressed simply through greater awareness of the OOH channel. With aided awareness already reaching 94 percent, further awareness-building has limited room to generate additional gains. Instead, continued development of programmatic DOOH infrastructure, improved measurement capabilities, and third-party verification partnerships similar to LIVE BOARD’s work with OOH TRACE will be necessary to close the gap.
Third, the fragmented top-of-mind landscape creates an opportunity for differentiation. The distribution of first mentions across six or more media owners, with no individual player accounting for more than one-quarter of mentions, indicates that no single supplier currently dominates planner mindshare in the way a clear category leader might in a more consolidated market. This creates an opportunity for a differentiated player to gain a disproportionate share of consideration through stronger and clearer positioning.
Fourth, investment priorities should differ by market. Tokyo’s digital landmark segment is already sufficiently strong that additional gains are likely to depend more heavily on creative innovation than on simply expanding inventory. In Osaka, Nagoya, and smaller regional markets, transit and street-furniture formats offer greater potential for measurement-led perception improvement and may provide stronger returns from technology investment.
Overall, the Q2 2026 tracking results support a positive and improving brand-health story for Japan’s OOH advertising industry. No segment has declined across the six-quarter period, while digital landmark inventory has emerged as the clear standout performer.
The next two tracking waves should closely monitor whether programmatic DOOH adoption, currently standing at 33 percent among aware marketers, begins to reduce the measurement-perception gap that continues to represent the channel’s most important structural weakness compared with digital alternatives.
Taken together, the findings indicate that Japan’s OOH industry is continuing to evolve toward a more digitally integrated, measurable, and creatively driven role within the broader media mix.