Global Glass Price Tracker
Monthly Edition | September 2026 | Published October 9, 2026


Monthly Edition | September 2026 | Published October 9, 2026
| Indicator | Latest | Prior / reference | Change |
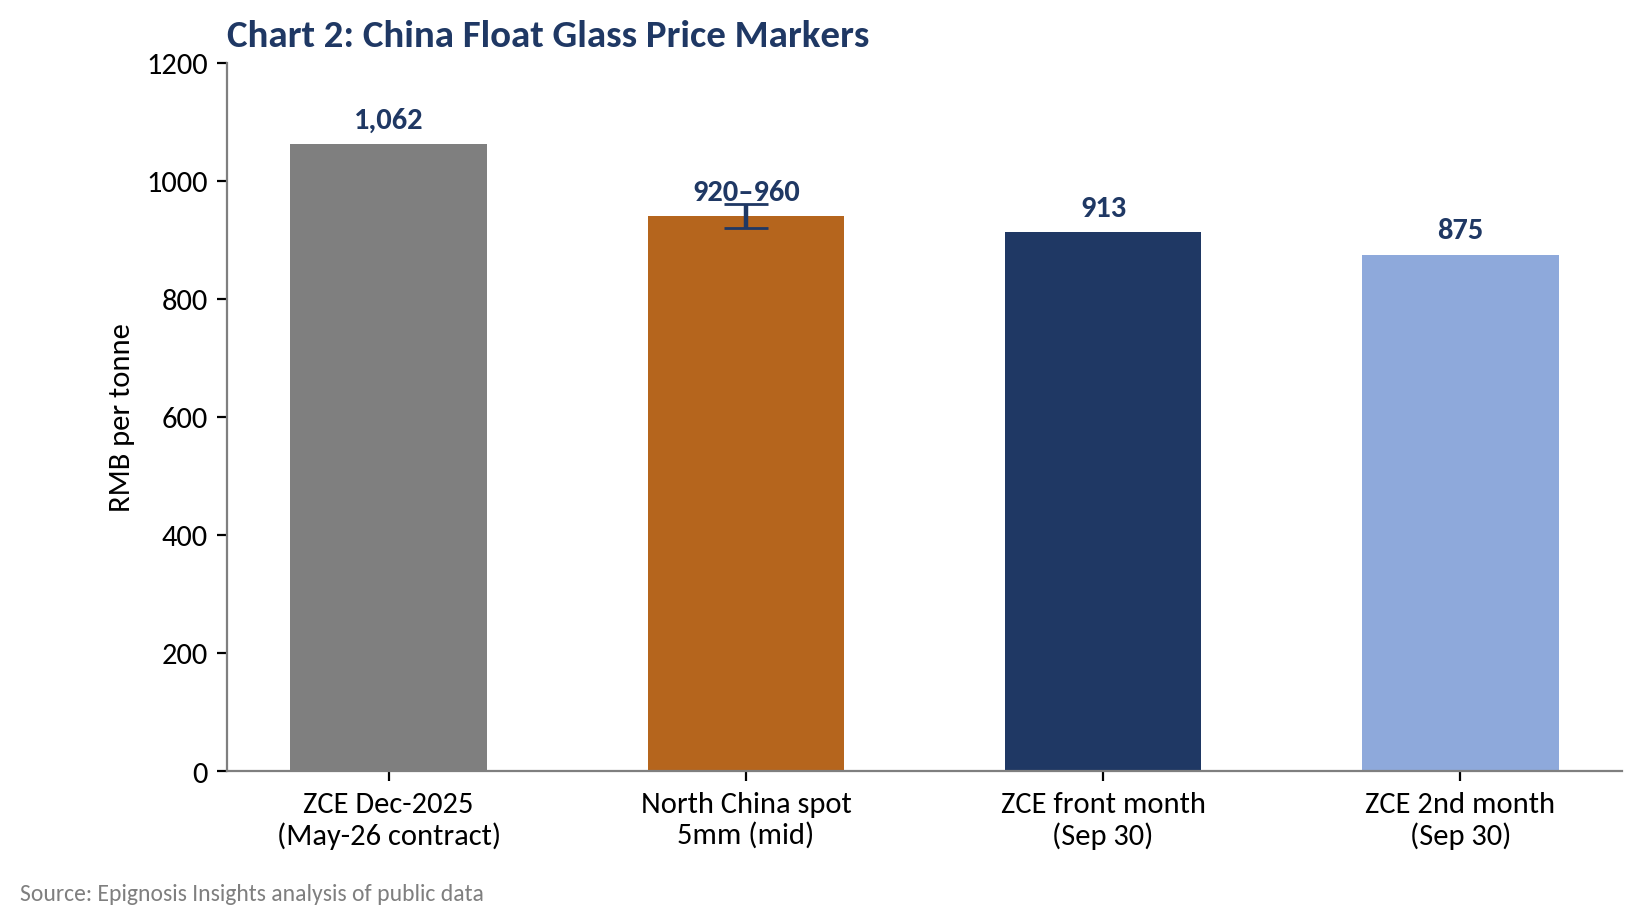
| China ZCE flat glass (front month) | RMB 913/t (Sep 30) | RMB 875/t (2nd month) | Front over 2nd: +RMB 38 |
| North China 5mm float (ex-factory) | RMB 920–960/t | Peak-season weakness | Discounting widening |
| Float glass index: North America | US$1.05/kg | August | Unchanged |
| Float glass index: Europe | US$0.83/kg | August | Unchanged |
| Float glass index: Northeast Asia | US$1.16/kg | August | -1.7% m/m |
| PV glass 2.0mm double-coated (China) | RMB 11.50/m² (Sep 1 list) | RMB 10.15/m² (early Aug) | +13.3% |
| PV glass 3.2mm double-coated (China) | RMB 17.15/m² (Aug 31) | RMB 16.60/m² (early Aug) | +3.3% |
| TTF gas, September average | €76.48/MWh | €69.81 (Aug 31 close) | Peak €82.57 |
| US PPI flat glass (August) | +0.1% m/m | +2.8% y/y | Cost pass-through |
Source: Epignosis Insights compilation of exchange, government, industry and company data.
Global Glass Prices split sharply by region in September 2026. Epignosis Insights' tracking shows China's float glass market sliding further on weak property demand and heavy inventories, Europe absorbing a renewed energy shock as gas prices hit three-year highs, and Chinese solar glass holding a supply-led rebound. North American flat glass prices continued their slow, cost-driven climb.
The month's defining feature was divergence between cost and price. European natural gas averaged €76.48/MWh in September, yet the regional float glass index was unchanged at US$0.83/kg, indicating that producers had not yet passed the energy spike through. In China, the front-month flat glass futures contract settled at RMB 913/t on September 30, below the spot range for 5mm clear glass, as the traditional September peak season failed to materialise.
Epignosis Insights expects these gaps to narrow in Q4 2026. The base case calls for European float glass prices to rise 3% to 6% quarter-on-quarter through energy surcharges, Chinese float glass to trade sideways-to-weak in an RMB 850–960/t band, and solar glass to stay firm but capped. The key swing factors are the path of Middle East-driven gas prices and the pace of furnace cold repairs in China.
Regional float glass benchmarks held broadly steady in September despite sharply different cost conditions. North America stood at US$1.05/kg and Europe at US$0.83/kg, both unchanged from August, while Northeast Asia slipped 1.7% to US$1.16/kg (businessanalytiq). Chart 1 compares the three regional indices.
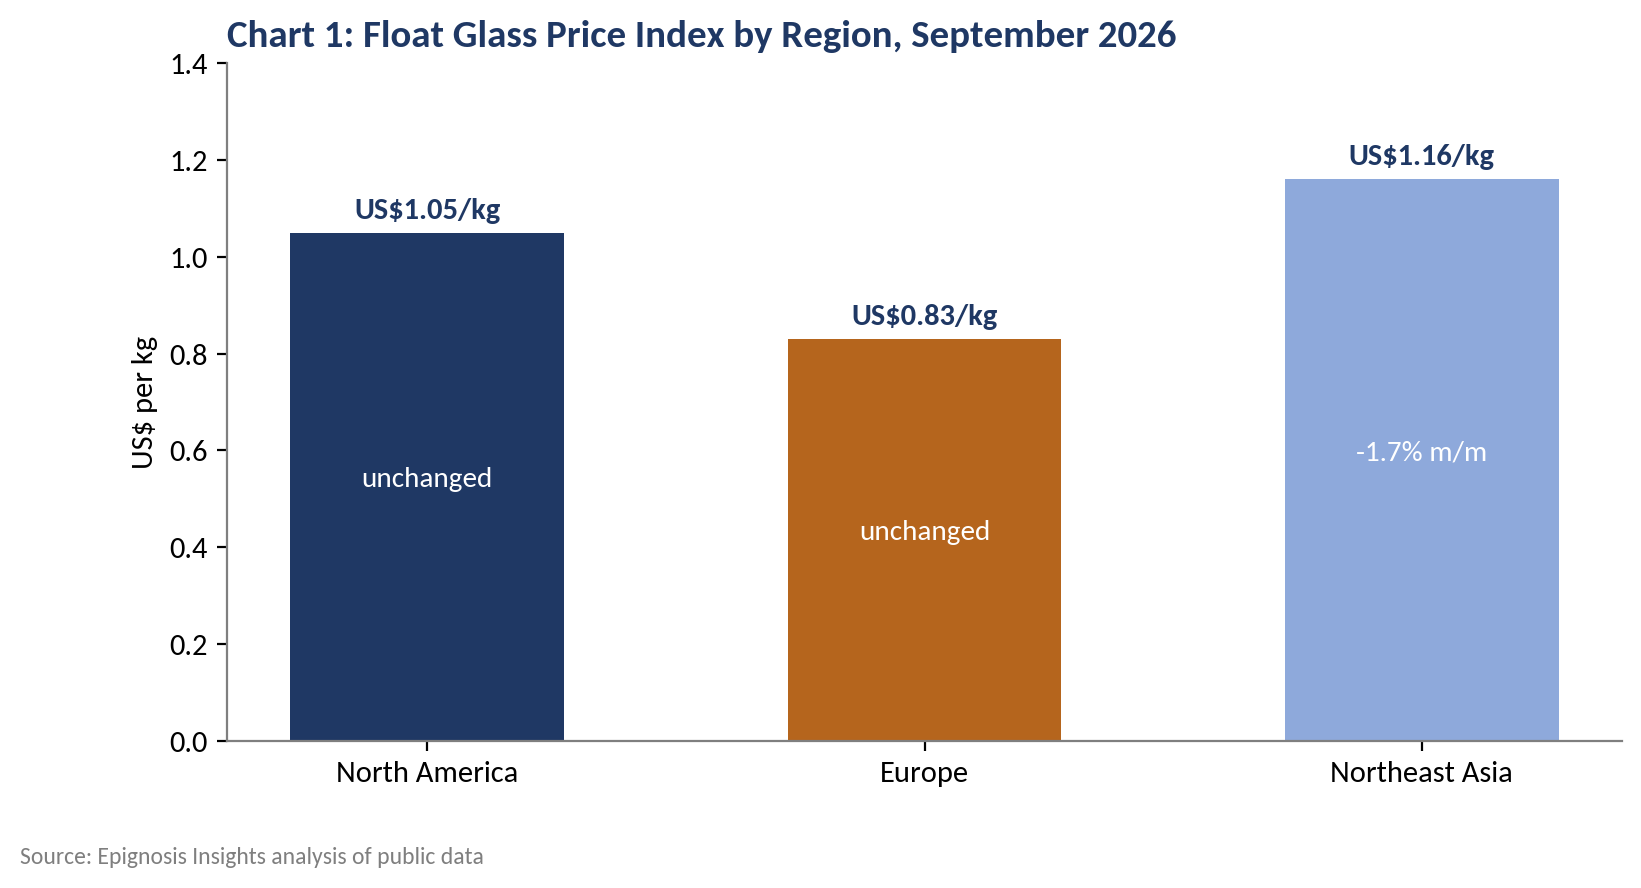
In Epignosis Insights' reading, the flat European index is a lagging signal rather than a sign of stability. Float lines run continuously and sell largely on quarterly or half-yearly contracts, so a gas shock that began in late August typically reaches invoices only through Q4 surcharges and January contract resets. Northeast Asia's decline, by contrast, reflects a live oversupply problem that pricing is already registering.
China's architectural glass market entered its traditional September peak season without the expected demand lift. In North China, the core production region, mainstream ex-factory prices for 5mm clear glass fell to RMB 920–960/t, with producers leaning on rebates and low-price deals to move volume. Factory inventories at sampled float plants stood at 70.78 million weight boxes in mid-September, still high year-on-year, and futures fell more than 5% in a single session on September 14 (SunSirs).
The futures curve confirms the bearish tone. The front-month Zhengzhou flat glass contract settled at RMB 913/t on September 30, with the second month at RMB 875/t (CEIC). That compares with roughly RMB 1,062/t for the May 2026 contract in December 2025, marking a decline of about 14% over nine months. Chart 2 sets these markers side by side.
The second month trading RMB 38/t below the front month signals that the market expects prices to weaken further into later delivery months, in Epignosis Insights' assessment. Float furnaces are continuous-production assets, and once lit, a cold repair is costly and time-consuming. Producers therefore tend to keep lines running at a loss, discounting through rebates rather than idling capacity. Until more lines go down for maintenance or exit permanently, the inventory overhang will continue to cap any price recovery, even in seasonally stronger months.
Producer results show how deep the squeeze runs. Xinyi Glass, one of China's largest float producers, reported first-half 2026 float glass revenue of RMB 5,101.6 million at a 16.7% gross margin, down from 17.8% a year earlier, and its architectural glass margin fell to 20.1% from 29.7% (Xinyi Glass). Management cited weak demand from property completions, high inventories and falling selling prices.
Two policy signals offer partial support. Beijing issued cost-accounting rules for key industrial products in mid-September to curb below-cost selling, and a new 40-year mortgage policy entered early implementation (Mysteel). China's official manufacturing PMI also returned to expansion at 50.1 in September, from 49.8 in August (National Bureau of Statistics of China), while the construction activity index rose to 50.3 from 46.9 (Trading Economics). Epignosis Insights views these as stabilisers for sentiment rather than a near-term demand catalyst, since glass demand tracks property completions with a lag of 12 to 18 months.
Europe's glass industry faced its sharpest energy cost increase since 2023 in September. The front-month TTF gas contract climbed from €69.81/MWh on August 31 to €79.00/MWh intraday on September 9, its highest level since early 2023, as Middle East tensions pushed Brent crude back above US$100 per barrel (AleaSoft Energy Forecasting). For the month as a whole, TTF averaged €76.48/MWh within a range of €69.47 to €82.57 (Cbonds). Chart 3 traces the move.
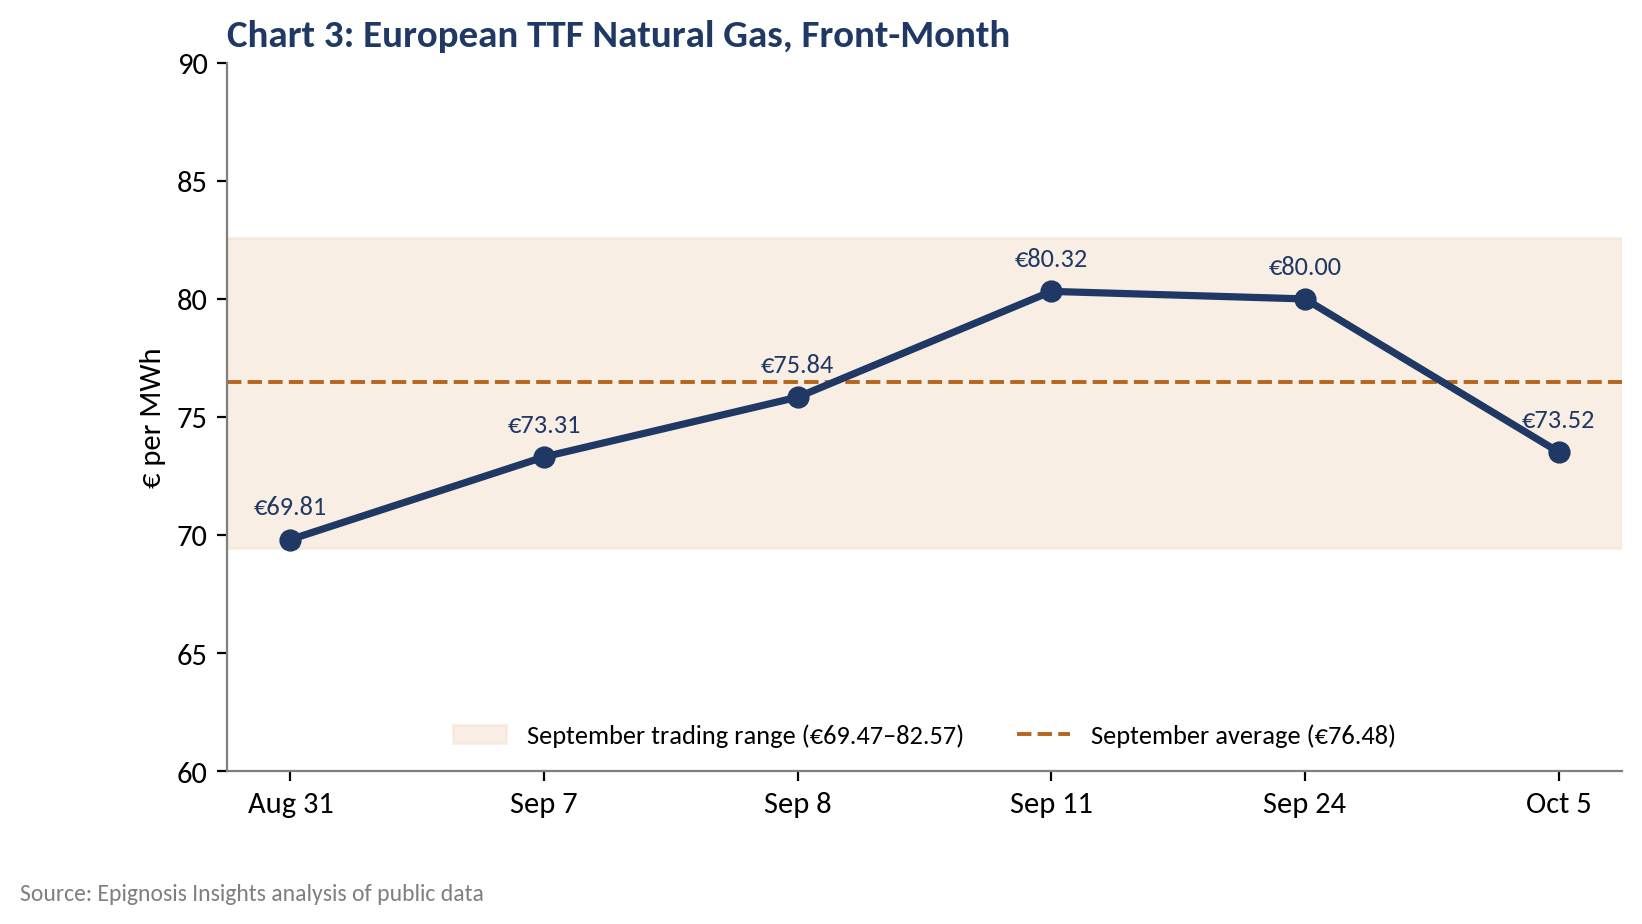
The shock compounds structural pressure that industry bodies had already flagged. In February, the container glass sector warned that persistently high energy costs, rising carbon costs and a difficult trading environment were weakening investment across Europe (FEVE). The wider glass industry joined other energy-intensive sectors in calling for urgent action on energy and carbon costs to prevent irreversible deindustrialisation (Glass Alliance Europe).
Company data show the margin damage. O-I Glass's European business generated US$704 million in Q2 2026 sales, but operating profit fell to US$6 million from US$90 million a year earlier, hit by competitive pricing and higher energy costs linked to the Middle East conflict (Packaging Dive). Forward curves offer little relief: Goldman Sachs now expects European gas to average about €70/MWh through winter 2026–27, up from a previous range of €30–60/MWh (Goldman Sachs). Epignosis Insights expects European flat and container glass producers to announce energy surcharges in Q4, lifting float glass prices 3% to 6% quarter-on-quarter.
Surcharges are the industry's preferred tool because they can be applied quickly and withdrawn when energy costs ease, avoiding a permanent reset of list prices. European glass makers leaned heavily on surcharges and repeated price increases during the 2022 energy crisis, and buyers should expect comparable clauses tied to monthly gas benchmarks. Processors and window manufacturers with fixed-price project contracts are the most exposed, as they will absorb higher glass costs before they can reprice their own products.
Solar (PV) glass is the one segment where prices rose meaningfully. After six months of declines, Chinese PV glass prices moved up in two rounds during August as leading producers implemented coordinated output cuts. The average price of 3.2mm double-coated glass rose 3.3% to RMB 17.15/m² by August 31, while 2.0mm double-coated glass climbed from RMB 10.15/m² to RMB 11.00/m² (Shanghai Metals Market). Producers then raised the September 1 listed price for 2.0mm double-coated glass to RMB 11.50/m². Chart 4 tracks the increases.
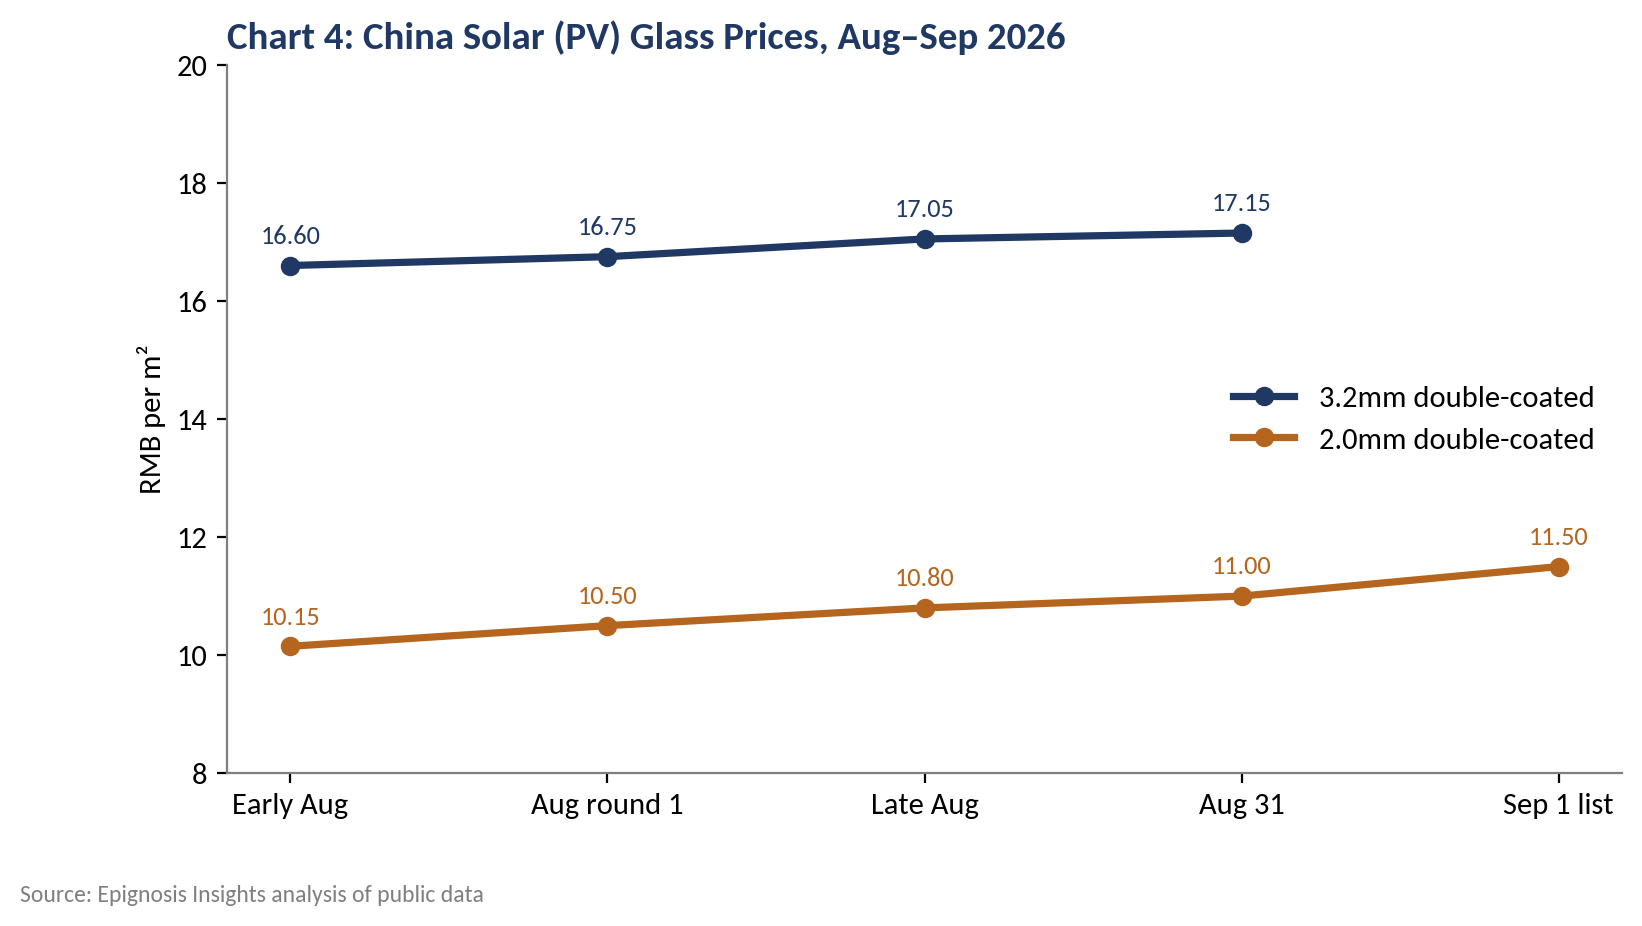
Epignosis Insights notes that this rebound rests on supply discipline, not demand. Mid-September trading was quiet, with producers mainly delivering early-month orders and few new contracts signed. Module makers remain under severe margin pressure and will resist further increases. The firm's base case holds 2.0mm double-coated glass in an RMB 11–12/m² range through Q4, with downside risk if any major producer restarts idled furnaces.
For international module buyers, the practical effect is a modest increase in bill-of-materials costs rather than a structural shift. Glass remains a small share of total module cost, and the rebound has only recovered part of the ground lost in the first half. The more important signal is behavioural: Chinese producers have shown they can coordinate output cuts to defend prices, a pattern that could extend to float glass if the new cost-accounting rules gain enforcement teeth.
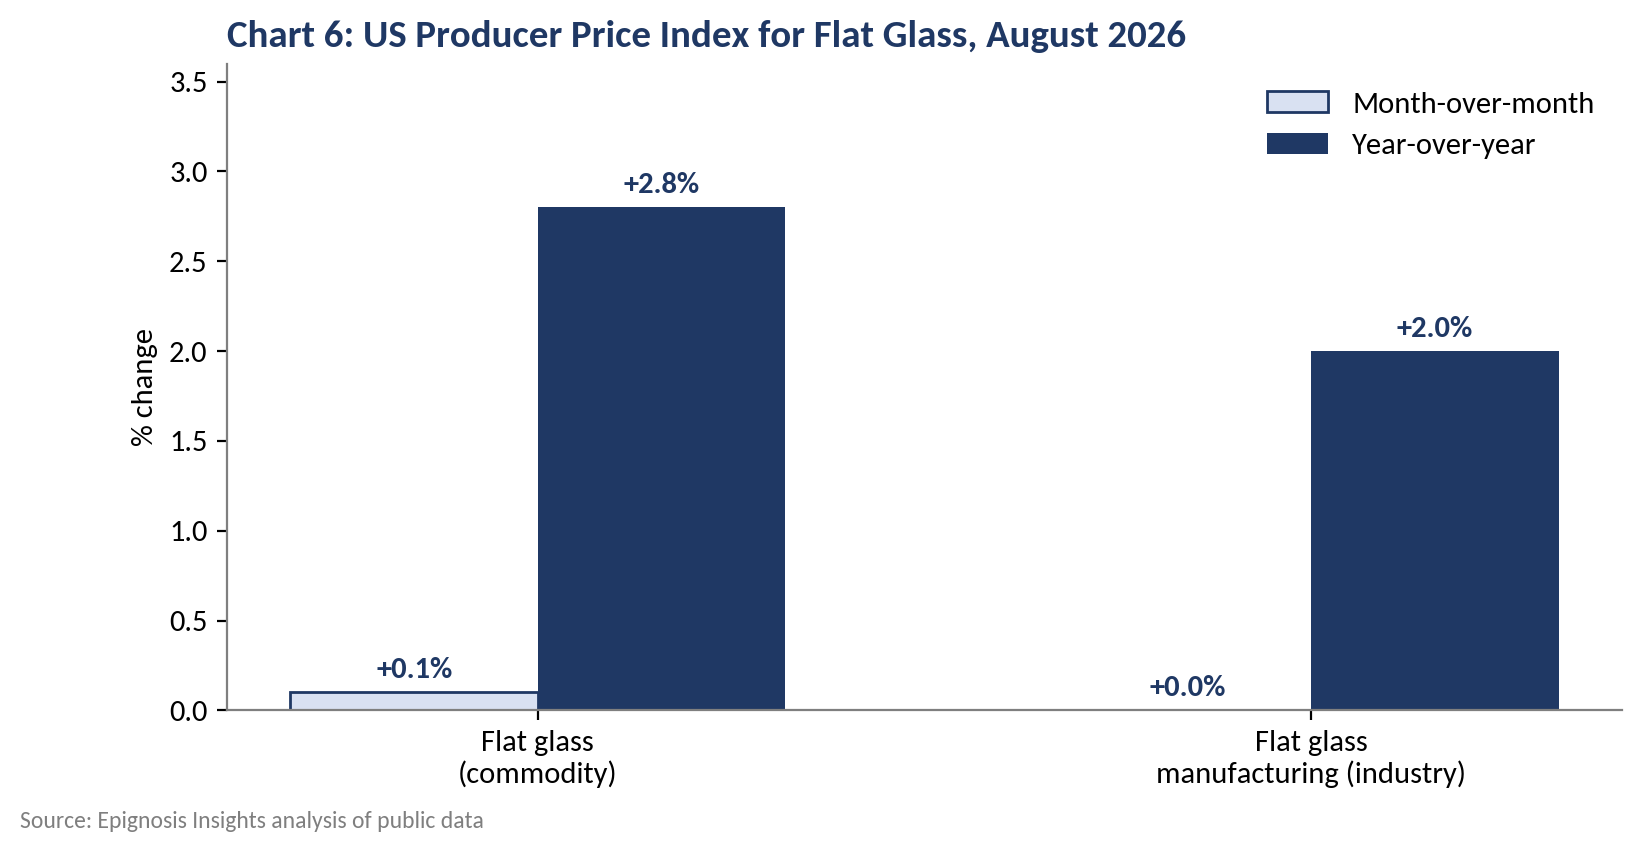
North American flat glass pricing continued its gradual climb. The US producer price index for flat glass rose 0.1% month-on-month in August and 2.8% year-on-year, while the flat glass manufacturing industry index was flat on the month and up 2.0% on the year (US Bureau of Labor Statistics). Chart 6 summarises the data.
The North American container market looks healthier than Europe's. O-I Glass reported Americas net sales of US$949 million in Q2 2026, up nearly 1%, with favourable pricing offsetting lower shipments, while global volumes fell 4.5% but recovered to flat year-on-year by June (O-I Glass). With US natural gas far cheaper than European supply, Epignosis Insights expects North American flat glass to remain stable to firm, rising 0% to 2% in Q4.
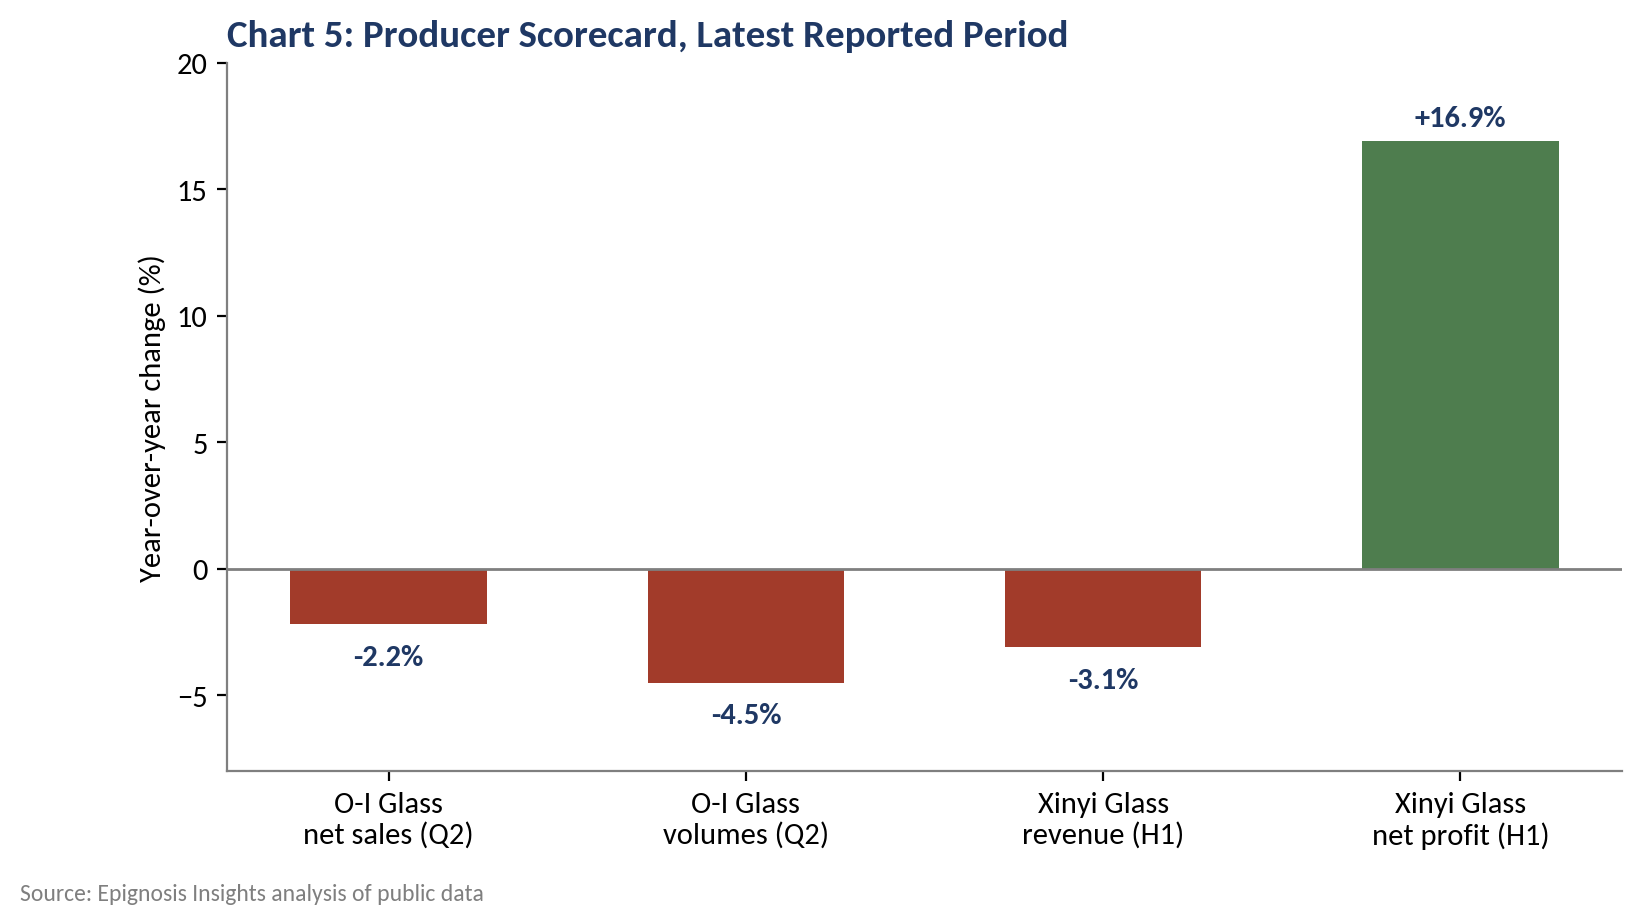
Soda ash, the main raw-material cost after energy, provided modest relief. Prices stayed in correction mode through Q3 2026 on ample supply, comfortable inventories and need-based buying, with only a moderate rebound expected around September (Price-Watch). Xinyi Glass reported that lower raw material and energy costs partly offset weaker selling prices, helping first-half net profit rise 16.9% even as revenue fell 3.1%. Chart 5 compares the latest results from the two producers tracked this month.
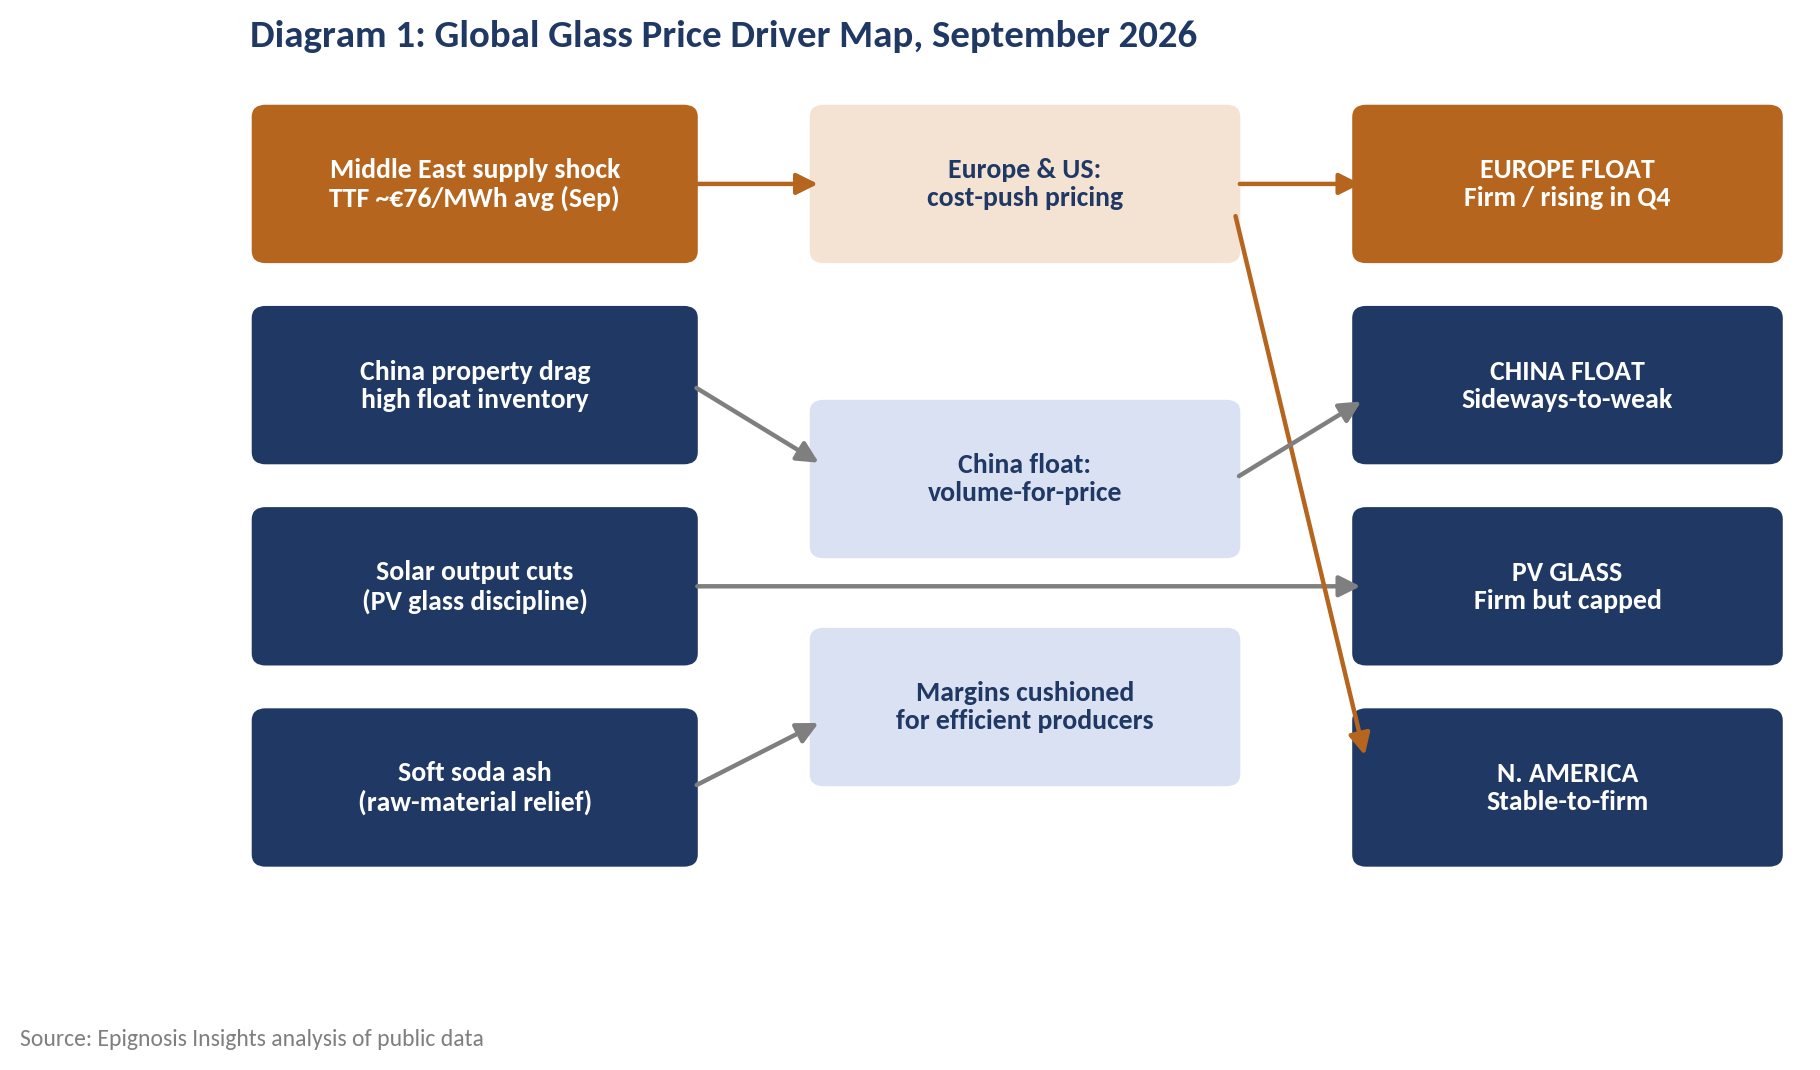
The driver map below summarises how these forces interact. Energy is the dominant cost lever in Europe, property demand dominates in China, and supply discipline is setting solar glass prices. Soft soda ash is a global offset that favours integrated, energy-efficient producers.
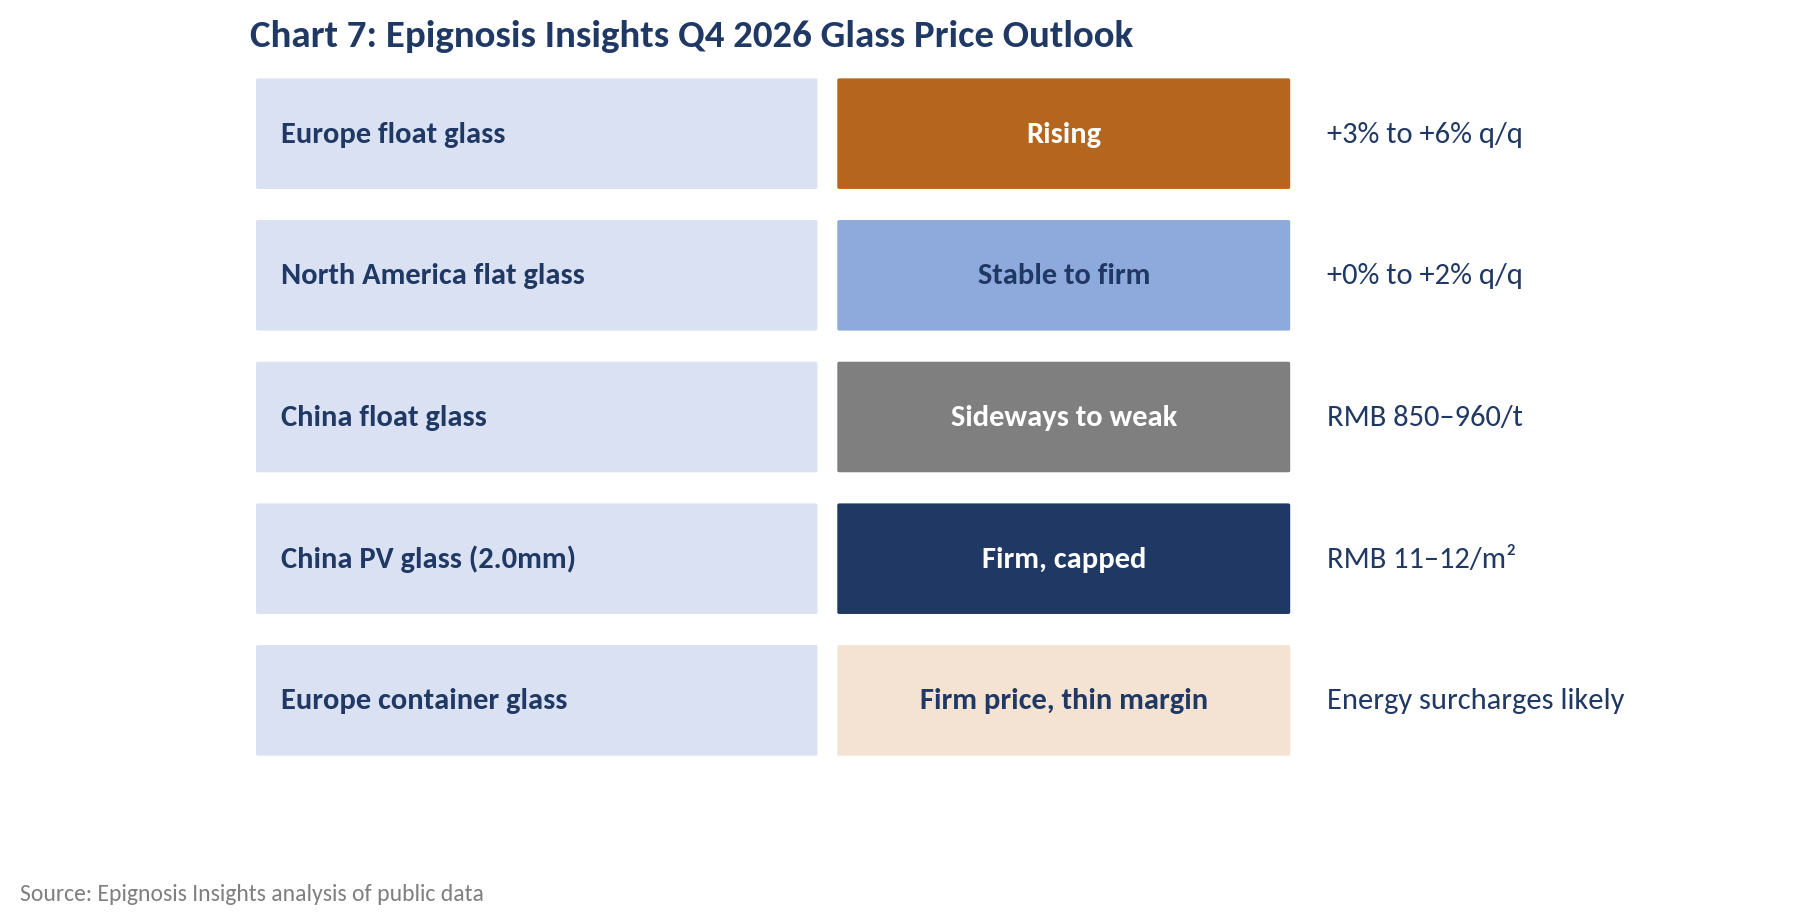
Epignosis Insights' base case for Q4 2026 is for regional divergence to widen before it narrows. European float glass should rise 3% to 6% as energy surcharges take effect, with container glass prices firm but margins thin. Chinese float glass should trade sideways-to-weak in an RMB 850–960/t range, with upside only if cold repairs accelerate or property policy gains traction. North American flat glass should remain stable to firm, and Chinese PV glass should hold its gains within a narrow band. Chart 7 summarises the outlook.
Three risks could change this view. A de-escalation in the Middle East that restores Persian Gulf energy flows could pull TTF back toward €50/MWh and remove the European surcharge case. Conversely, a further escalation would push European prices well above the base range. In China, an aggressive round of furnace closures under the new pricing rules would tighten supply faster than demand recovers, lifting float glass prices from their lows.
Epignosis Insights will track four signposts through October and November: the weekly TTF settlement and any surcharge announcements from major European producers; China's monthly property completion and float glass inventory data; the next round of PV glass listed prices in early November; and third-quarter results from major glass producers, which will show how far energy and pricing pressures have flowed into margins. Movement in any of these indicators will be reflected in the October edition of this tracker.
European buyers should expect surcharge notices in Q4 and use the window before January contract resets to negotiate caps or index-linked clauses tied to TTF. Buyers sourcing from China can secure favourable float glass terms while inventories remain high, but should treat solar glass quotes as firm through year-end. North American buyers face modest, predictable increases. For producers, the priority is clear: European operators must pass through energy costs quickly to protect margins, while Chinese float producers face continued pressure until capacity exits the market.