Global Corn Price Tracker
Week 42, 2026 | Trading week 12–16 October 2026


Week 42, 2026 | Trading week 12–16 October 2026
Corn Prices extended their post-harvest slide in Week 42 as the market continued to absorb a much larger U.S. crop than the trade had expected. CBOT December 2026 corn settled at $4.74¼ per bushel on 16 October, down 5½ cents or 1.15% on the week and about 10.6% lower over the past month. The decline followed the 9 October WASDE report, which raised the U.S. yield to 181.2 bushels per acre and pushed projected 2026/27 ending stocks to 1.849 billion bushels. Epignosis Insights assesses the near-term bias as neutral-to-bearish while harvest selling continues, but notes that futures now sit only a few cents above USDA’s season-average farm price forecast, which limits further downside. Our expected range for the coming week is $4.62–4.86 per bushel on the December contract.
| Indicator | Latest | Previous | Change |
| CBOT Dec-26 corn (¢/bu) | 474.25 (16 Oct) | 479.75 (9 Oct) | −1.15% |
| CBOT Dec-26 corn (US$/t) | ~186.7 | ~188.9 | −1.15% |
| CBOT Mar-27 corn (¢/bu) | 486.50 | 494.25 | −1.57% |
| Dec-26/Jul-27 carry (¢/bu) | 25.00 | 27.75 | −2.75¢ |
| US 2026/27 ending stocks (bn bu) | 1.849 (Oct) | 1.567 (Sep) | +18.0% |
| US season-average farm price ($/bu) | 4.70 (Oct) | 4.80 (Sep) | −$0.10 |
| World 2026/27 ending stocks (Mt) | 280.44 (Oct) | 272.10 (Sep) | +3.1% |
| US corn harvested (%) | 33 (11 Oct) | 23 (4 Oct) | +10 pts |
Source: Epignosis Insights compilation and calculations from the exchange, government and industry data cited in this report; US$/t converted at 39.368 bushels per tonne.
Daily settlements reported by Brownfield Ag News show December corn drifting lower through the week, from $4.82¾ on 13 October to $4.80¾ on 14 October and $4.74¼ on 16 October, the latter a 3¾-cent loss on Friday alone. The pattern was one of steady, low-volatility liquidation rather than a sharp sell-off: speculative long positions built up during the summer were unwound as combines rolled across the western Corn Belt. December corn closed the week just four cents above its recent low of $4.70¼, a level that Epignosis Insights identifies as the first meaningful technical floor. The same reports show December Chicago wheat settling at $6.60½ on Friday, leaving wheat at a premium of about $1.86 per bushel over corn.
Viewed over a longer horizon, the market has given back most of its summer weather premium. December corn now trades around 70 cents below its 52-week high of $5.49¾, yet remains roughly 12% higher than a year ago, reflecting the tighter old-crop balance that carried into the new marketing year. In metric terms, the benchmark equates to about US$187 per tonne.
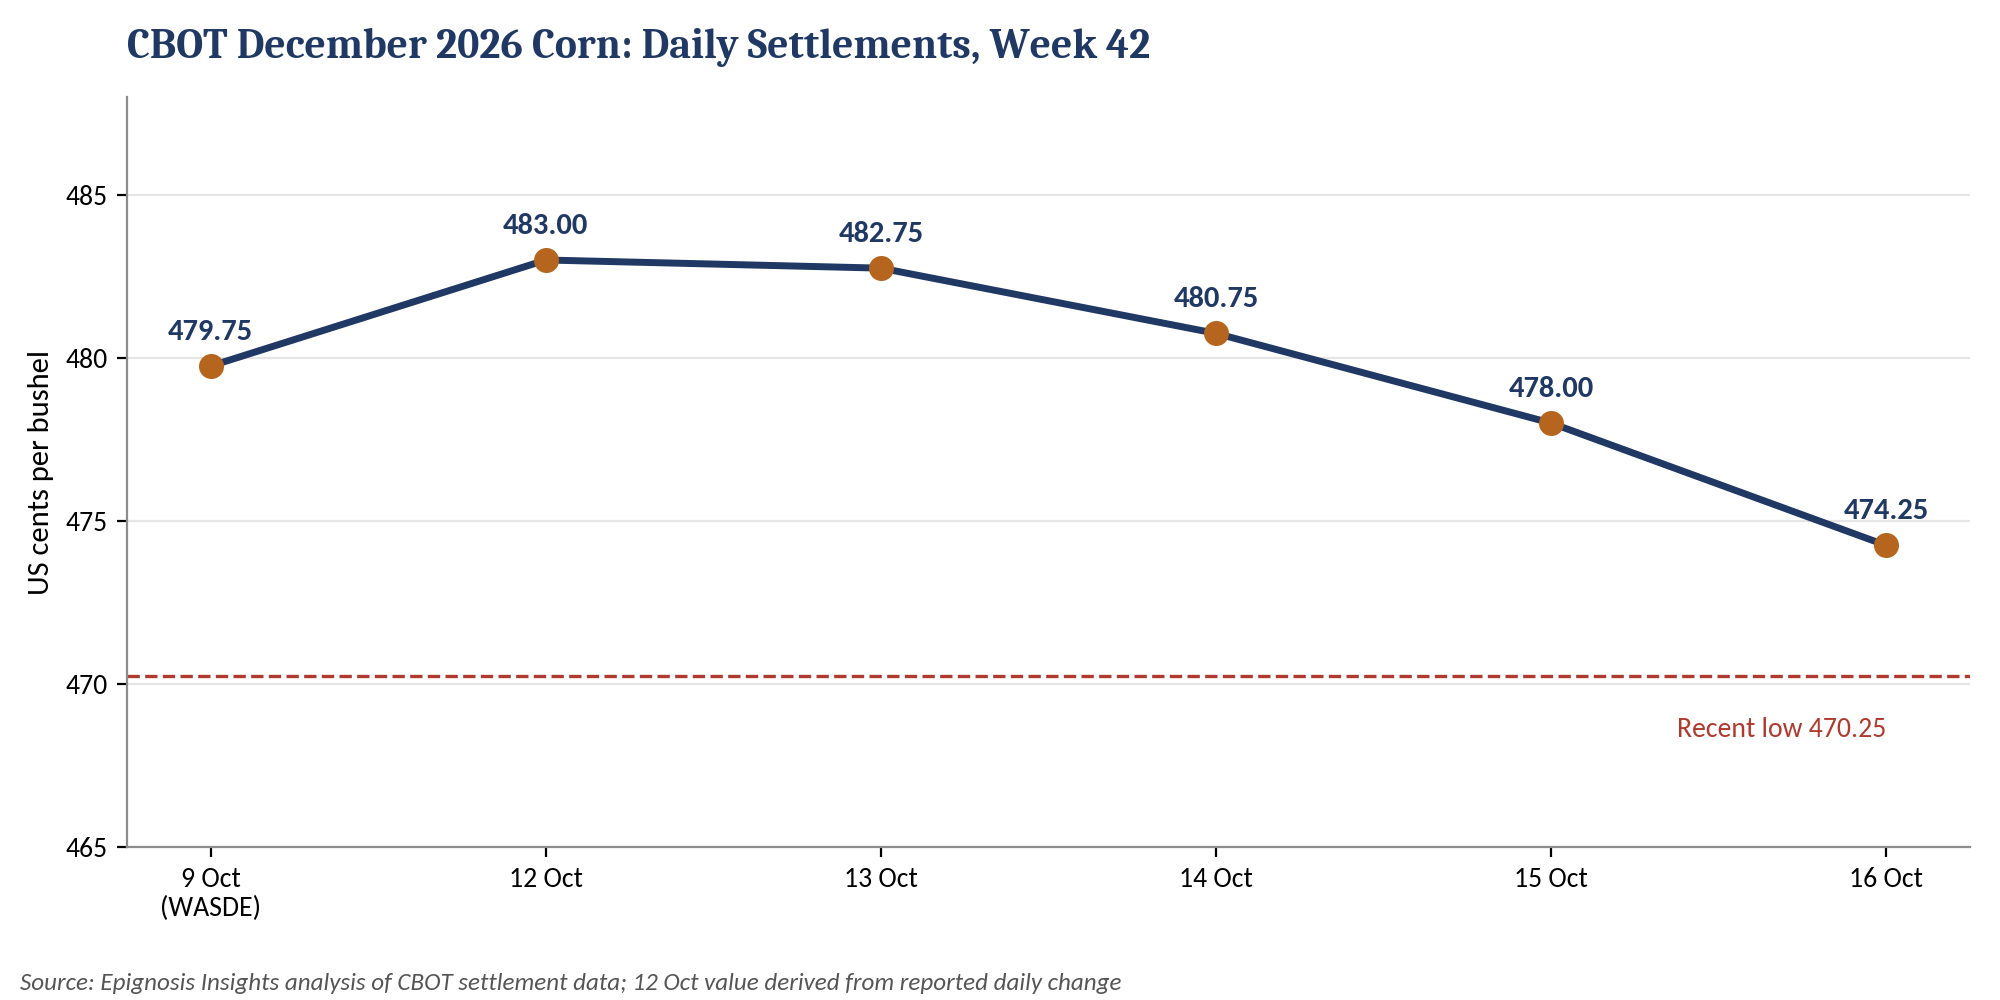
Figure 1: CBOT December 2026 corn daily settlements
CBOT closing settlements published by CME Group show the entire curve moving lower in near-parallel fashion during the week, with deferred contracts losing slightly more than December. The carry from December 2026 to July 2027 narrowed from 27¾ cents to 25 cents, which Epignosis Insights interprets as a modest sign that commercial buyers see value at nearby prices rather than an outright signal of tight supply. The curve remains in full contango through mid-2027, so storage still pays for farmers with on-farm capacity, encouraging them to hold unpriced grain rather than sell at harvest lows.
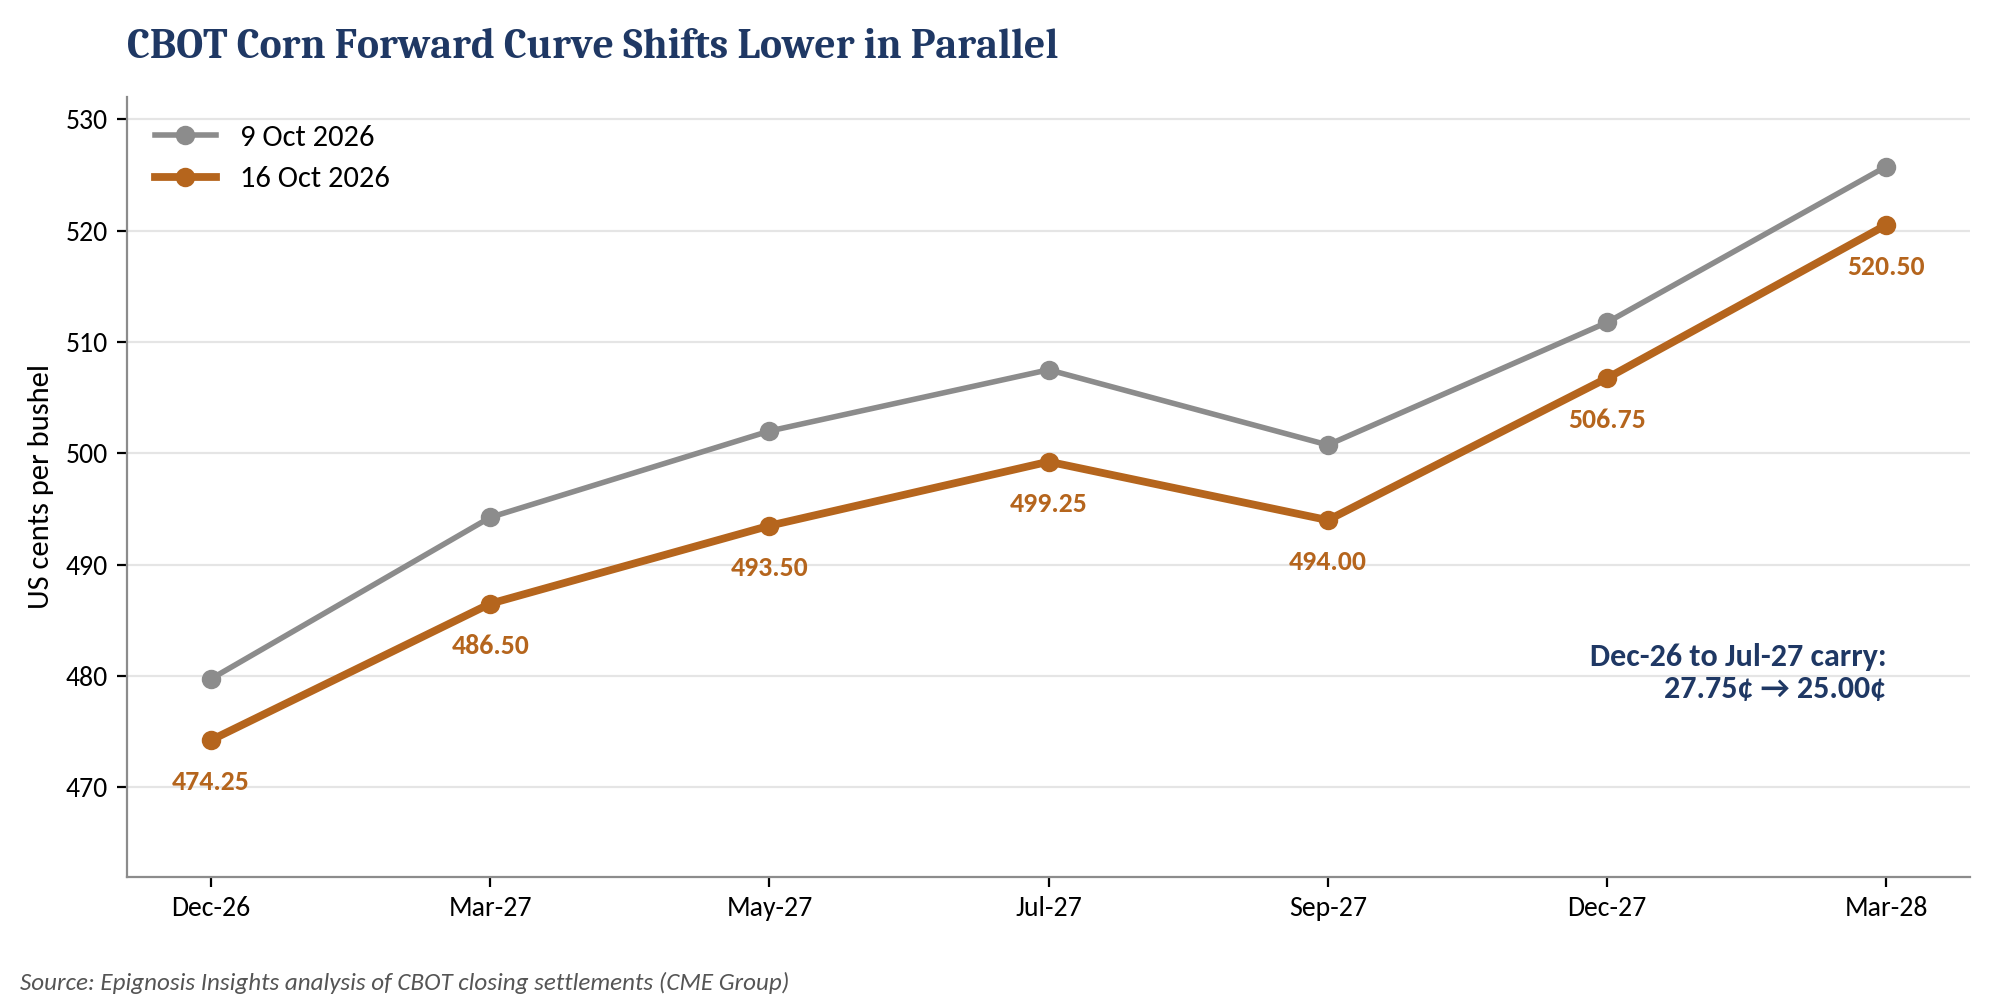
Figure 2: CBOT corn forward curve, 9 October vs 16 October 2026
The U.S. Department of Agriculture’s October World Agricultural Supply and Demand Estimates remain the dominant influence on prices. USDA raised the national yield by 2.7 bushels to 181.2 bushels per acre and lifted production to 16.034 billion bushels from 15.8 billion in September. Total use rose by 125 million bushels, including 50 million more for ethanol, 50 million more for feed and residual, and 25 million more for exports at 3.3 billion bushels. That was not enough to offset the larger crop, and 2026/27 ending stocks climbed 282 million bushels to 1.849 billion. USDA trimmed the season-average farm price by 10 cents to $4.70. On Epignosis Insights calculations, the stocks-to-use ratio rose from about 9.7% to 11.3%, the loosest balance in several seasons.
According to a pre-report survey cited by Hoosier Ag Today, the trade had expected production of 15.734 billion bushels and ending stocks of 1.694 billion, meaning USDA’s production figure came in roughly 300 million bushels above consensus. That scale of surprise explains why the market has continued to grind lower in the week after the report rather than staging a relief rally.
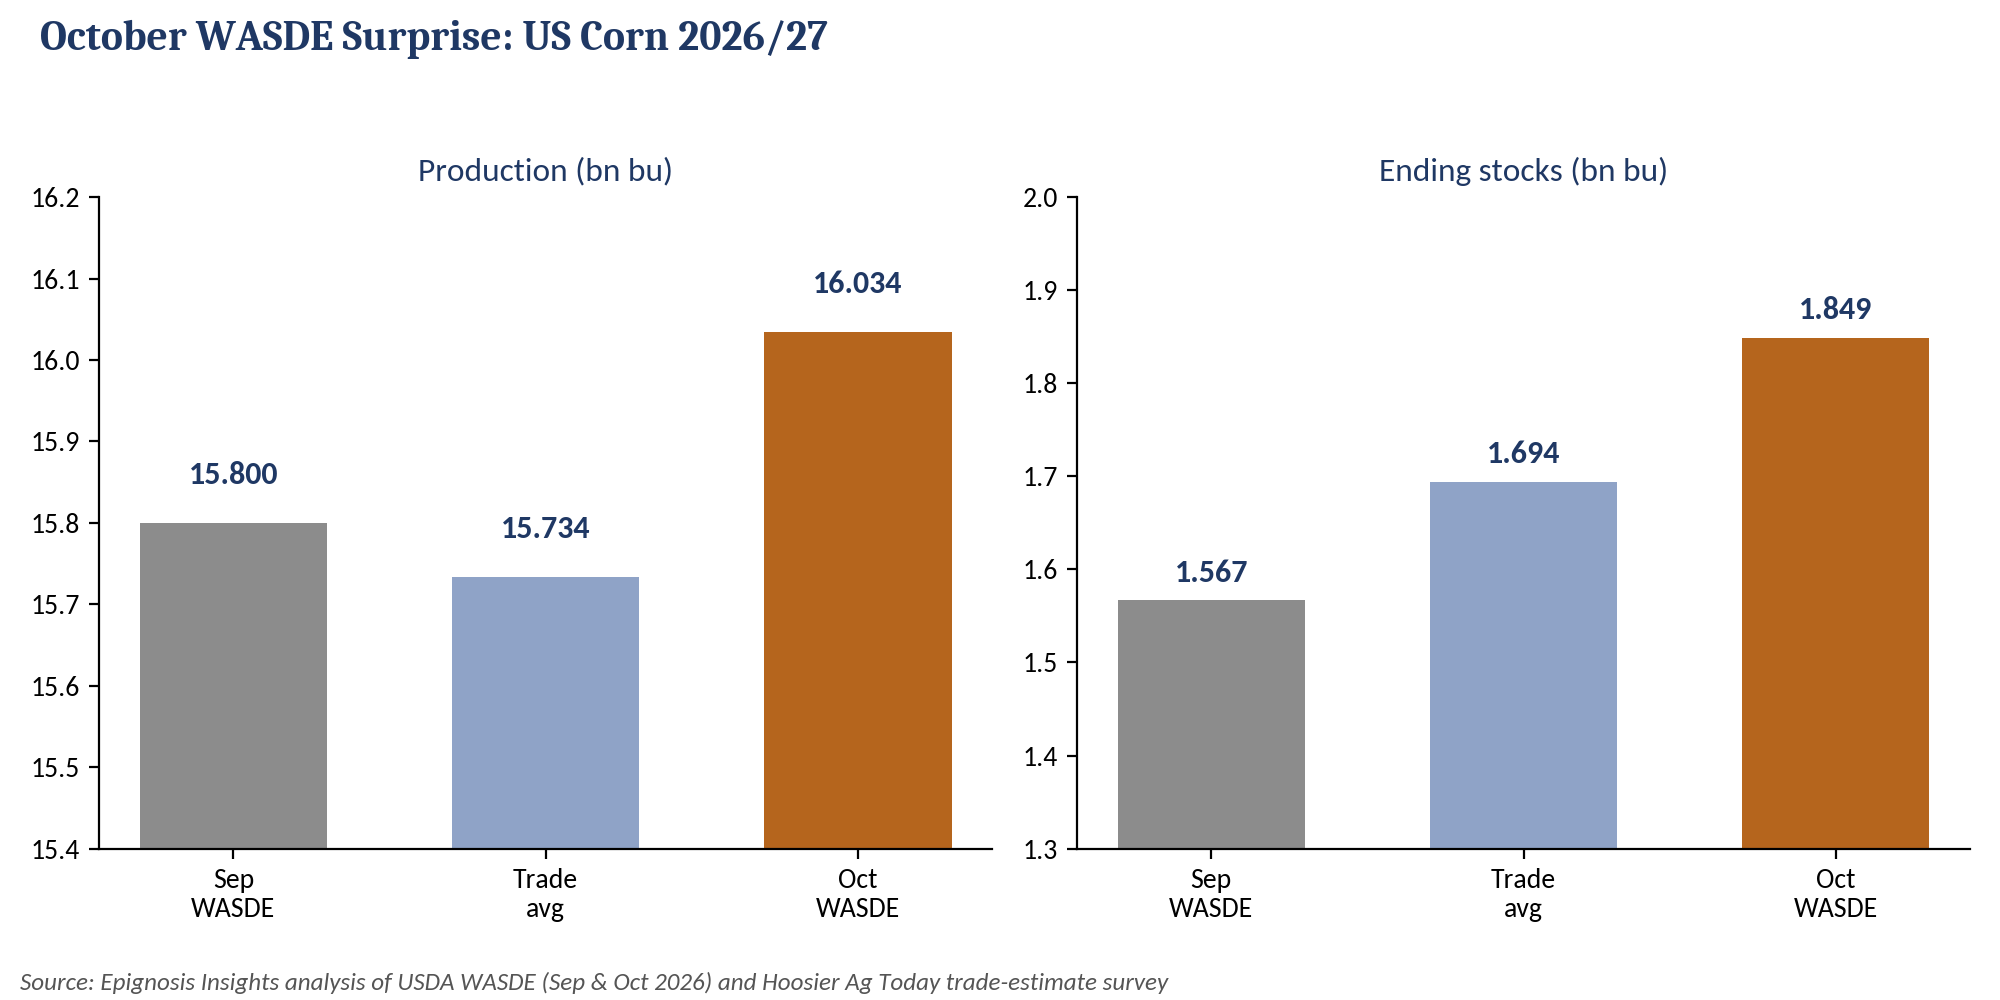
Figure 3: US corn production and ending stocks, September vs October WASDE
The USDA increase did not come out of nowhere. StoneX, in its pre-report survey, estimated U.S. production at 16.115 billion bushels on a yield of 182.1 bushels per acre, already well above USDA’s September figure. With a leading private forecaster sitting even higher than the official number, Epignosis Insights sees a meaningful risk that USDA’s final yield in January could edge up again, which would add further pressure to the balance sheet.
Farm Progress, reporting the USDA crop progress data for the week to 11 October, noted that harvest advanced to 33% complete from 23% a week earlier, against a five-year average of 39%. Crop condition improved two points to 56% good-to-excellent. The lag is most visible in Iowa, the largest producing state, where the state’s Department of Agriculture and Land Stewardship reported only 14% of corn harvested, 20 points behind the five-year average, even as 95% of the crop had reached maturity and 71% was rated good-to-excellent. The slow pace is delaying the peak of harvest selling, which could extend price pressure into late October and early November.
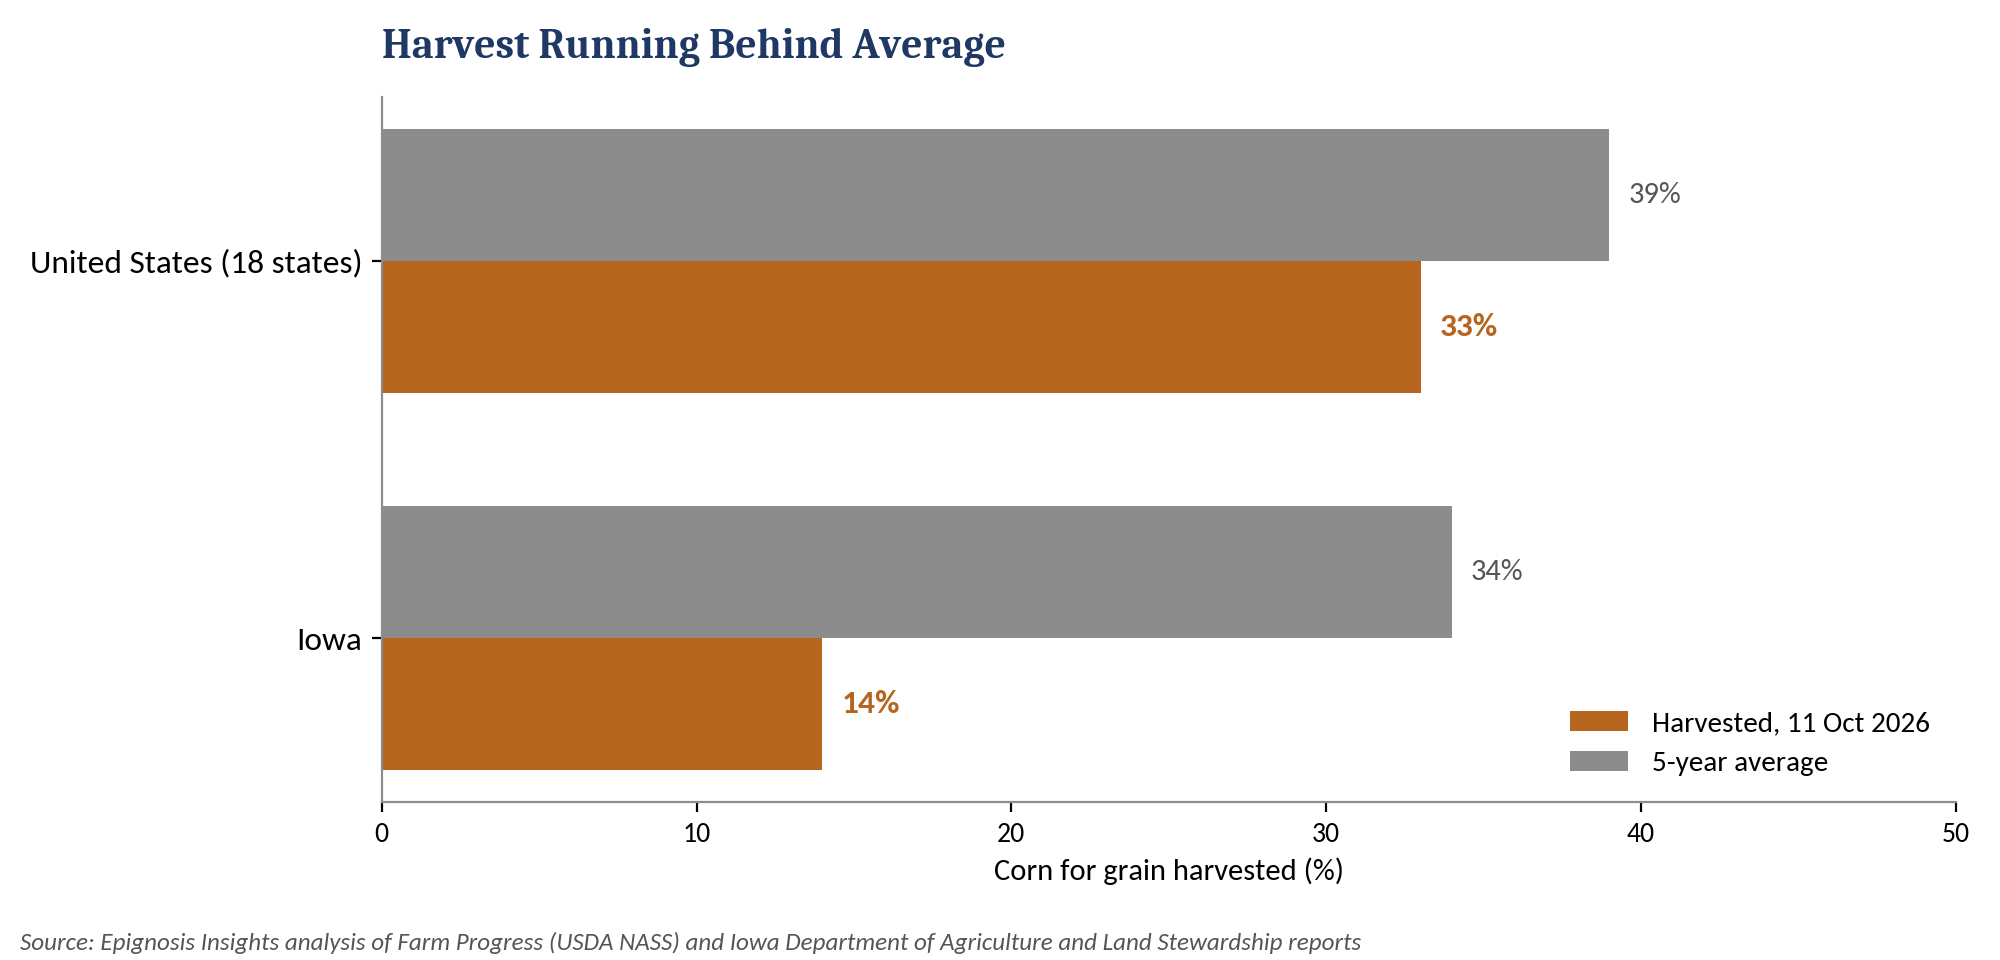
Figure 4: Corn harvest progress vs five-year average
Brazil’s national supply company CONAB released its first survey of the 2026/27 season on 15 October, projecting total corn output of 148.0 million tonnes, up 2.4%, on area up 4.9% to 23.7 million hectares. The second (safrinha) crop is pegged at 113.3 million tonnes and the first crop at 32.1 million tonnes. CONAB projects exports of 43.9 million tonnes and expects domestic consumption to rise 6.6% as corn ethanol expands. For U.S. exporters, a larger Brazilian crop means stiffer competition from mid-2027 onward, which limits the extent to which strong current U.S. export demand can be extrapolated.
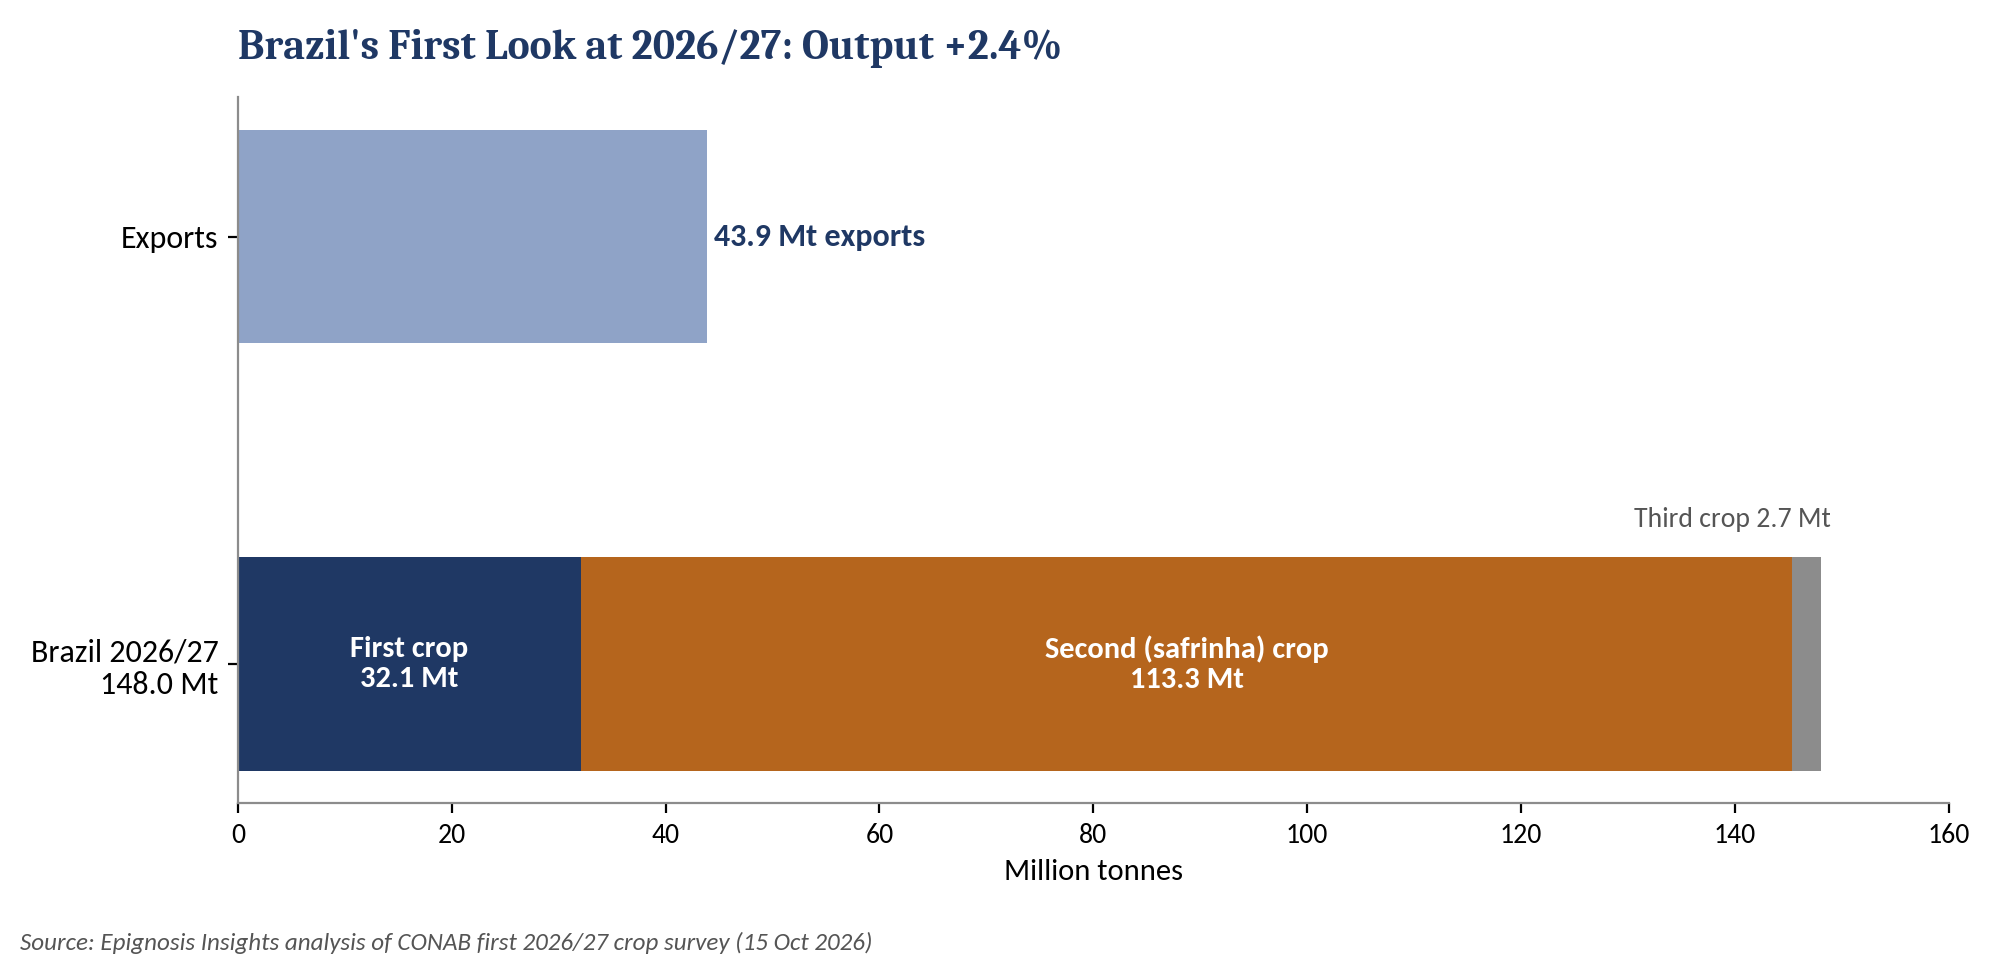
Figure 5: Brazil 2026/27 corn production by crop and exports
Ethanol remains the most important domestic demand channel. The Renewable Fuels Association reported that U.S. ethanol output slipped 2.0% to 1.01 million barrels per day in the week ending 25 September, the lowest since late January, while stocks fell 3.3% to 23.9 million barrels, the lowest of 2026, and exports rose to 142,000 barrels per day. Falling inventories alongside firm exports point to healthy underlying demand, and USDA’s 50-million-bushel increase in ethanol use is consistent with that picture.
Processor margins confirm that demand-side fundamentals are robust. ADM reported second-quarter 2026 Carbohydrate Solutions operating profit of $411 million, up 22% year-on-year, driven primarily by strong North American ethanol margins supported by the finalised Renewable Fuel Standard volume obligations, higher energy prices and lower U.S. corn costs. Its corn dry-milling ethanol business added $52 million in operating profit versus the prior year, and the company raised its full-year adjusted EPS guidance to $5.15–5.60. Epignosis Insights reads this as evidence that low corn prices are already stimulating industrial grind, which should provide a demand cushion below current levels.
Grain Farmers of Ontario observed in its latest market trends report that December corn near $4.79 represented a discount of roughly 65 cents from earlier highs and an opportunity for end users, naming Mexico and China as likely buyers. USDA’s higher export projection of 3.3 billion bushels supports that view, although the number remains about 129 million bushels below last season’s final exports, leaving little room for disappointment.
The wide wheat-over-corn premium noted above matters for global feed demand. At close to $1.86 per bushel, wheat is too expensive to displace corn in most livestock rations, so feed buyers in Asia, the Middle East and North Africa are likely to keep corn as their primary energy grain through the winter. This structurally supports corn’s share of the feed market even when outright prices are under pressure. On the supply side, Epignosis Insights expects U.S. farmer selling to remain disciplined. With the forward curve offering a meaningful storage return and many growers carrying elevated input costs from the 2026 season, there is little incentive to sell large volumes near the harvest low unless cash flow forces it. That behaviour typically tightens country basis once the initial harvest rush fades, and it is one reason Epignosis Insights expects the decline in futures to slow over the next two to three weeks rather than accelerate.
Beyond the U.S., the October WASDE lifted world 2026/27 ending stocks by 8.3 million tonnes to 280.4 million, with the United States accounting for more than 7 million tonnes of the increase. The one notable offset was the European Union, where production was cut from 50.6 to 48.0 million tonnes, increasing the bloc’s import needs. Epignosis Insights expects European buyers to compete more actively for Ukrainian and Brazilian supply in the first half of 2027, which may provide indirect support to U.S. export demand.
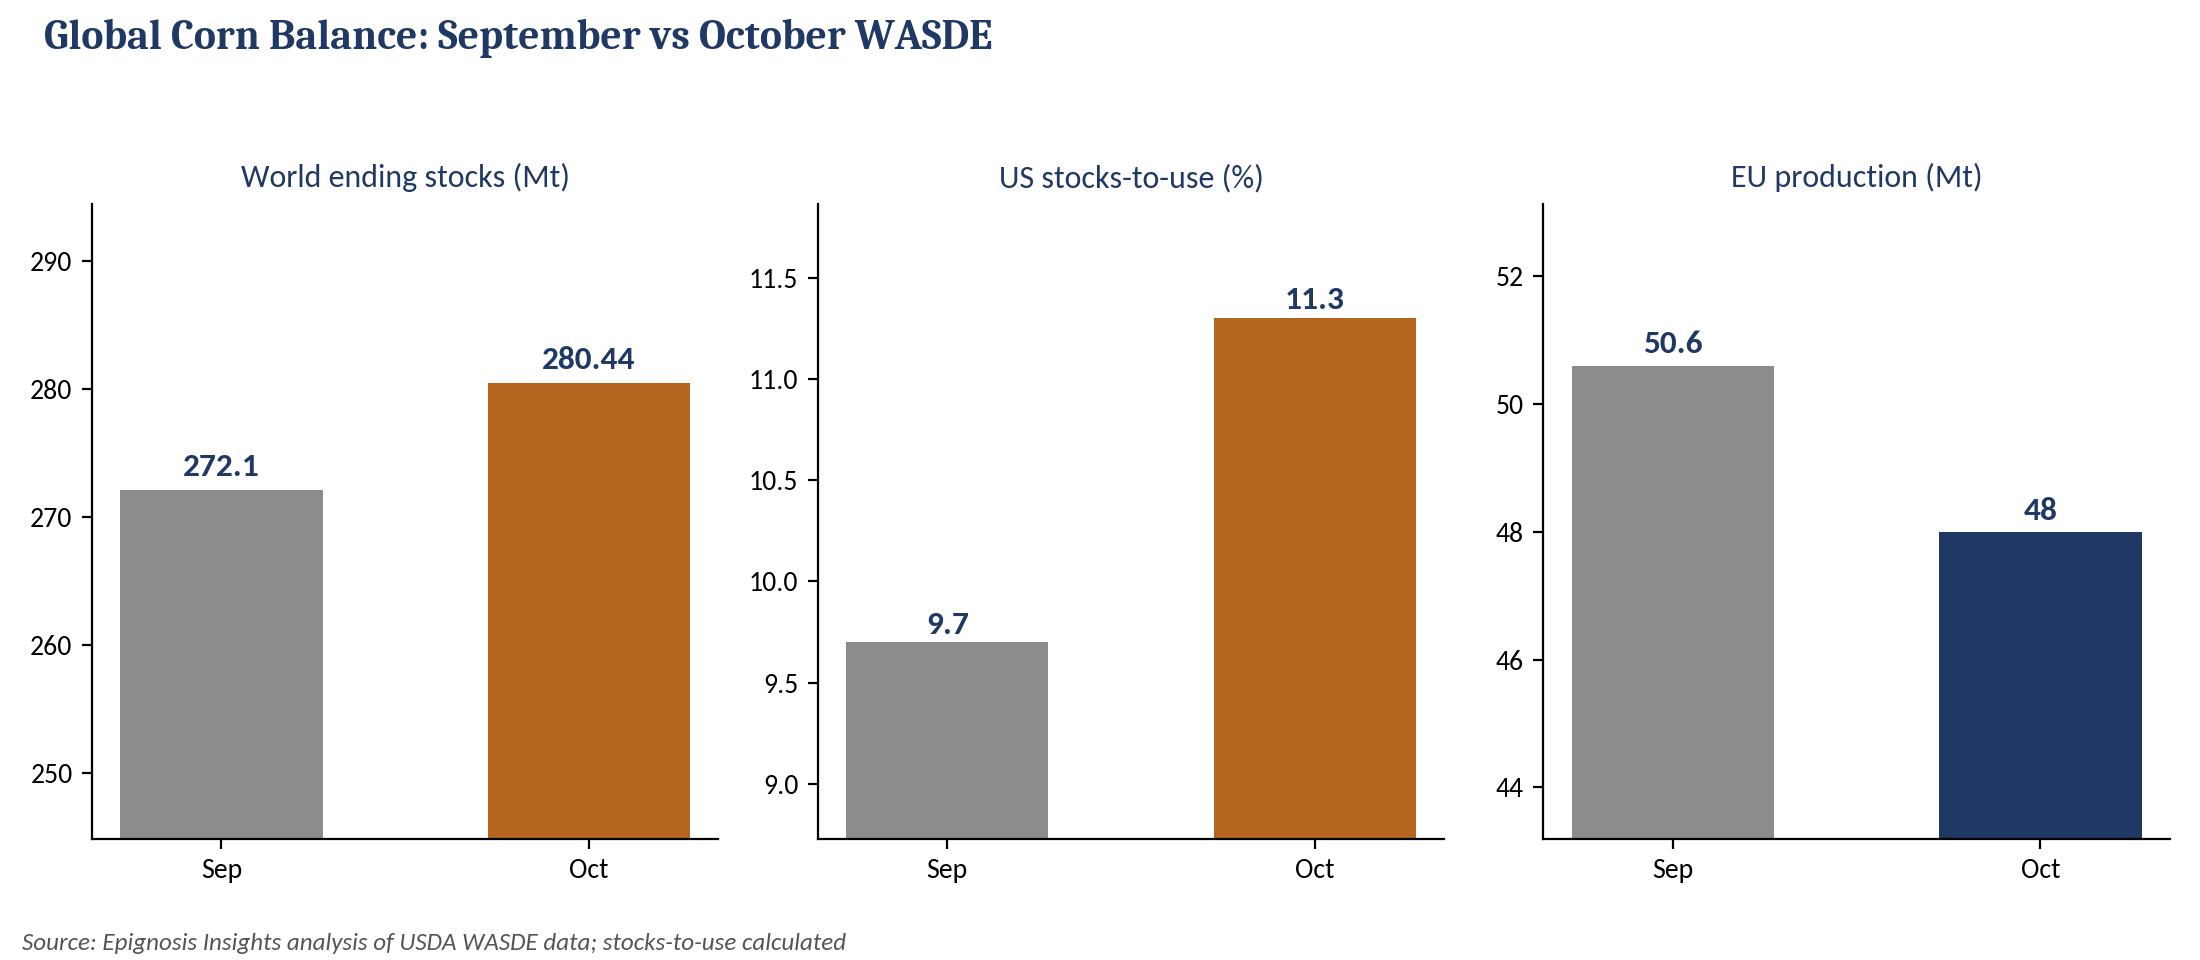
Figure 6: Key global balance changes, September vs October WASDE
Figure 7 summarises the Epignosis Insights driver assessment. Bearish forces are structural and already well documented: a near-record U.S. crop, an 18% jump in projected carryout, higher world stocks and a larger Brazilian outlook. Supportive forces are more incremental but growing: a slow harvest, robust ethanol economics, higher export projections and a smaller EU crop. With futures already trading close to USDA’s season-average price, Epignosis Insights judges that most of the bearish information is now priced, and that the market is transitioning from a news-driven decline to a seasonal harvest low.
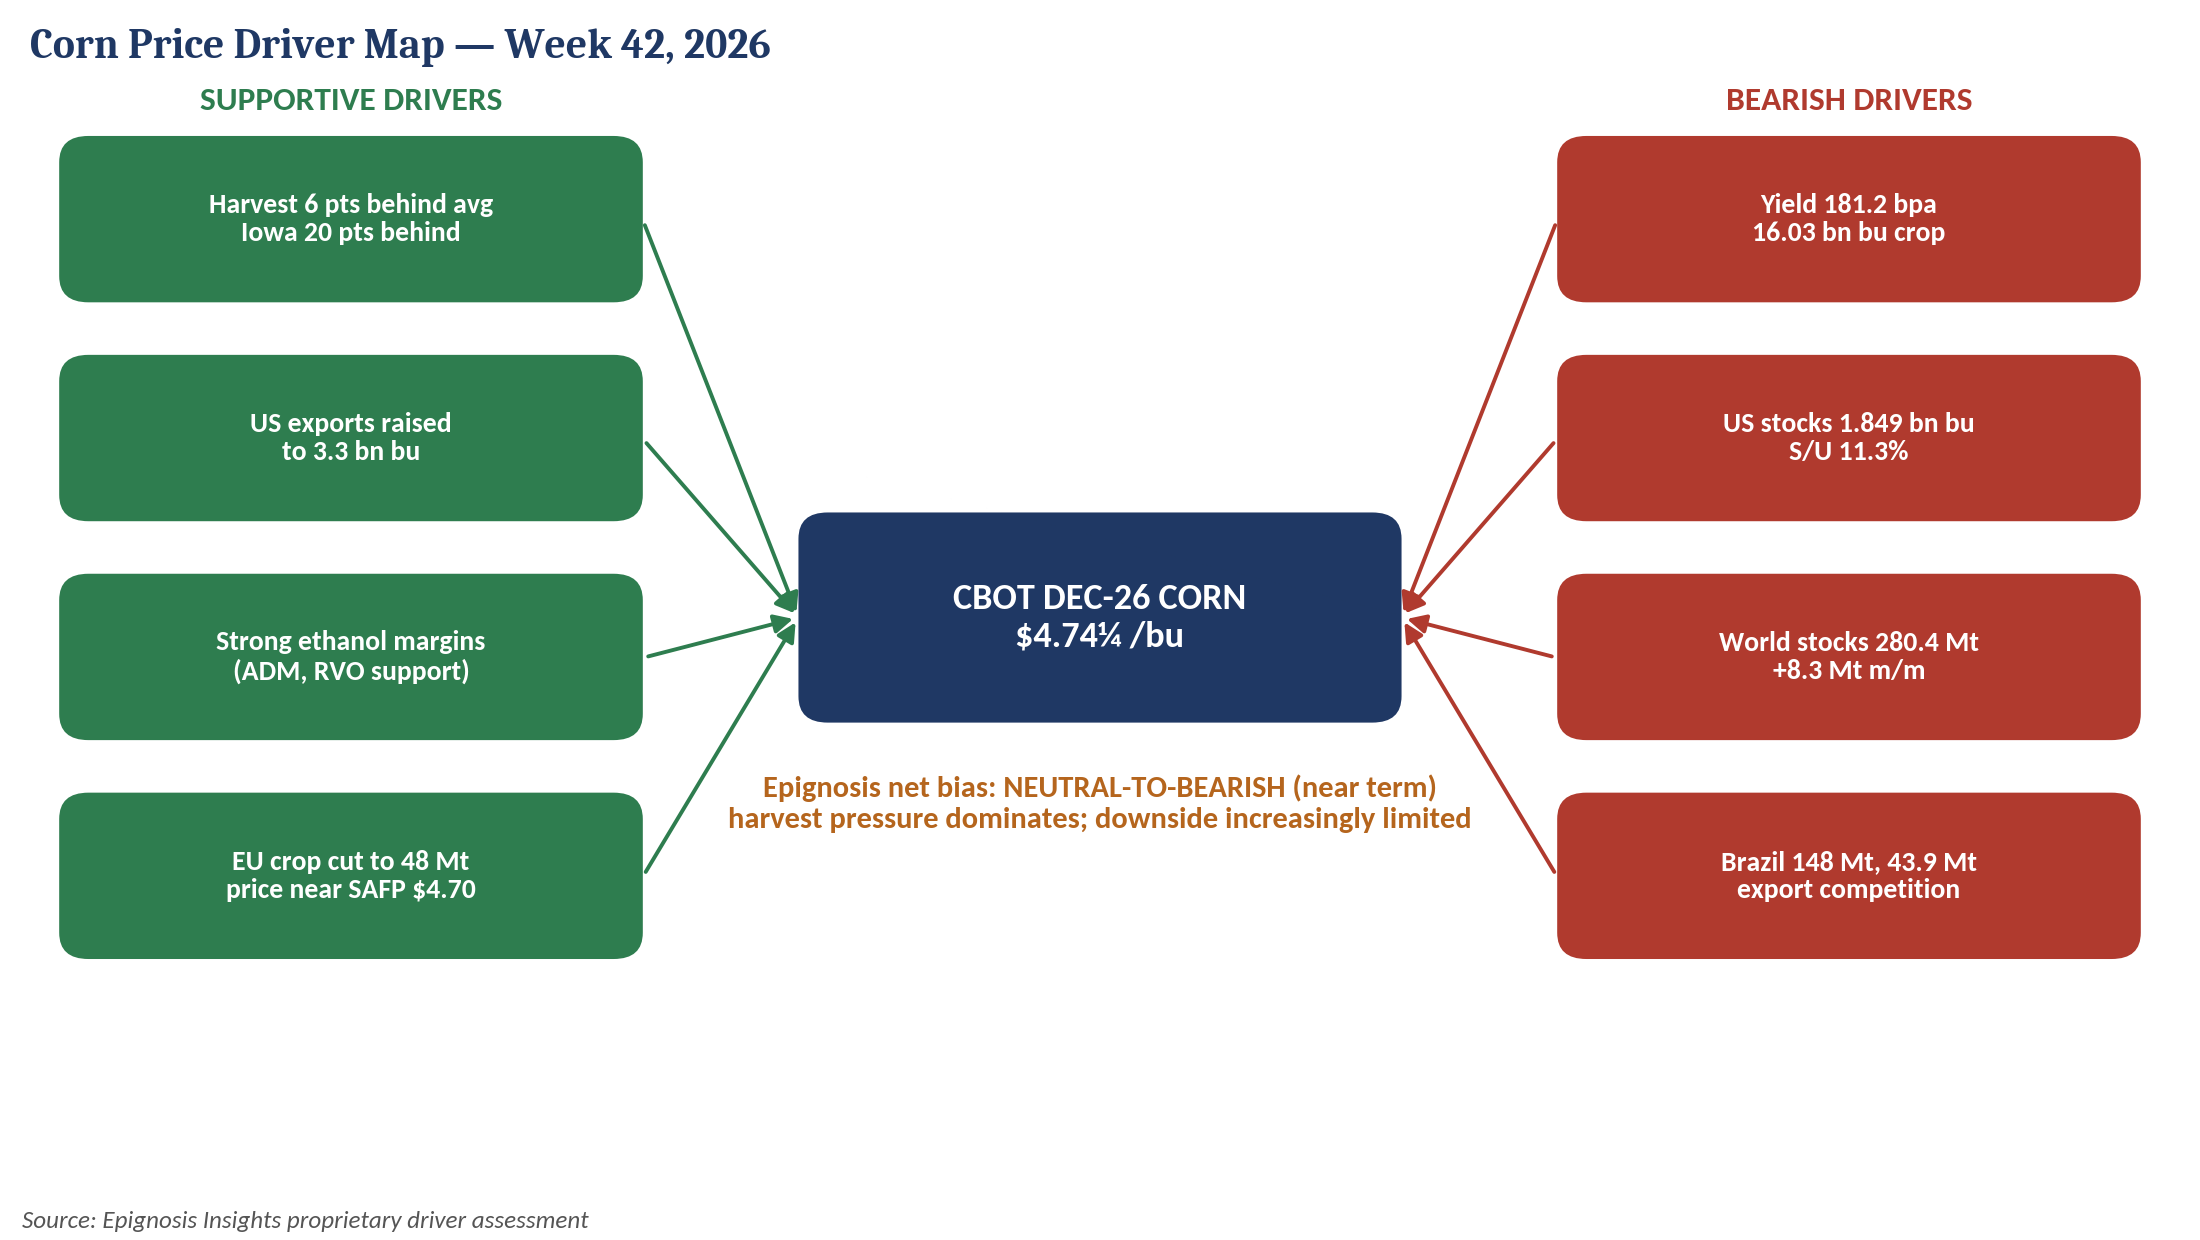
Figure 7: Epignosis Insights corn price driver map
For the week of 19–23 October, Epignosis Insights expects December 2026 corn to trade between $4.62 and $4.86 per bushel, with a neutral-to-bearish bias while harvest selling dominates. A decisive close below the recent $4.70¼ low would likely open a test of $4.60, while improved harvest weather in Iowa would accelerate country selling. Conversely, strong weekly export sales or renewed fund buying could lift prices back toward $4.86. Historically, harvest lows tend to form between early October and early November, and Epignosis Insights sees the risk-reward for end users improving at current levels.
| Scenario | Dec-26 range ($/bu) | Key triggers |
| Base case (55%) | 4.65–4.85 | Harvest advances toward average; steady exports; ethanol demand firm |
| Bear case (25%) | 4.50–4.65 | Fast Iowa harvest; heavy farmer selling; weak export sales; outside market selling |
| Bull case (20%) | 4.85–5.00 | Harvest delays; large flash export sales; short covering; EU import demand |
Source: Epignosis Insights scenario analysis; probabilities are analyst judgement, not statistical forecasts.
For feed millers, ethanol plants and importers, current prices offer a reasonable opportunity to extend coverage into the first quarter of 2027, staggering purchases to manage the risk of a final harvest flush. For farmers, the wide carry in the futures curve argues for storing unpriced grain and using deferred contracts or basis strategies rather than selling cash corn at harvest lows. For exporters, Brazil’s larger 2026/27 crop suggests that the window of U.S. price competitiveness is strongest between now and the arrival of the safrinha harvest in mid-2027.
Key data to watch next week include the USDA crop progress report on harvest pace, weekly export sales and inspections, EIA ethanol production data and any updates to South American planting conditions.