How Friction Points in the Buying Journey Erode Customer Trust
52% of consumers hit friction at checkout, and unresolved issues drop trust from 7.9 to 4.2 within a month. A 1,840-consumer study on friction and trust recovery.


52% of consumers hit friction at checkout, and unresolved issues drop trust from 7.9 to 4.2 within a month. A 1,840-consumer study on friction and trust recovery.
Friction in the buying journey has quietly become one of the most consequential and most underestimated drivers of customer trust erosion. This report examines how specific points of difficulty across the awareness, research, checkout, payment, and post-purchase stages compound to shape whether a consumer completes a purchase, returns for a repeat transaction, or abandons a brand altogether.
Drawing on a consumer research wave covering 1,840 online and omnichannel shoppers, the study finds that 52% of consumers report experiencing friction at the cart and checkout stage alone, making it the single most damaging point in the entire purchase journey. Checkout complexity, hidden fees revealed at the final step, and forced account creation together account for 61% of all friction complaints, and each of these frictions carries a measurable, quantifiable cost in trust.
The central finding of this research is that friction does not merely inconvenience consumers—it actively degrades the psychological contract of trust between a brand and its customer. Consumers who experience an unresolved friction event show a trust score decline of 3.7 points on a 10-point scale immediately after the incident, and that trust does not recover on its own: without active intervention, trust continues to erode over the following month rather than stabilizing. By contrast, consumers whose friction was resolved quickly and transparently recovered to near-baseline trust levels within four weeks, and in some cases reported higher loyalty than before the incident occurred—a pattern consistent with the well-documented "service recovery paradox."
This report walks through the anatomy of friction across the buying journey, quantifies its downstream impact on conversion and trust, and offers a prioritized set of interventions for reducing the friction points that do the most damage. The analysis is structured around five areas: friction incidence by journey stage, the specific friction points consumers cite most often, the checkout funnel impact of accumulated friction, the trust trajectory following a friction event, and channel-level variation in where friction is most acute.
This study surveyed 1,840 consumers who had made at least one online or omnichannel purchase in the preceding 90 days, spanning retail, electronics, fashion, and quick-commerce categories. Respondents were asked to recall specific points of difficulty encountered during their most recent purchase journey, rate the severity of each friction point, and report their trust and satisfaction levels before, immediately after, and at intervals following the incident. A supplementary behavioral dataset drawn from anonymized clickstream and checkout funnel analytics across participating retail partners was used to validate self-reported abandonment patterns against actual observed drop-off. Friction points were coded into a standard taxonomy covering discovery, research, checkout, payment, confirmation, and post-purchase support stages to allow consistent comparison across brands and categories.
Friction is not evenly distributed across the customer journey. This wave’s data shows a clear concentration around the transactional core of the journey—cart and checkout (52%), payment (47%), and post-purchase support (39%)—while the earlier discovery and awareness stage registers comparatively low friction at 18%. This pattern makes intuitive sense: friction becomes more consequential, and more memorable, the closer a consumer is to committing money and personal information. A consumer who encounters a confusing product page during browsing can simply move on with minimal emotional cost; a consumer who encounters an unexpected obstacle after entering payment details experiences a much sharper form of frustration, because the perceived investment in the transaction is already high.
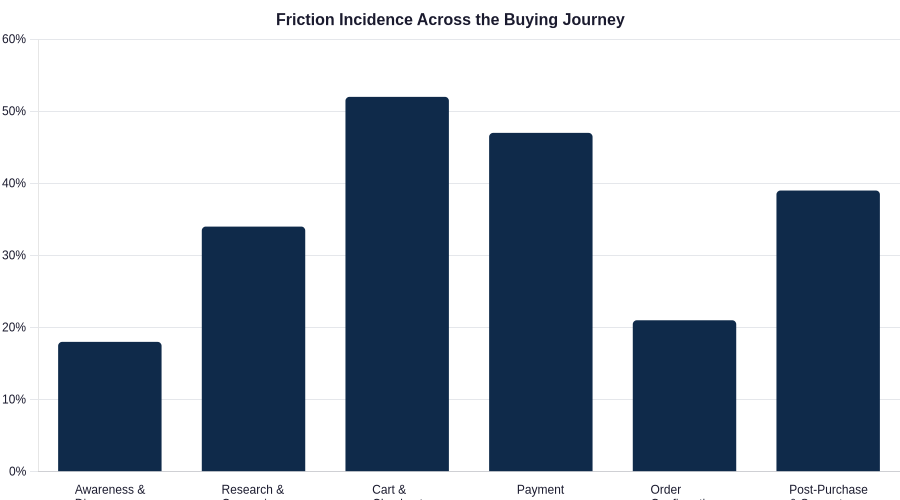
Figure 1: Share of consumers reporting friction at each stage of the buying journey.
The research stage (34%) and post-purchase support stage (39%) also warrant attention, though for different reasons. Research-stage friction tends to stem from inconsistent product information across channels, confusing comparison tools, or unclear pricing, and functions primarily as a consideration-stage deterrent rather than a trust-eroding event, since the consumer has not yet made a commitment. Post-purchase friction, by contrast, occurs after the sale is complete and the trust relationship is already active—making it disproportionately damaging on a per-incident basis, since it directly contradicts the reassurance a consumer expects once a transaction has been finalized.
When asked to identify the single most frustrating aspect of a recent purchase, consumers converged heavily around a small number of specific, addressable issues. Complex or unnecessarily long checkout flows top the list at 24% of complaints, followed by hidden fees—shipping charges, taxes, or service fees—that appear only at the final payment step (21%). Forced account creation, where a consumer is required to register before completing a purchase, accounts for 16% of complaints, while slow page or app load times (14%), limited payment method options (11%), unclear return policies (9%), and unresponsive customer support (5%) round out the top seven.
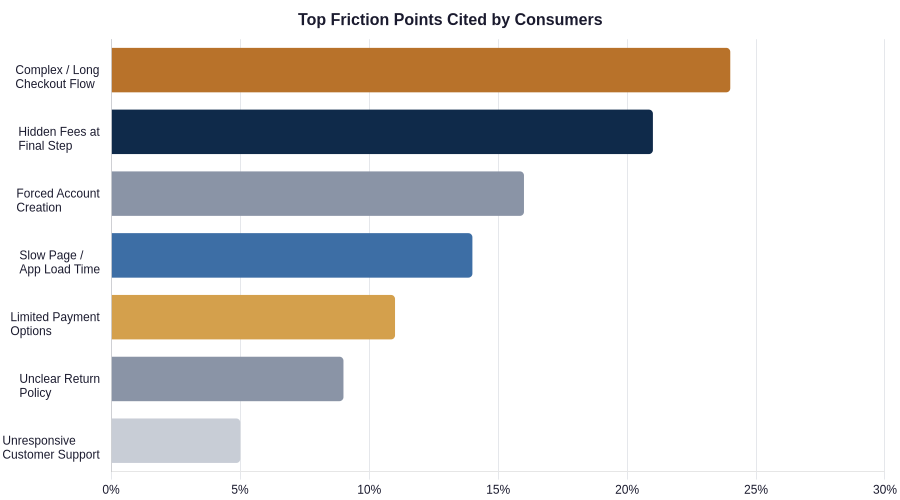
Figure 2: Ranked friction points cited by consumers as most damaging to their purchase experience.
What unites the top three friction points—checkout complexity, hidden fees, and forced registration—is that each represents a broken expectation rather than a simple usability flaw. Consumers do not merely dislike a long checkout form; they experience it as evidence that the brand has not prioritized their time. Hidden fees are particularly corrosive because they introduce a sense of being misled at the exact moment a consumer is being asked to commit financially, which research consistently links to sharper trust penalties than friction encountered earlier in the journey when expectations are still forming. Forced account creation, meanwhile, is frequently interpreted by consumers as the brand prioritizing its own data collection over the customer’s immediate goal of completing a purchase—a misalignment of incentives that consumers notice and resent even when they cannot always articulate it precisely.
Behavioral data collected alongside the survey confirms that these friction points translate directly into measurable drop-off. Of consumers who add an item to their cart, only 68% proceed to reach checkout, 51% go on to enter payment details, and just 41% complete the purchase—meaning that more than half of initiated purchases are abandoned somewhere between cart and confirmation. While not all of this drop-off is attributable to friction alone (some reflects genuine changes of mind), the correlation between self-reported friction incidents and funnel-stage abandonment is strong: consumers who report encountering a specific friction point at a given stage are more than twice as likely to abandon at that same stage compared to consumers who report no friction.
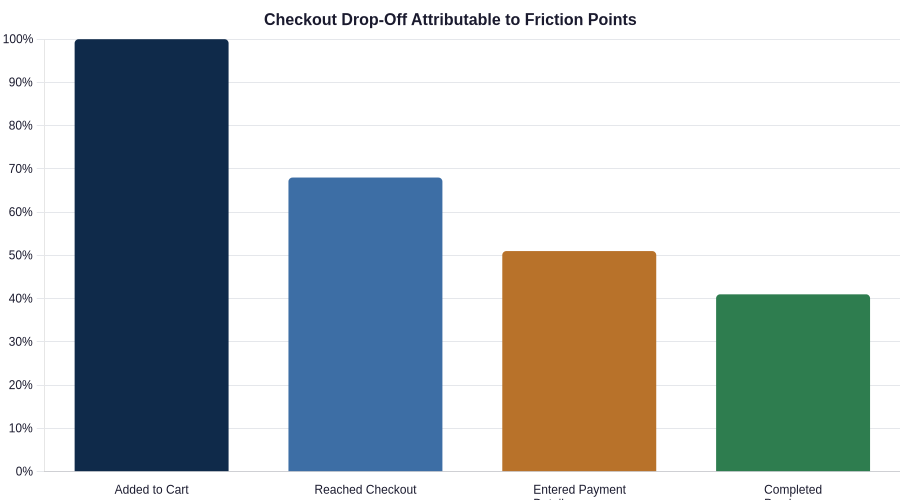
Figure 3: Checkout funnel drop-off from cart addition through purchase completion.
This funnel data reframes friction reduction as a direct revenue lever rather than a purely experiential concern. Even modest reductions in checkout-stage friction—simplifying form fields, surfacing full pricing earlier in the flow, or offering guest checkout as a default rather than an opt-out—translate into measurable improvements in completion rates, independent of any change in product, price, or marketing spend. This makes friction reduction one of the highest-leverage, lowest-cost interventions available to brands seeking to improve both conversion and long-term trust simultaneously.
The most consequential finding in this research concerns what happens to consumer trust after a friction event, and specifically whether that trust recovers on its own. Baseline trust scores among surveyed consumers averaged 7.9 out of 10 prior to any friction incident. Immediately following a friction event, trust dropped to 6.8 among consumers whose issue was resolved quickly, but fell further, to 5.1, among consumers whose friction went unresolved or ignored. Critically, the two groups diverge sharply from that point forward: consumers who received a fast, transparent resolution saw trust climb back to 7.8—effectively fully recovered—within one month, while consumers whose friction was left unaddressed saw trust continue to decline, falling to 4.2 by the same point.
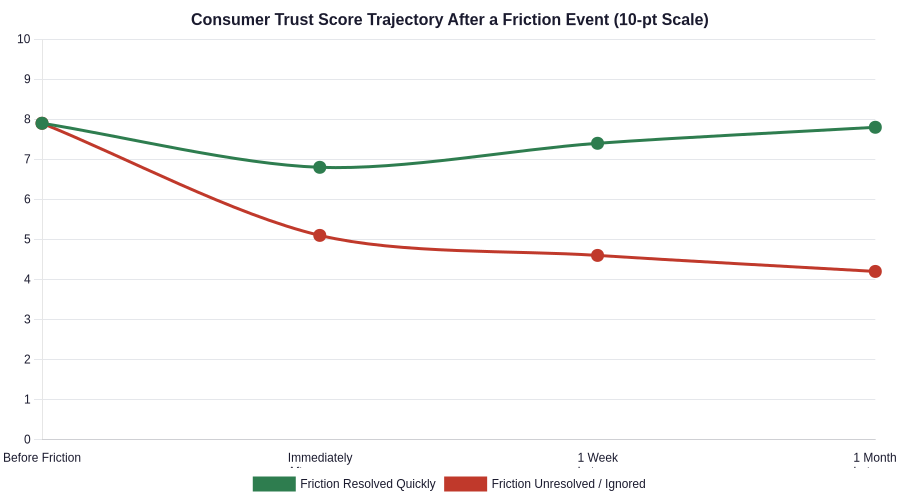
Figure 4: Trust score trajectory following a friction event, resolved versus unresolved.
This divergence is the clearest evidence in the study that friction itself is not the primary determinant of long-term trust damage—the brand’s response to friction is. A friction event handled well can leave trust essentially undamaged, and in some individual cases, elevated beyond baseline as consumers register the brand’s responsiveness as a positive signal. A friction event left unaddressed, however, does not simply plateau at a lower trust level; it compounds, as consumers appear to reinterpret the original incident more negatively over time in the absence of any corrective signal from the brand. This has direct implications for how organizations resource complaint handling and service recovery: speed and transparency in addressing friction are not secondary considerations but the primary determinants of whether a single bad moment becomes a permanent shift in the customer relationship.
Friction incidence also varies meaningfully by purchase channel. Mobile web registers the highest friction incidence at 44%, followed by third-party marketplace purchases at 38%, desktop web at 31%, native mobile apps at 29%, and in-store digital kiosks at just 19%. The gap between mobile web and native app experiences is particularly notable, since both are accessed on the same device class—this suggests that the friction differential is attributable less to the constraints of mobile screens and more to the comparatively weaker design investment many brands make in their mobile web experience relative to their dedicated app.
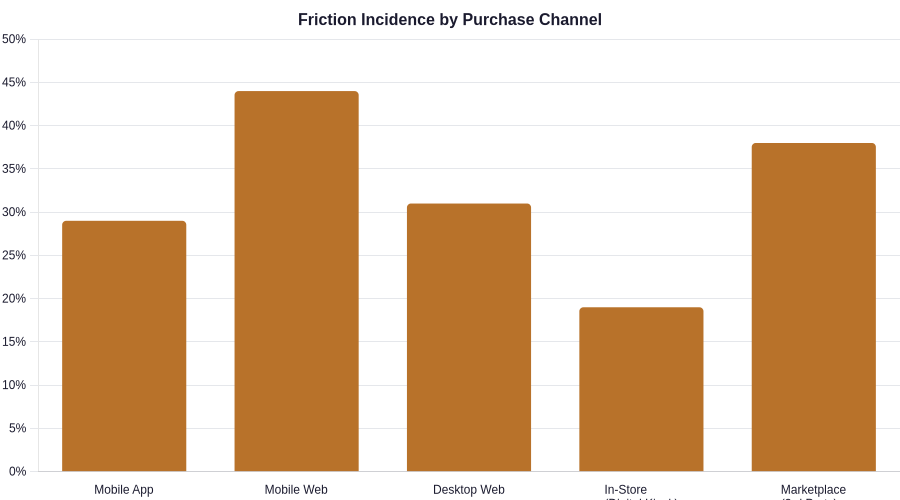
Figure 5: Friction incidence by purchase channel.
Marketplace purchases present a distinct challenge: friction experienced on a third-party platform is often attributed by consumers to the brand being sold rather than to the marketplace operator, meaning brands can suffer trust damage from friction they do not directly control. This makes marketplace checkout experience an area that brands frequently under-monitor relative to its actual reputational exposure, and one that merits closer collaboration with marketplace partners on checkout design standards.
In-store digital kiosks register the lowest friction incidence of any channel at 19%, a finding that is instructive rather than simply reassuring. Kiosk interactions are typically narrower in scope—covering a single task such as price-checking, click-and-collect, or loyalty enrollment—and are frequently supported by nearby staff who can intervene the moment a customer appears confused. This combination of task simplicity and human backup suggests that the lower friction observed in-store is not purely a function of the channel itself, but of constrained scope and available assistance, both of which are principles that digital-only channels can borrow even though they cannot replicate a physical presence.