Churn Prediction Models: Using Experience Data to Prevent Customer Loss
Epignosis Insights Research Desk — Compiled and analyzed from government, industry association, corporate, consulting, and news sources


Epignosis Insights Research Desk — Compiled and analyzed from government, industry association, corporate, consulting, and news sources
This report, compiled and analyzed by the Epignosis Insights Research Desk from primary company disclosures, government records, and third-party research, examines how experience data is being used to predict and prevent customer churn and what the evidence says about whether that effort is working. The economic case is not new: Bain & Company’s long-standing research, still the most cited benchmark in the field, finds that a 5-point improvement in customer retention can lift profits by 25% to 95% depending on the industry. What has changed is the data available to act on that economics. U.S. wireless carriers, among the most data-mature retention operators in any industry, now disclose postpaid churn every quarter down to the hundredth of a percentage point T-Mobile and AT&T both reported churn near 0.85% in the second quarter of 2026 while broader research from Forrester finds that most brands’ overall customer experience quality is stagnant or declining, and TSIA data shows still-modest adoption of analytics-driven retention tooling across the technology and services sector. Read together, the evidence compiled here suggests that experience-data-driven churn prediction works decisively where it has been operationalized at scale, but that scale itself remains the exception rather than the rule.
The foundational research behind churn prediction’s business case comes from Bain & Company’s Frederick Reichheld, whose analysis now decades old but still the reference point cited across the industry established that a 5-percentage-point increase in customer retention rates increases profits by 25% to 95%, with the range driven by industry-specific customer lifecycle economics. Bain’s underlying logic is that customer relationships are frequently unprofitable in their early years because acquisition costs outweigh initial revenue, and only become profitable as the cost of serving a loyal, familiar customer falls while their purchase volume rises. That means the marginal value of preventing a churn event grows the longer a customer has already been retained — which is precisely the population that churn prediction models are best positioned to protect, since long-tenured customers generate the richest behavioral and support-interaction data for a model to learn from.
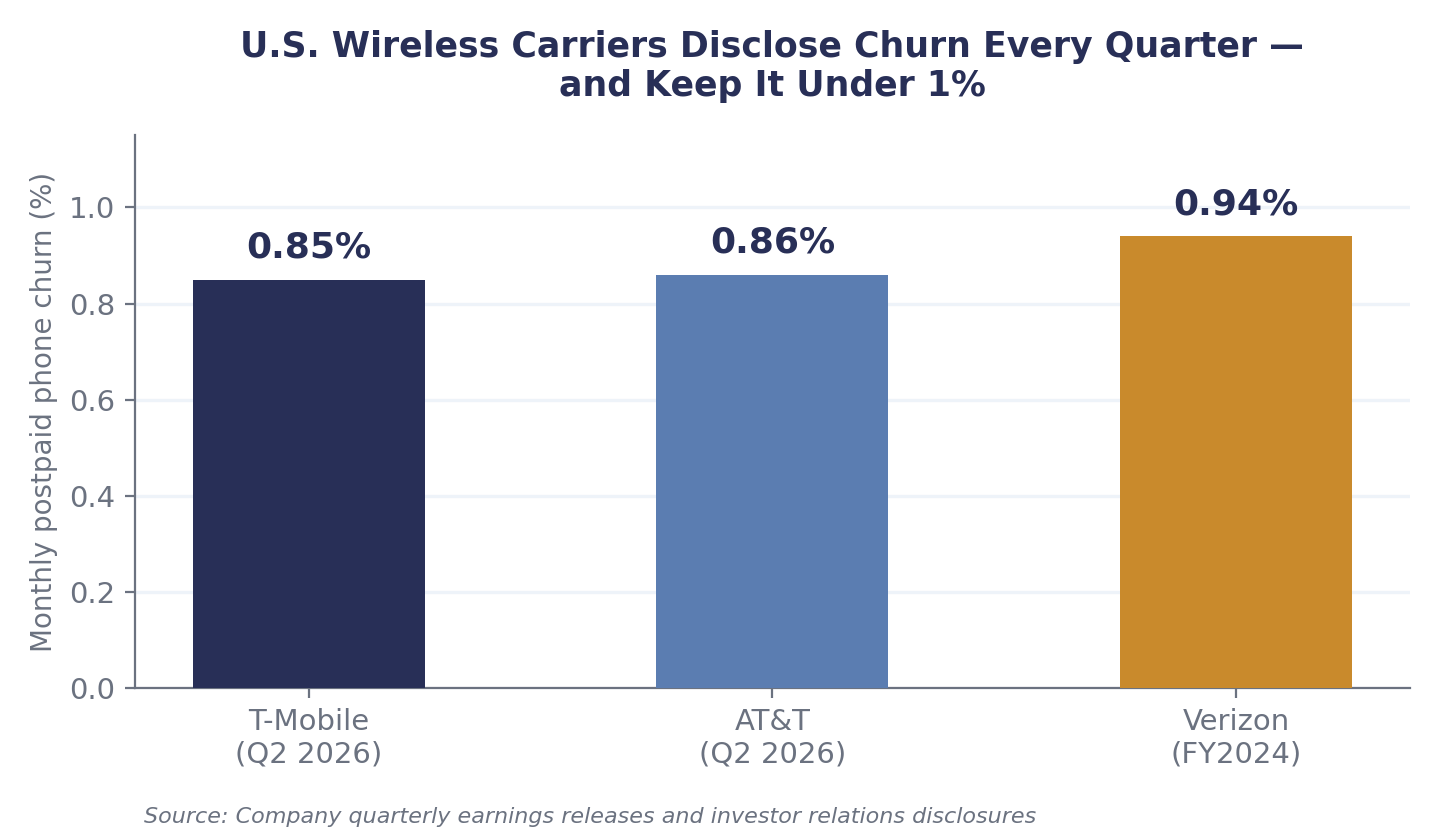
Figure 1: Bain & Company’s retention-to-profit research, low and high ends of the documented range.
U.S. wireless carriers offer the clearest public evidence that data-driven churn management delivers measurable results, because they are required to disclose churn metrics to investors every quarter. T-Mobile reported postpaid phone churn of 0.85% in the second quarter of 2026, and AT&T reported 0.86% for the same period down from 0.87% a year earlier, according to AT&T’s own investor materials. Verizon’s comparable disclosed figure for fiscal year 2024 was approximately 0.94%, historically the highest of the three major carriers. Annualized, these numbers translate to roughly 10–11% yearly postpaid churn a figure that independent analysis compiled by procurement research firm ChurnCost notes is remarkably low compared to SaaS businesses of similar revenue scale, which typically run 12–20% annual logo churn for enterprise customers and 25–40% for small and mid-sized business segments. The carriers achieve this through a combination of structural switching costs, such as number-porting friction and contract terms, and heavily institutionalized, data-driven retention spend wireless operators track subscriber acquisition cost payback, typically $250–$400 per subscriber, as a board-level KPI specifically because a churn event before that cost is recovered represents a direct, quantifiable loss.
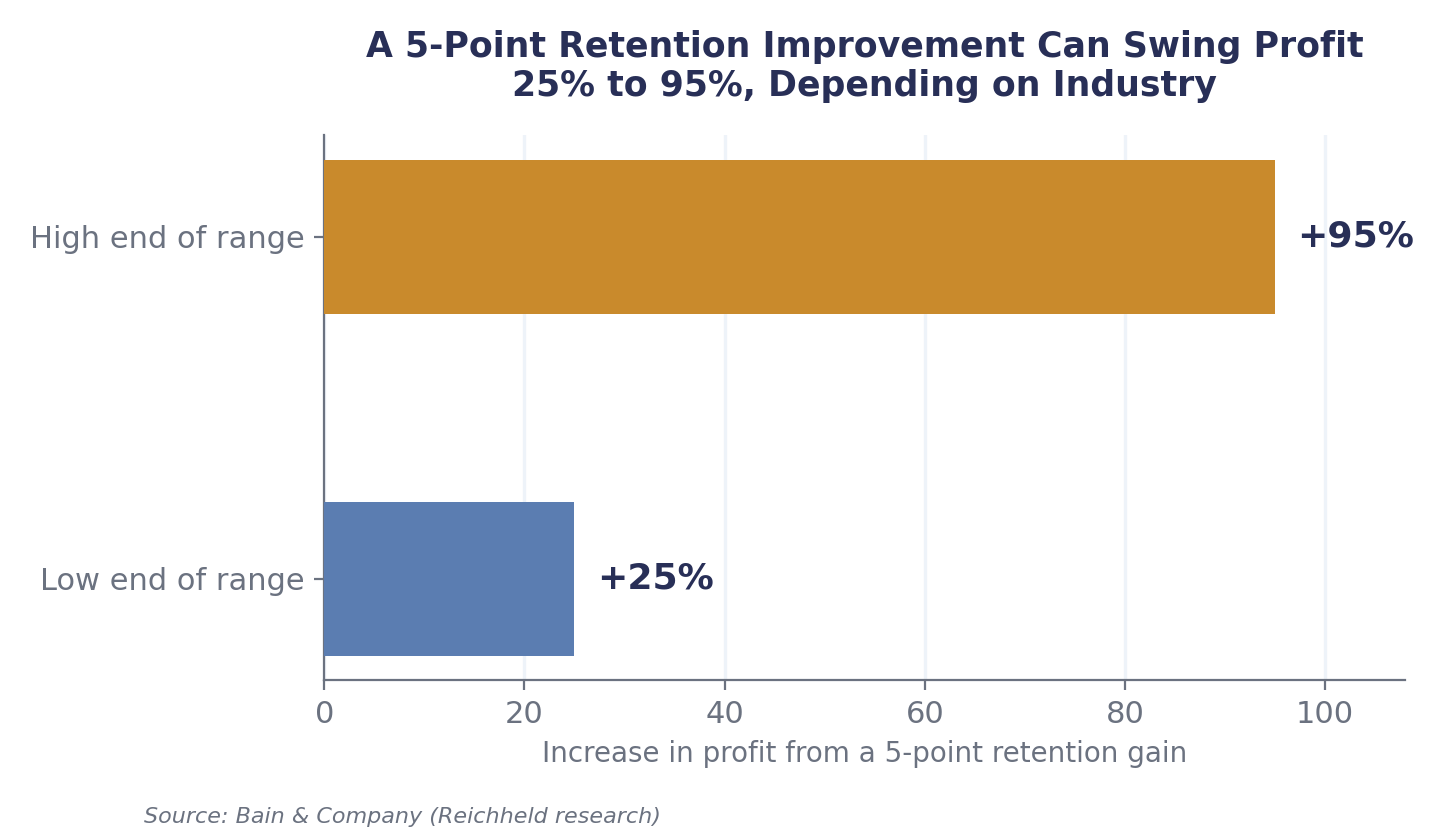
Figure 2: Disclosed postpaid phone churn rates, major U.S. wireless carriers.
Outside the telecom sector’s tightly optimized retention discipline, the picture is considerably less encouraging. Forrester’s 2025 Global Customer Experience Index, which analyzed more than 275,000 customer perceptions of 469 brands across 12 industries and 13 countries, found that 21% of brands’ CX scores declined year over year, only 6% improved, and 73% were statistically unchanged continuing what Forrester principal analyst Pete Jacques described as "a concerning multiyear downward trend" in overall experience quality. This matters directly for churn prediction because customer experience quality is a leading input to most churn models: declining CX scores generally precede rising churn risk scores, and a market where three-quarters of brands show no measurable CX improvement suggests that many organizations are collecting churn-relevant data without translating it into experience changes that actually move the underlying risk. Separately, Forrester research on predictive customer intelligence found that companies operationalizing predictive models into active retention workflows reduce churn by 15% to 25% compared with organizations relying on reactive, after-the-fact retention programs — a gap that represents the difference between merely measuring churn and actually preventing it.
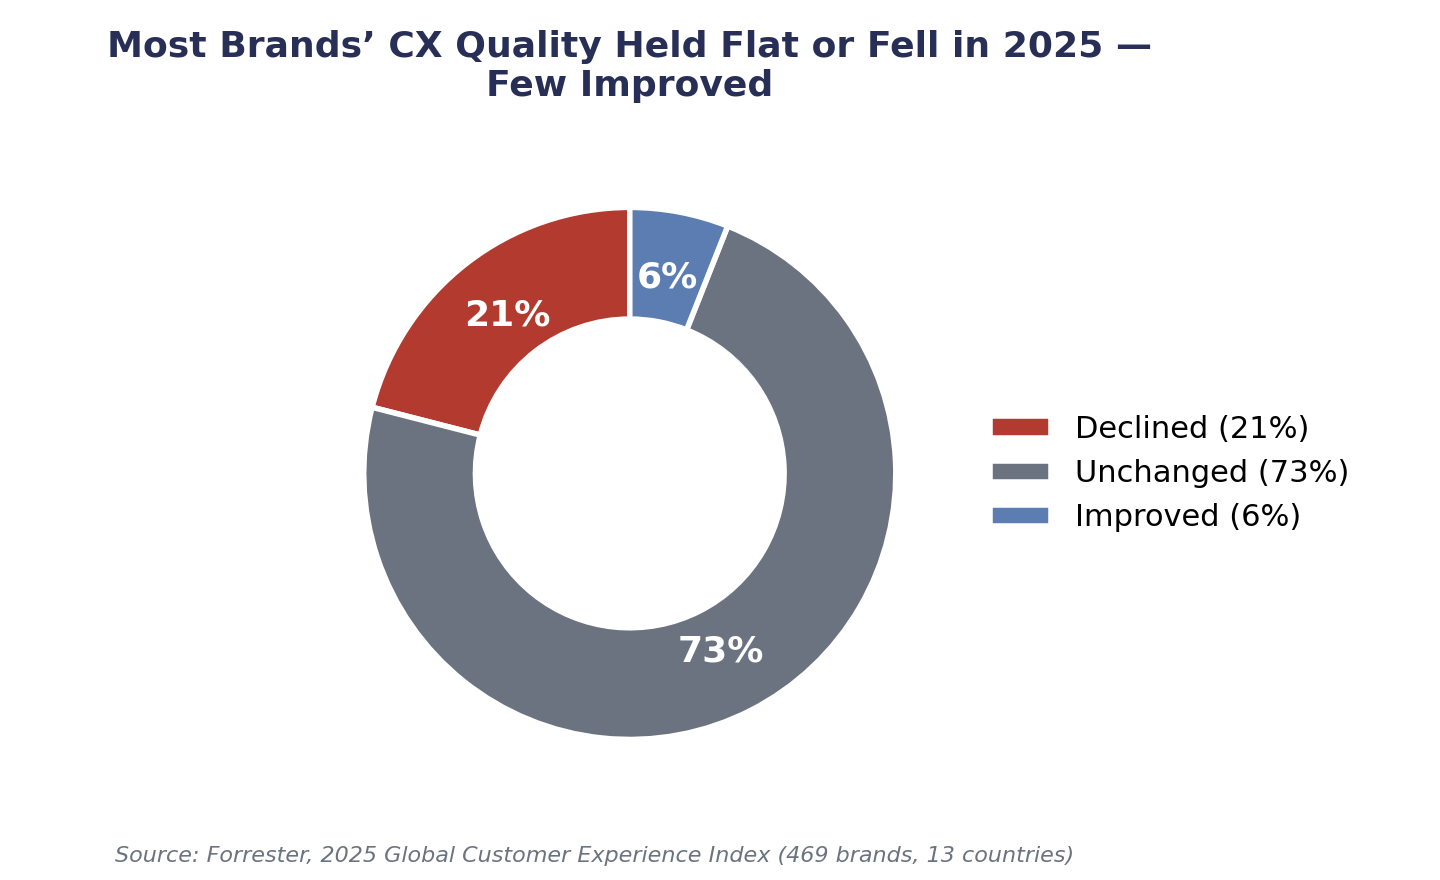
Figure 3: Year-over-year change in customer experience quality across 469 global brands.
Data from the Technology &Services Industry Association (TSIA), the primary research and benchmarking body for the technology and services sector, helps explain why the results above are so uneven: adoption of the underlying analytics capability is still building. TSIA’s member benchmarking found that the share of organizations with meaningful data-and-analytics capability supporting customer retention rose from just 17% in the first half of 2023 to 28% in the first half of 2024 real growth, but still leaving roughly seven in ten technology and services companies without mature retention analytics as of that survey. TSIA’s longer-running benchmark research has also quantified the mechanism by which this capability translates into results: companies that maintain a consistent monthly or quarterly customer contact strategy proactively communicating product value rather than waiting for a renewal conversation churn at rates roughly 6 percentage points lower than companies with no consistent contact cadence, and TSIA member data shows that on average 22% of cancellations occur specifically because the customer never perceived enough value to justify the cost, a category of churn that is directly addressable by data that flags declining product engagement before cancellation.
Churn prediction does not operate in a regulatory vacuum, and the enforcement environment increasingly constrains how companies can respond once a model flags a customer at risk. The Federal Trade Commission finalized its "Click-to-Cancel" Negative Option Rule in October 2024, requiring subscription businesses to make cancellation at least as simple as sign-up and to obtain express informed consent before charging customers — rules aimed directly at the kind of retention "save offers" and friction-based cancellation flows that churn-response playbooks have historically relied on. Although the Eighth Circuit vacated the rule in July 2025 on procedural grounds, the FTC has continued enforcing the same underlying principles under the Restore Online Shoppers’ Confidence Act and Section 5 of the FTC Act, securing settlements against companies including Match.com, Chegg, and Amazon over auto-renewal practices, and filed a draft Advance Notice of Proposed Rulemaking in January 2026 to revive a formal rule. Roughly 30 U.S. states have also enacted their own automatic-renewal statutes. The practical implication for churn prediction programs is that the model’s output a flagged at-risk customer must now be paired with retention offers and cancellation flows that satisfy a growing patchwork of disclosure and consent requirements, not simply the most conversion-optimized save-offer sequence available.
Synthesizing the government, industry association, corporate, and consulting-firm data compiled in this report, three conditions recur wherever churn prediction demonstrably works. First, disclosure discipline: the wireless carriers’ quarterly public churn reporting creates continuous internal accountability that most industries, lacking any external reporting requirement, do not replicate. Second, proactive contact cadence: TSIA’s data linking consistent customer contact to a 6-point churn reduction indicates that the value of a churn model is realized only when its output triggers outreach before a cancellation decision is made, not after. Third, regulatory-compliant retention response: with FTC enforcement active regardless of the vacated federal rule’s status, the highest-performing retention programs are the ones designing save-offer and cancellation flows around consent and transparency rather than friction, since a flagged customer met with an aggressive retention tactic exactly the pattern the FTC has targeted in recent settlements — risks converting a preventable churn event into a regulatory one.
The gap between telecom’s sub-1% monthly churn and the double-digit annual churn typical of SaaS and e-commerce is not simply a data-maturity gap it reflects fundamentally different switching economics that any churn model has to account for. Wireless subscribers face genuine friction to leave: number porting, family plan entanglements, device financing balances, and multi-year contract terms all raise the practical cost of churning regardless of how compelling a competitor’s offer looks, which means a wireless churn model is predicting a comparatively rare, high-friction event. SaaS and subscription commerce customers face none of these structural barriers, so their churn models are predicting a much more frequent, lower-friction decision, and industry benchmarks compiled from Bain, Forrester, and Gartner research cited across the trade press put typical monthly SaaS churn at 3–5% for small and mid-sized business segments versus roughly 1% or less for enterprise contracts with longer renewal cycles. This distinction matters operationally: a churn model built for a low-friction subscription business needs to intervene earlier and more frequently than a telecom-style model, because the behavioral warning window before a low-friction cancellation is typically shorter than before a high-friction one.
Much of the commentary around churn prediction focuses on model selection which algorithm, which feature set but the evidence compiled in this report suggests the more binding constraint for most organizations is the completeness and timeliness of the underlying experience data feeding those models. TSIA’s benchmarking work explicitly ties analytics maturity to retention outcomes, and the fact that 72% of technology and services firms still lack mature retention-analytics capability as of TSIA’s most recent survey period suggests that for most companies, the binding constraint on churn prediction accuracy is not modeling technique but the absence of clean, integrated support-interaction, product-usage, and billing data in the first place. Wireless carriers again illustrate the alternative: because postpaid billing, network usage, device status, and support-contact history all sit within a single operator’s systems by regulatory and operational necessity, their churn models train on a far more complete behavioral picture than a typical SaaS company assembling similar signals across disconnected CRM, product-analytics, billing, and support-ticketing platforms. Any organization evaluating its own churn prediction investment should therefore weigh data integration work at least as heavily as model sophistication, since a highly accurate model trained on incomplete data will still miss the churn signals that live in the systems it was never connected to.
The data compiled by Epignosis Insights for this report points toward a widening gap between churn-prediction leaders and laggards rather than industry-wide convergence. Telecom’s sub-1% churn discipline required years of institutionalized investment and continuous public accountability that most sectors have not built. Forrester’s finding that only 6% of brands improved CX quality in 2025, against TSIA’s finding that only 28% of technology and services firms have mature retention analytics even after a year of growth, suggests the majority of the market remains in an early, largely reactive stage of churn management. For organizations building or upgrading a churn prediction program, the evidence assembled here argues for prioritizing the operational loop proactive contact, compliant retention offers, and continuous public or internal accountability for the resulting churn number over further investment in prediction accuracy alone, since the data suggests the gap between the two is where most of today’s preventable customer loss actually occurs.
| Metric | Figure |
| Profit lift from a 5-point retention improvement | 25%–95% |
| T-Mobile postpaid phone churn, Q2 2026 | 0.85% |
| AT&T postpaid phone churn, Q2 2026 | 0.86% |
| Brands whose CX quality declined in 2025 | 21% |
| Churn reduction from predictive vs. reactive retention | 15–25% |
| Tech/services firms with analytics-driven retention capability (H1 2023→H1 2024) | 17%→28% |
| Federal Click-to-Cancel Rule status | Vacated Jul. 2025; ANPRM filed Jan. 2026 |