Key Findings
- Global C/C composites market is projected to reach USD 5,251.8 million by 2031 from USD 3,080.6 million in 2025, growing at a 9.3% CAGR over 2025–2031.
- Global C/C composites consumption is estimated at 18,585 tons in 2025 and is forecast to reach 34,479 tons by 2031, a volume CAGR of 10.85%.
- The blended average selling price is expected to ease from USD 165.8 per kg in 2025 to USD 152.3 per kg in 2031 as lower-priced industrial grades gain weight in the volume mix.
- The market adds a near-constant USD 361.9 million in value every year, so percentage growth moderates from 11.7% in 2026 to 7.4% in 2031 even as absolute gains hold steady.
- Aerospace items are the largest application by value at 41.2% of 2025 revenue, while CZ and DSS furnaces are the largest by volume at 36.3% of 2025 tonnage.
- Unidirectional structure materials account for 57.6% of 2025 value, while bi-directional materials grow fastest at a 10.07% CAGR.
- North America holds 46.1% of global value in 2025, while APAC records the fastest regional value growth at 10.30% CAGR.
- India is the fastest-growing country market by value at 12.04% CAGR, while Germany leads European growth at 11.04%.
- Energy intensity and long densification cycles remain the main structural constraints on capacity additions and cost reduction.
- Record orbital launch activity and commercial fleet expansion are widening demand for high-temperature structural and friction-grade C/C components.
Global C/C Composites Market Outlook
Global Global C/C Composites Market recorded revenue of USD 1,995.0 million in 2022 and USD 2,718.7 million in 2024. Epignosis Insights estimates the market at USD 3,080.6 million in 2025 and projects it to reach USD 3,442.5 million in 2026, USD 4,166.2 million in 2028 and USD 5,251.8 million by 2031. Over the 2025–2031 forecast period, the market grows at a compound annual rate of 9.3%, adding USD 2,171.2 million in annual revenue.
Carbon-carbon composites consist of carbon fibre reinforcement embedded in a carbon matrix, typically produced through chemical vapour infiltration, liquid resin or pitch impregnation followed by carbonisation, and high-temperature graphitisation. The material retains mechanical strength at temperatures above 2,000°C in inert atmospheres, has very low thermal expansion and is far lighter than refractory metals or graphite of equivalent strength. These properties make C/C the material of choice where components must survive extreme heat cycles, abrasion or thermal shock, from crystal-growing furnaces and glass-forming lines to aircraft brakes and rocket nozzles.
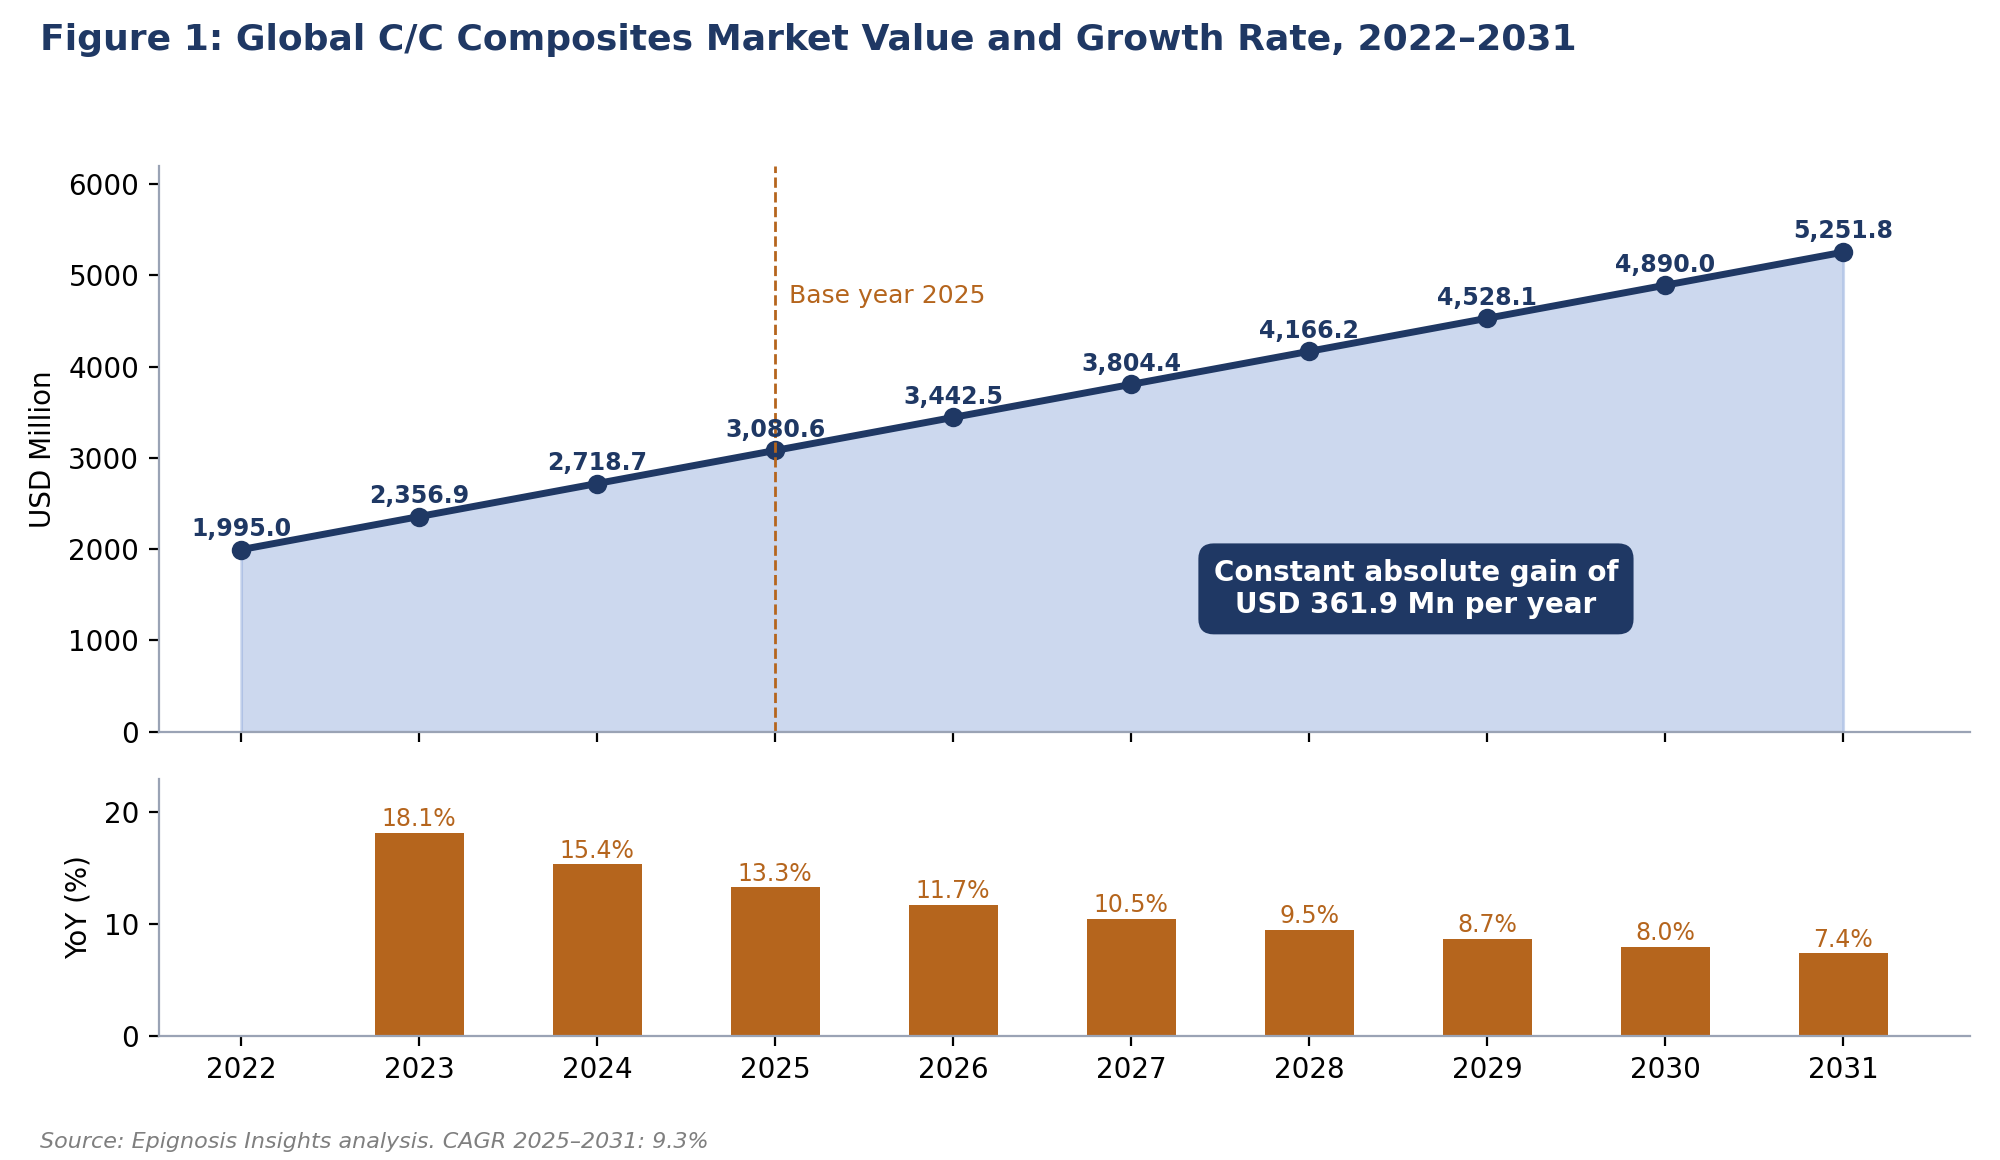
Figure 1: Global C/C Composites Market Value and Growth Rate, 2022–2031
The shape of the forecast is unusual and commercially important. Rather than compounding at a fixed rate, the market grows by a near-constant USD 361.9 million every year from 2023 through 2031. As the revenue base enlarges, the same absolute increment represents a smaller percentage: annual growth slows from 18.1% in 2023 to 13.3% in 2025, 11.7% in 2026, 9.5% in 2028 and 7.4% in 2031. The historical period from 2022 to 2025 therefore shows a 15.58% CAGR, while the forecast period settles at 9.3%.
This linear trajectory reflects how C/C capacity is added. New densification furnaces, graphitisation lines and machining cells are lumpy, capital-intensive investments that add a fixed quantum of output when commissioned. Industry capacity tends to expand in steps of similar size rather than as a percentage of the installed base, which caps the absolute annual increment in shipments. For investors, the implication is that the market's growth rate will look slower over time even though the dollar opportunity each year remains stable; valuation and capacity planning should be anchored to the absolute increment rather than to headline percentage growth.
Global C/C Composites Market: Volume and Pricing Analysis
Epignosis Insights estimates global C/C composites consumption at 11,556 tons in 2022, 16,179 tons in 2024 and 18,585 tons in 2025. Volume is projected to reach 23,596 tons in 2027, 28,888 tons in 2029 and 34,479 tons by 2031, a volume CAGR of 10.85% between 2025 and 2031. Volume therefore grows roughly 1.5 percentage points faster than value each year, which means the average revenue per kilogram is declining.
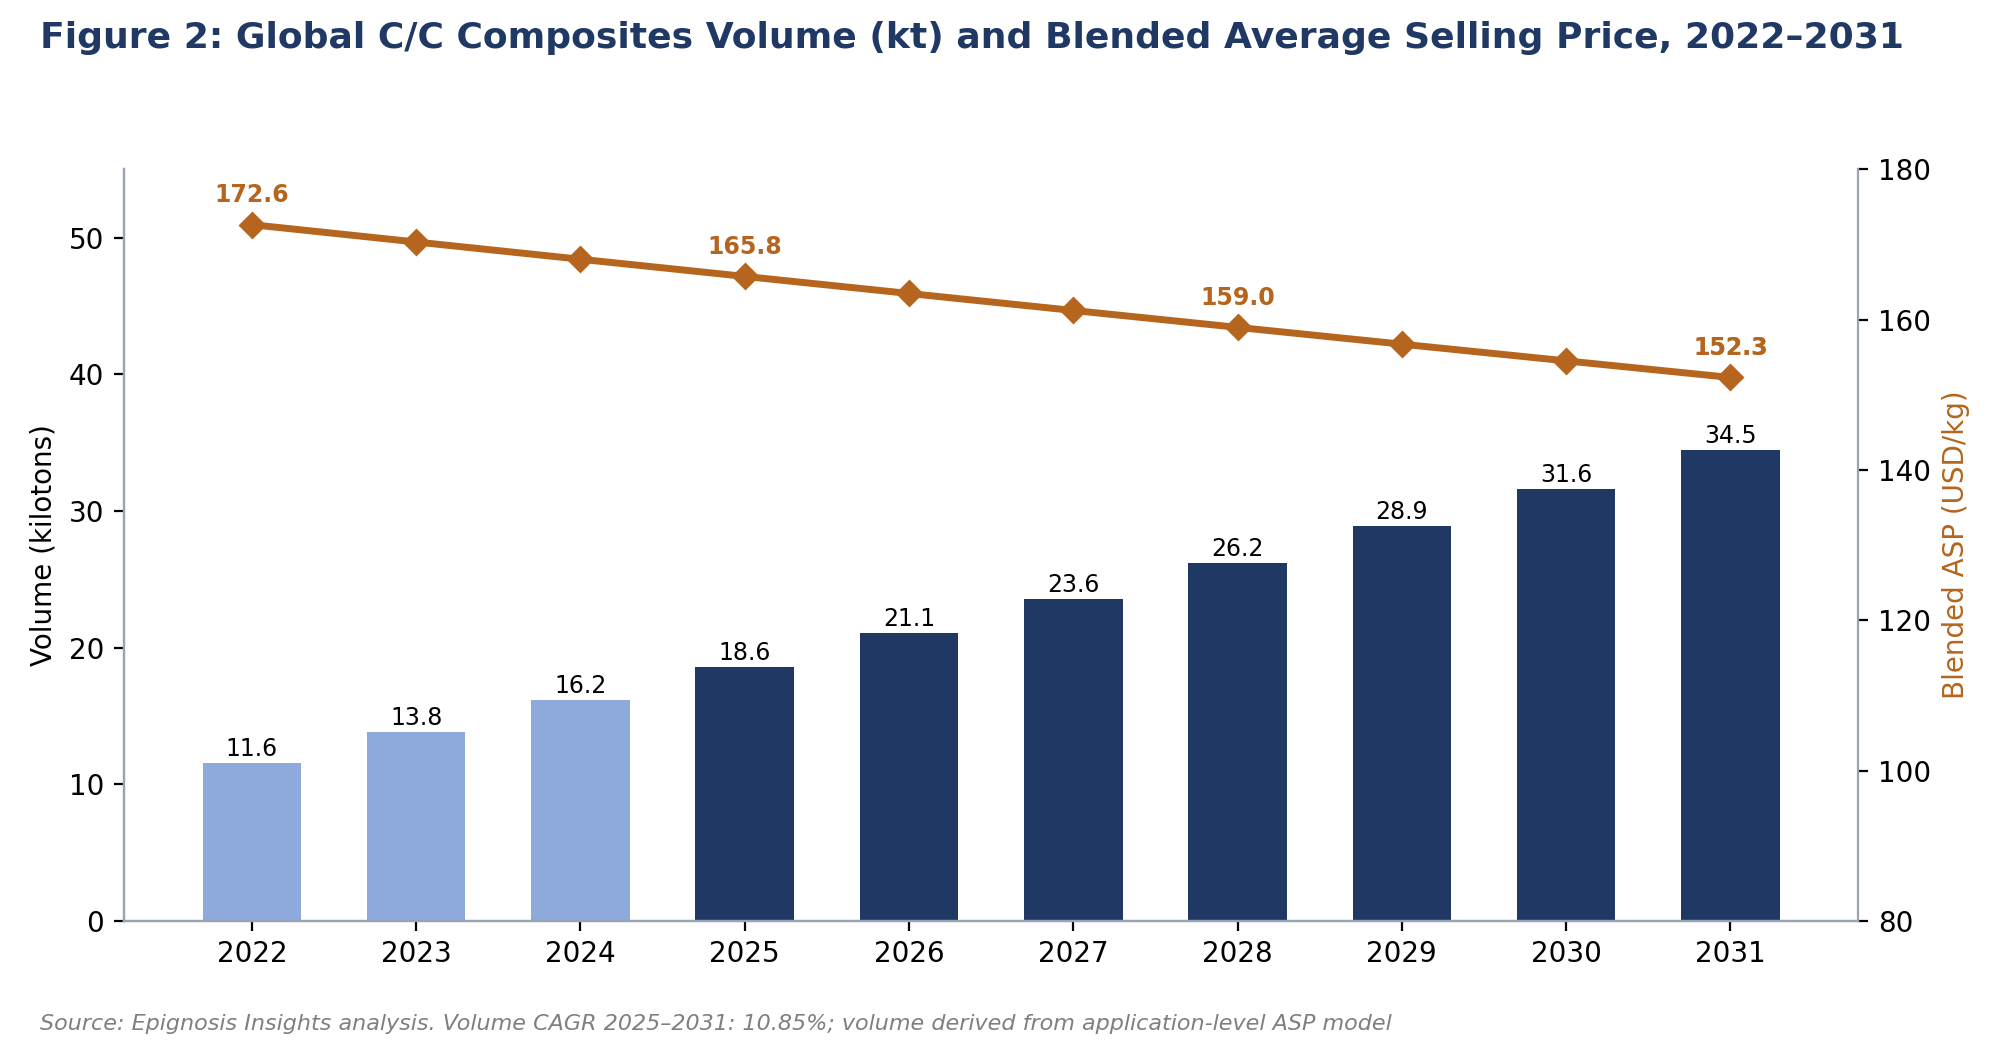
Figure 2: Global C/C Composites Volume (kt) and Blended Average Selling Price, 2022–2031
The blended average selling price falls from USD 172.6 per kg in 2022 to USD 165.8 per kg in 2025 and USD 152.3 per kg in 2031. Two forces explain this. First, mix: industrial applications such as furnace components, grid shelving and plate stock are priced at a fraction of aerospace grades, and they grow faster in tonnage terms. Second, price deflation in thermal-field products, where large-scale producers in China have driven down the cost of crucible supports, heat shields and guide tubes through bigger furnaces and shorter process cycles.
Volume was derived by applying application-specific average selling prices to each region's application revenue, adjusted by a regional price index. Aerospace items carry the highest assumed price at USD 620 per kg in 2025, reflecting qualification costs, multiple densification cycles and tight traceability requirements. Glass handling products are assumed at USD 155 per kg, grid shelving at USD 118 per kg, CZ and DSS furnace components at USD 92 per kg and basic plate stock at USD 80 per kg. Regional indices place North America at 1.12 times the global base, Europe at 1.08, MEA at 1.10, LATAM at 1.05 and APAC at 0.86, reflecting the lower cost structure of Chinese and other Asian producers.
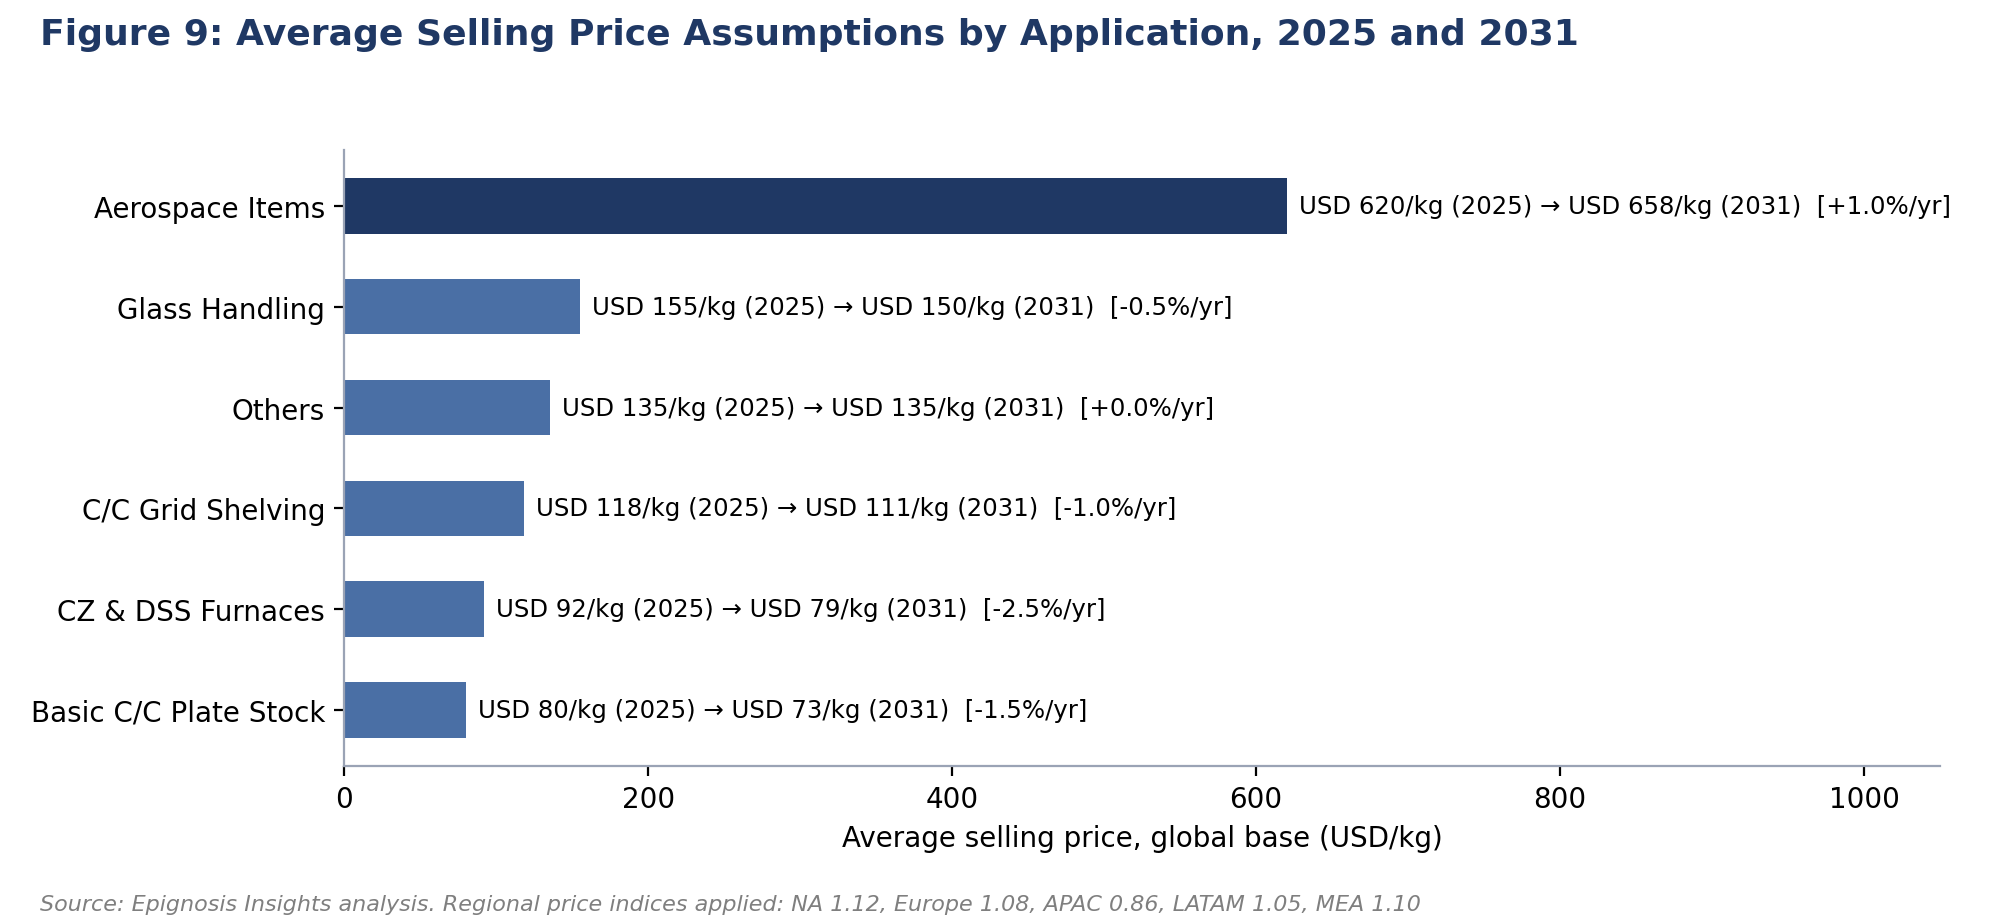
Figure 9: Average Selling Price Assumptions by Application, 2025 and 2031
The volume view reverses the ranking that value suggests. Aerospace items generate 41.2% of 2025 revenue but only 10.7% of tonnage, at 1,995 tons. CZ and DSS furnace components generate 20.5% of revenue but 36.3% of tonnage, at 6,738 tons, rising to 13,429 tons by 2031 at a 12.18% volume CAGR, the fastest of any application. Plate stock accounts for 15.3% of tonnage despite only 7.6% of value. For producers, this means capacity utilisation is driven mainly by industrial furnace demand, while profitability is driven by aerospace qualification.
| Application |
Volume 2025 (Tons) |
Volume 2031 (Tons) |
Volume CAGR |
Share of 2025 Volume |
| CZ and DSS Furnaces |
6,738 |
13,429 |
12.18% |
36.3% |
| C/C Grid Shelving Systems |
3,802
|
7,051 |
10.84% |
20.5% |
| Basic C/C Plate Stock Producing |
2,843 |
5,077 |
10.14% |
15.3% |
| Glass Handling Industry |
2,541 |
4,856 |
11.40% |
13.7% |
| Aerospace Items |
1,995 |
3,192 |
8.15% |
10.7% |
| Others |
665 |
874 |
4.65% |
3.6% |
Source: Epignosis Insights analysis
Global C/C Composites Market Dynamics
Solar Ingot Production Driving Thermal-Field Consumption Under Overcapacity Pressure
Monocrystalline silicon ingots for solar wafers are grown in Czochralski (CZ) pullers, while multicrystalline and some advanced cast-mono ingots use directional solidification (DSS) furnaces. Both furnace types rely on C/C crucible supports, heat shields, guide cylinders, insulation retainers and fasteners, which are consumed and replaced as they degrade under silicon vapour attack and repeated thermal cycling. Ingot output, therefore, translates directly into C/C replacement demand.
The International Energy Agency's Photovoltaic Power Systems Programme (IEA PVPS) reported that global solar additions reached about 690 GW in 2025, with China installing 415 GW. Upstream, however, the supply chain is heavily oversized. Global module production was 722 GW in 2025, slightly below the prior year, against manufacturing capacity of about 1,531 GW per year, while solar cell production reached 779 GW against capacity of 1,405 GW. Effective utilisation of roughly 47% for modules and 55% for cells indicates that ingot and wafer producers are operating well below nameplate capacity.
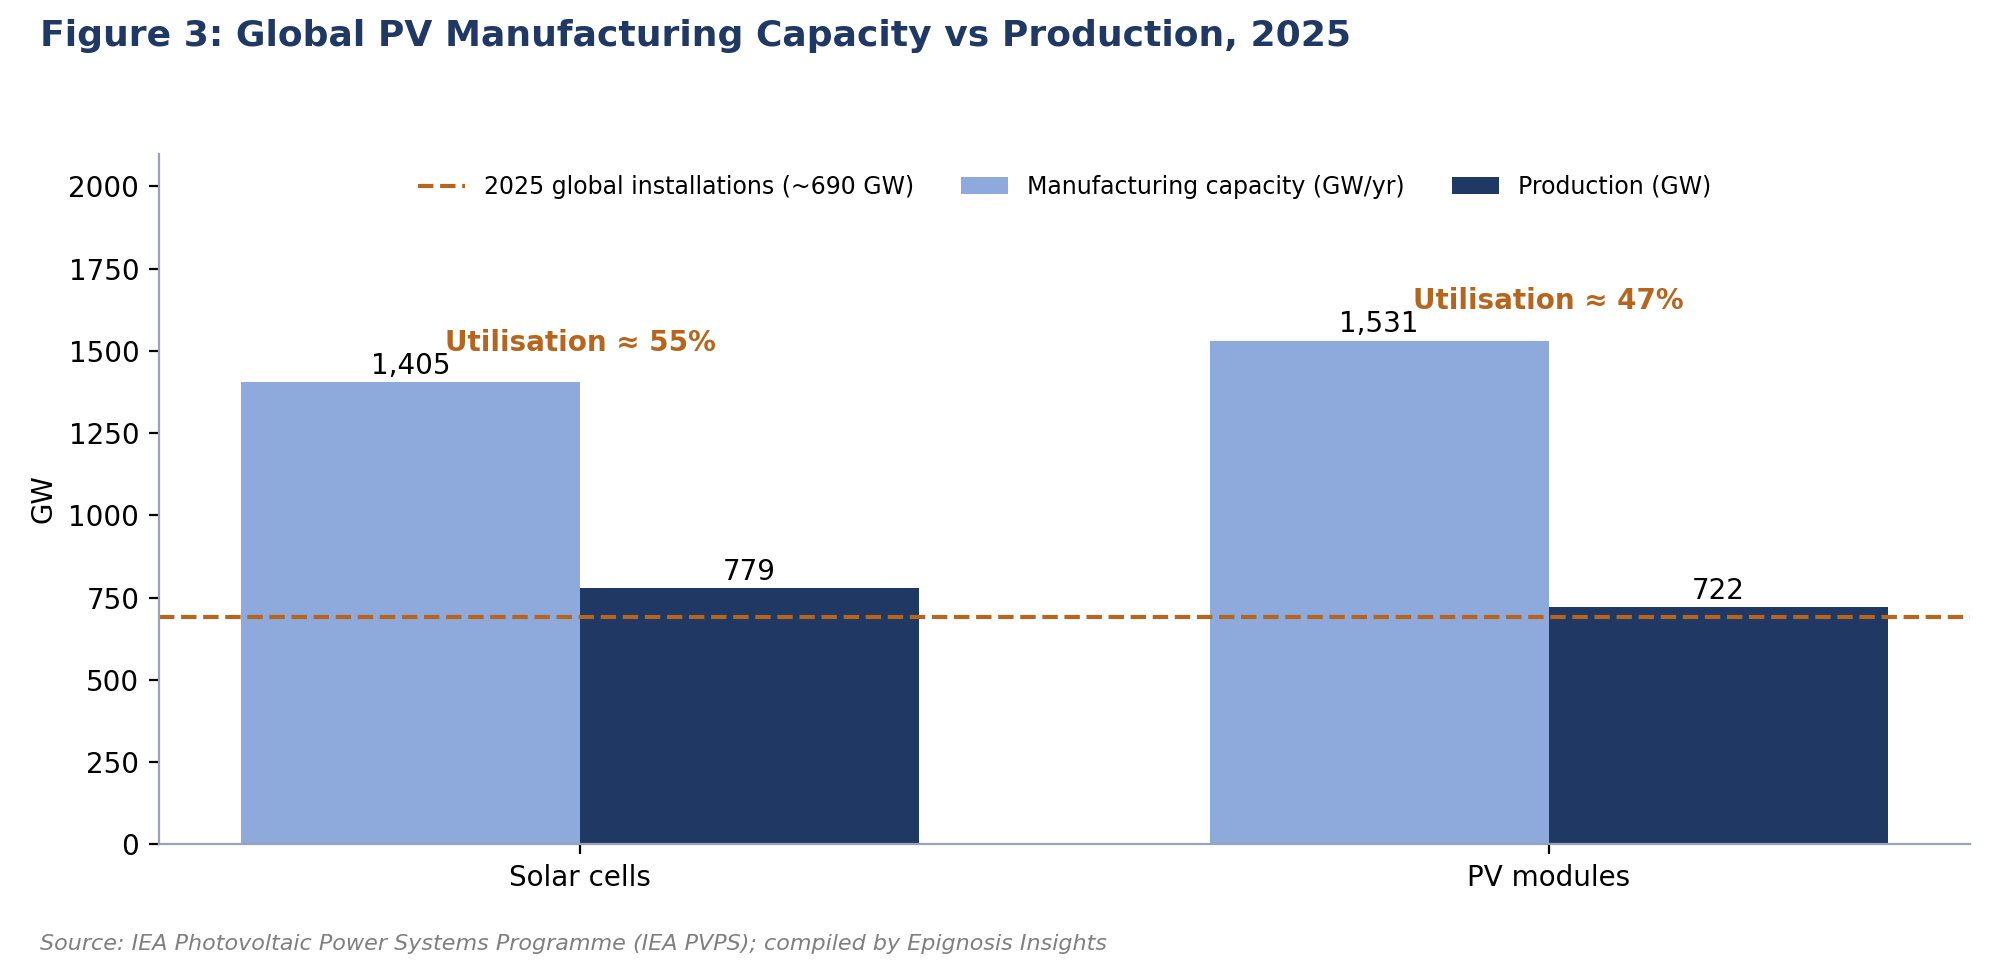
Figure 3: Global PV Manufacturing Capacity vs Production, 2025
For the C/C composites market, this produces a dual effect. Volume demand remains strong because ingot pullers still run at high absolute output to serve nearly 700 GW of annual installations, and because larger ingot diameters and longer pulls require larger thermal-field parts. At the same time, ingot makers facing compressed margins are pushing thermal-field suppliers hard on price and service life. This is the main reason the CZ and DSS furnace application shows the steepest assumed price decline at 2.5% per year, and why its value CAGR of 9.25% trails its volume CAGR of 12.18%. Suppliers able to extend part life through better coatings or higher-density preforms can defend price; commodity suppliers face continued pressure until PV capacity rationalises.
Commercial Fleet Expansion Underpinning Carbon Brake Demand
Aircraft carbon brakes are the largest single use of C/C composites in aerospace, and their demand is tied to the number of aircraft in service and the number of landings flown. Brake heat-sink discs wear with each landing and are replaced on a cycle-based schedule, which creates a large and predictable aftermarket in addition to original fitment on new aircraft.
Boeing's 2025 Commercial Market Outlook forecasts demand for 43,600 new commercial aircraft between 2025 and 2044, including 33,285 single-aisle jets, 7,815 widebodies, 1,545 regional jets and 955 freighters. The global commercial fleet is expected to grow from about 27,150 aircraft in 2024 to 49,640 by 2044, while the widebody passenger fleet increases from roughly 4,400 to 8,320 aircraft. Because widebody aircraft carry many more and larger brake discs per aircraft than single-aisle jets, the near-doubling of the widebody fleet has a disproportionate impact on carbon brake tonnage.
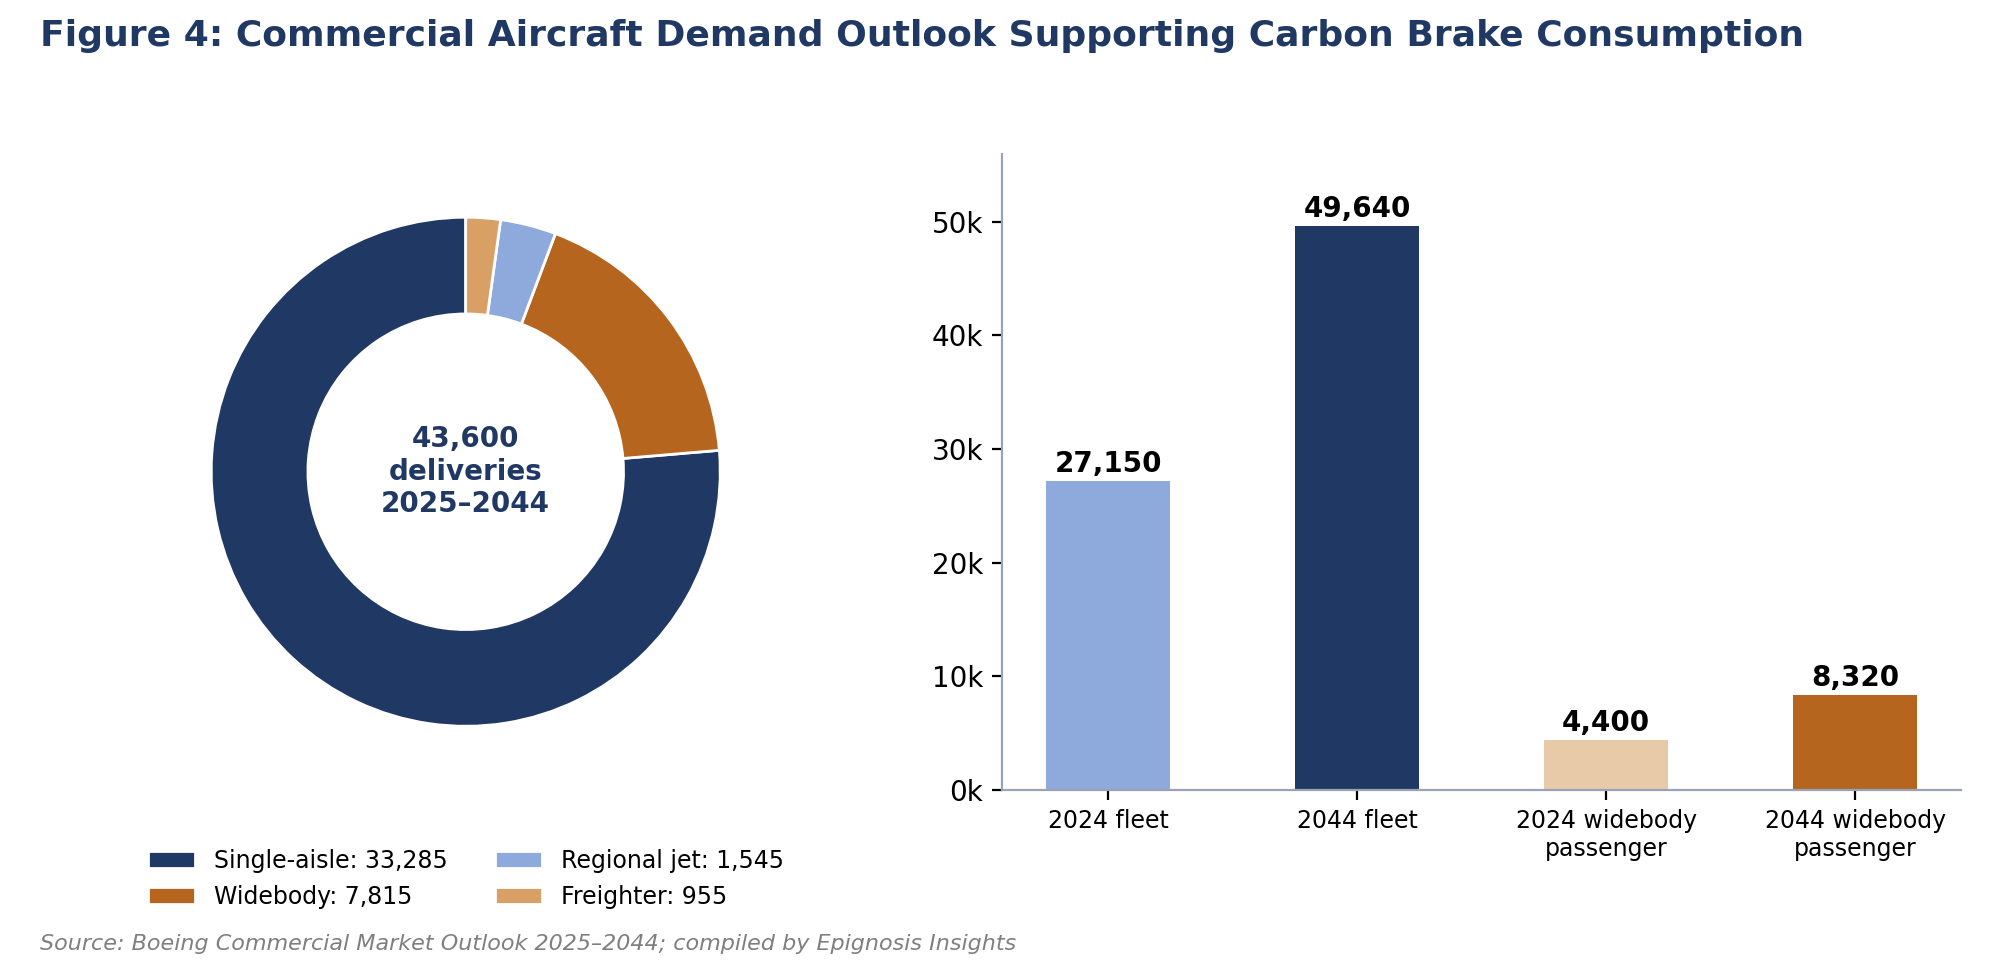
Figure 4: Commercial Aircraft Demand Outlook Supporting Carbon Brake Consumption
Within the C/C composites market, aerospace items grow from USD 1,269.4 million in 2025 to USD 2,146.3 million by 2031 at a 9.15% CAGR, adding USD 876.9 million, the largest absolute increment of any application. Fleet expansion also explains why aerospace growth is highest in emerging-market regions: aerospace items grow at 12.39% in India and 10.27% across APAC, compared with 8.43% in North America, where the installed fleet is larger and more mature.
Energy-Intensive Densification and Long Lead Times Constraining Supply
The most important supply-side restraint on the C/C composites market is the manufacturing process itself. Chemical vapour infiltration requires carbon preforms to be held at high temperature in a hydrocarbon gas atmosphere for hundreds of hours, often across several cycles with intermediate machining, before reaching target density. Graphitisation and oxidation-protection coating add further high-temperature steps. Production lead times for thick, high-density aerospace parts can therefore extend to several months, and capacity cannot be added quickly when demand rises.
Safran's investment decision illustrates the economics. In July 2025 the company announced a carbon brake plant of more than EUR 450 million at the Plaine de l'Ain industrial park near Lyon, complementing its existing sites in Villeurbanne, Walton in the United States and Sendayan in Malaysia. The facility is scheduled to start operations in 2030 and is expected to raise Safran's carbon brake capacity by about 25% by 2037. The site was selected partly for access to competitively priced low-carbon electricity, because energy can account for up to 30% of carbon brake production cost.
Two implications follow for the wider market. First, energy prices are a structural cost driver, which favours producers in regions with low-cost or low-carbon power and penalises those exposed to volatile gas and electricity tariffs. Second, the multi-year gap between investment decision and output means that supply responds slowly to demand, supporting pricing in qualified aerospace grades even as industrial grades face deflation. Process innovations that shorten densification, such as rapid or film-boiling infiltration and hybrid liquid-gas routes, are therefore among the most valuable competitive levers in the industry.
Global C/C Composites Market: Space Launch and Hypersonic Opportunity Analysis
Space launch is a smaller but strategically significant demand pool for C/C composites, particularly for multi-directional (3D and 4D) structures used in solid rocket motor nozzle throats, exit cones, nose tips and leading edges. These components must withstand ablation, extreme heat flux and severe thermal shock for short durations, a profile in which C/C and C/C-SiC materials have few substitutes.
Data compiled by astronomer Jonathan McDowell show 329 orbital launch attempts worldwide in 2025, of which 321 reached orbit or near-orbit. The United States accounted for 181 attempts, up from 145 in 2024 and 78 in 2022, while China recorded 92 attempts, 35% more than in 2024. Europe's attempts rose from three in 2024 to eight in 2025 as new launch vehicles entered service. The combined count for the five leading launch nations rose from 174 in 2022 to 303 in 2025.
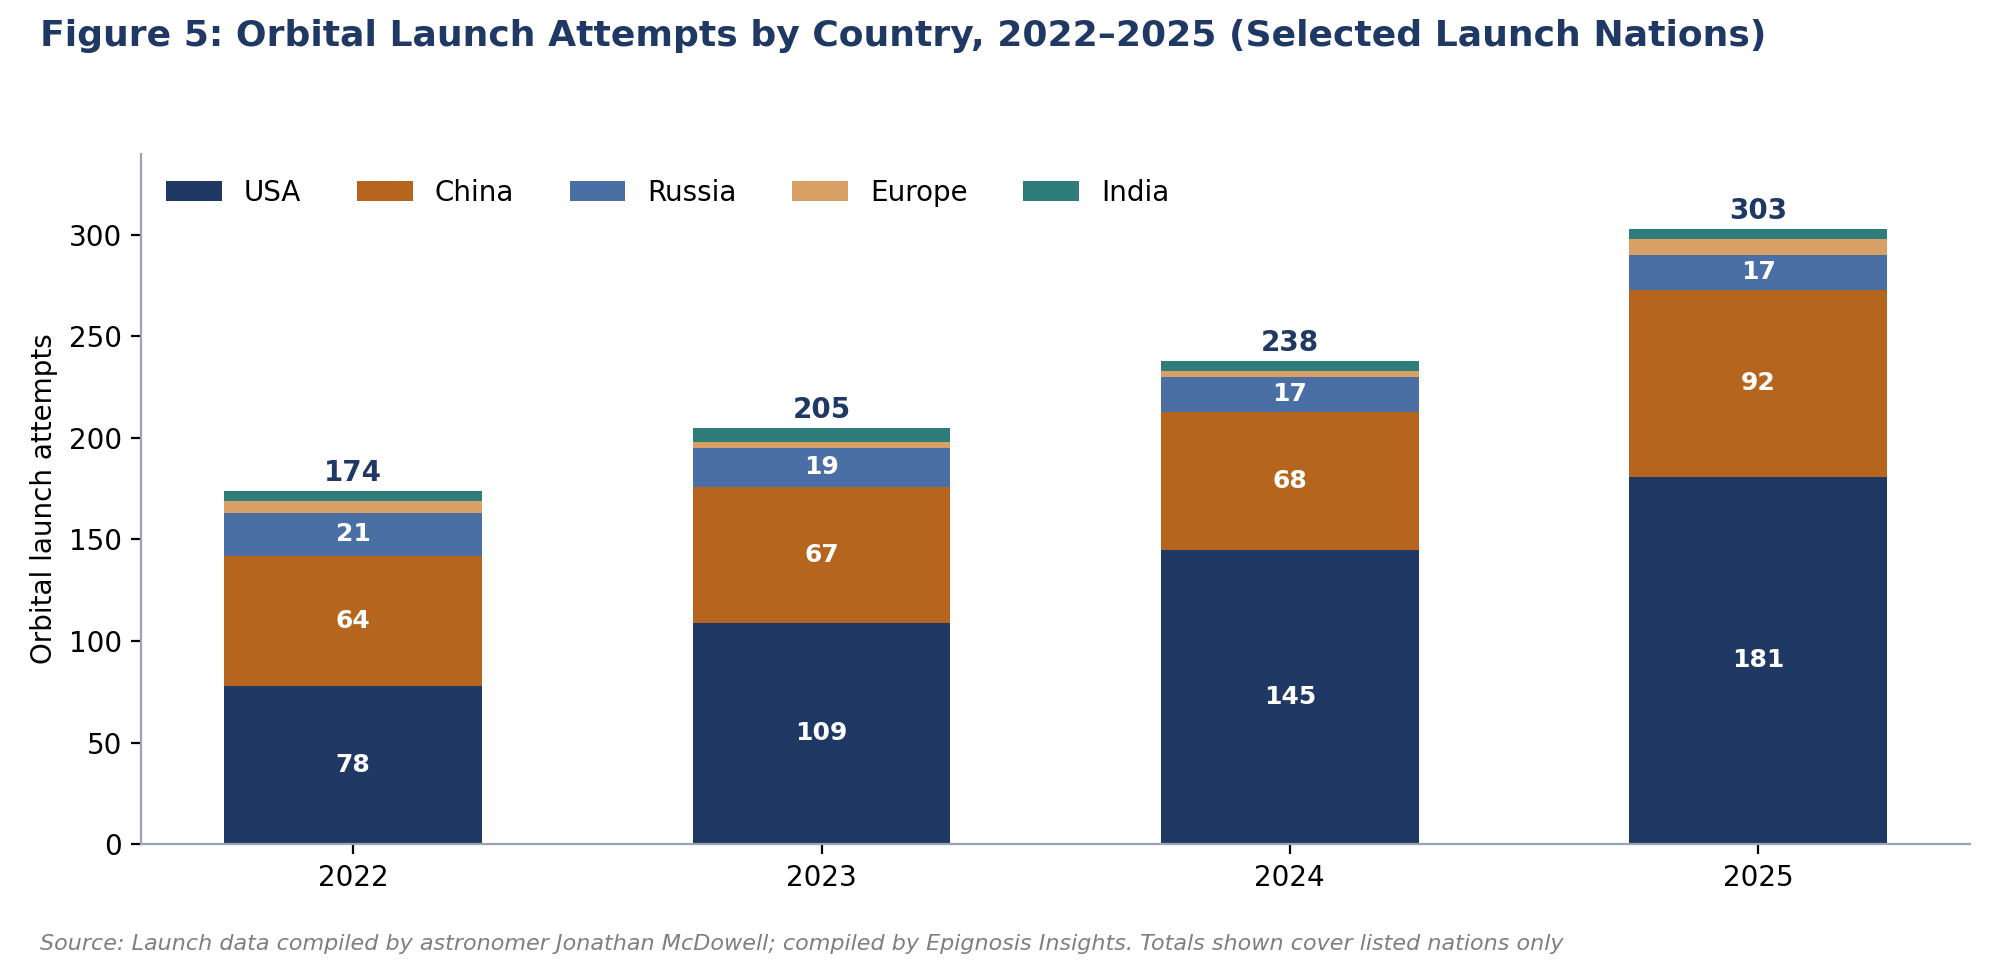
Figure 5: Orbital Launch Attempts by Country, 2022–2025 (Selected Launch Nations)
The commercial effect on the C/C composites market is nuanced. Reusable liquid-fuelled boosters, which dominate launch counts, use far less C/C per flight than expendable solid motors. The more material demand comes from solid rocket boosters, upper-stage nozzle extensions, defence missile programmes and hypersonic vehicle development, all of which are expanding alongside the general rise in launch cadence and defence spending. This is reflected in multi-directional structure materials, which grow at 10.03% in Europe and 10.33% in APAC, faster than their 8.72% global average. Producers with qualified 3D preform weaving and high-pressure densification capability are best placed to capture this premium niche.
Global C/C Composites Market Analysis by Type
Unidirectional structure materials dominate the market, with revenue of USD 1,774.6 million in 2025 rising to USD 2,981.2 million in 2031 at a 9.03% CAGR. Their share of value eases slightly from 57.6% to 56.8%. In volume terms, unidirectional materials represent about 61.8% of 2025 tonnage, at roughly 11,481 tons, rising to about 20,986 tons by 2031. Their high volume share reflects broad use in structural load-bearing components, high-stress parts, turbine-related hardware and the plate and profile stock that is machined into furnace parts.
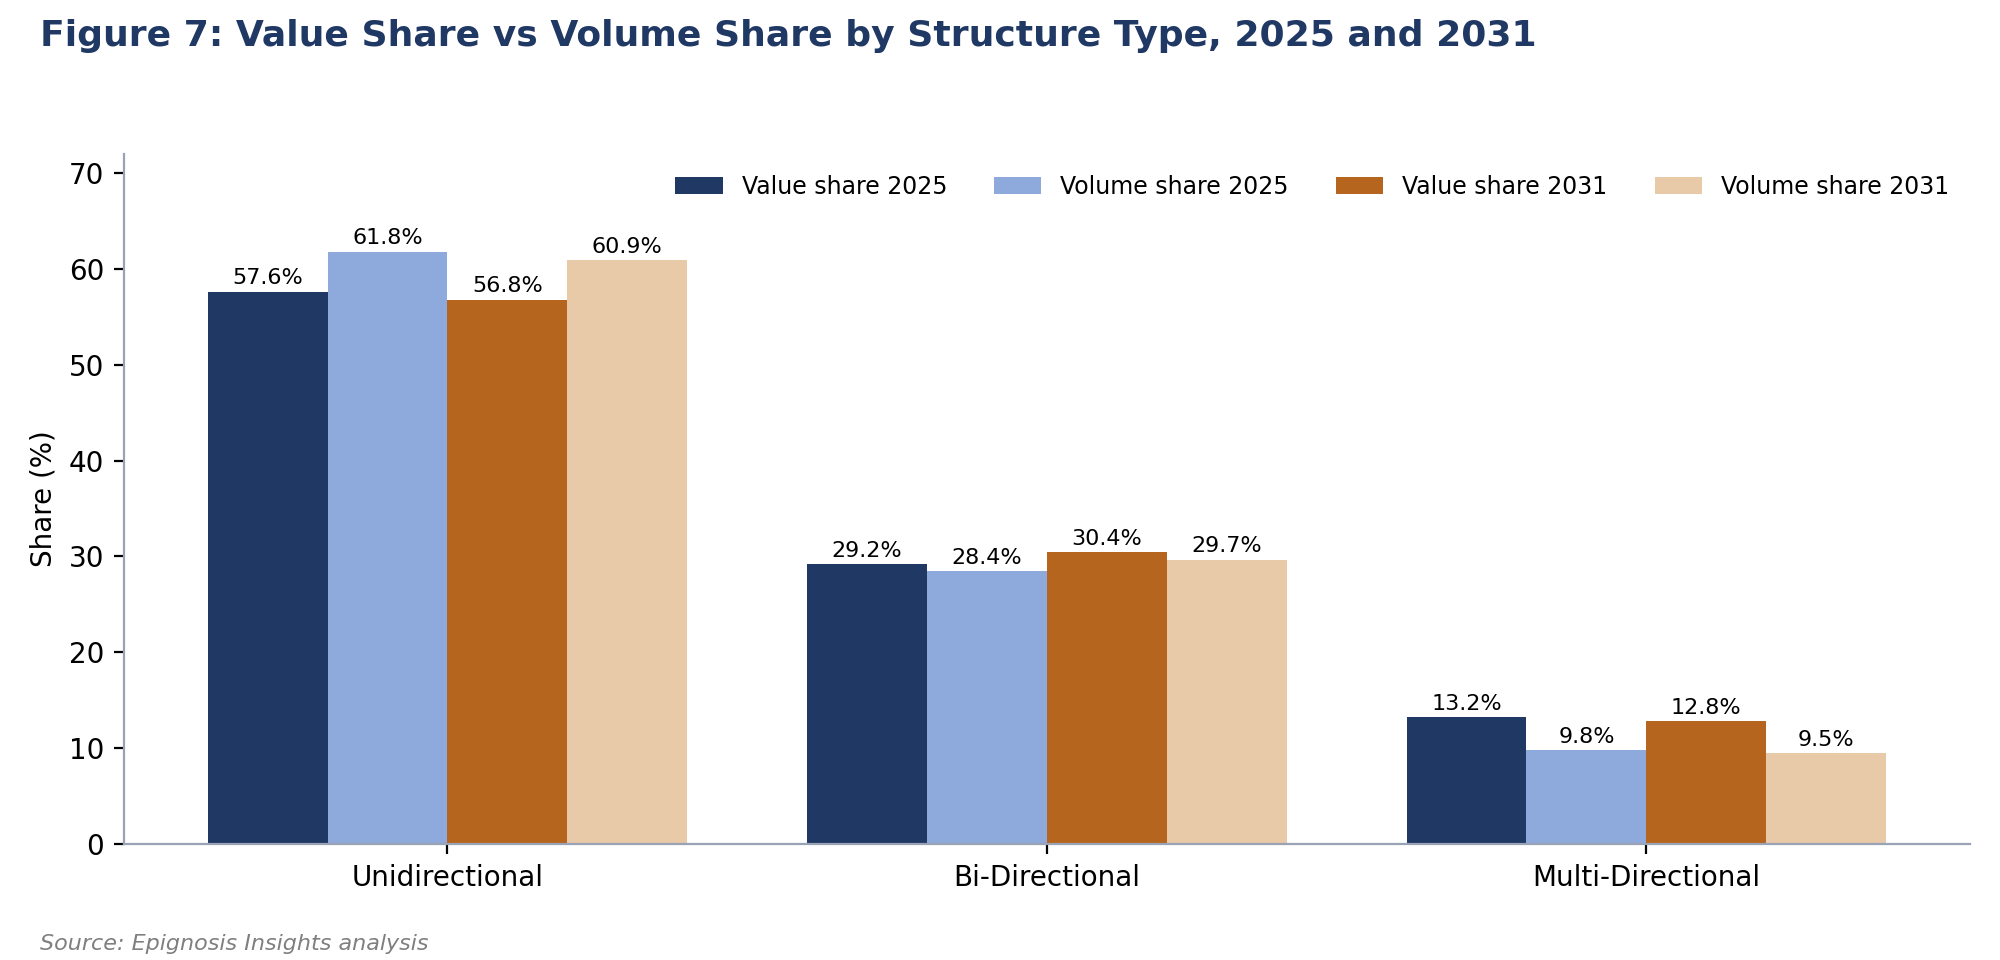
Figure 7: Value Share vs Volume Share by Structure Type, 2025 and 2031
Bi-directional structure materials, based on woven or laminated two-dimensional fabrics, are the fastest-growing type at a 10.07% value CAGR, rising from USD 898.9 million to USD 1,598.4 million and lifting their share from 29.2% to 30.4%. Volume grows at 11.63%, from about 5,287 tons to 10,229 tons. Bi-directional laminates are the workhorse format for brake discs, heat shields, grid shelving and furnace panels because they offer balanced in-plane strength and can be produced in large flat formats efficiently.
Multi-directional structure materials are the most technically demanding and highest-priced type. Revenue grows from USD 407.1 million in 2025 to USD 672.3 million in 2031 at an 8.72% CAGR, and the type holds 13.2% of value but only about 9.8% of volume, indicating a price premium of roughly 35% over the market average. Growth is concentrated in Europe and APAC, where defence and space programmes are expanding, while North America's multi-directional segment grows more slowly at 7.11%.
| Type |
2025 (USD Mn) |
2031 (USD Mn) |
Value CAGR |
Volume 2025 (Tons) |
Volume 2031 (Tons) |
| Unidirectional Structure Materials |
1,774.6 |
2,981.2 |
9.03% |
11,481 |
20,986 |
| Bi-Directional Structure Materials |
898.9 |
1,598.4 |
10.07% |
5,287 |
10,229 |
| Multi-Directional Structure Materials |
407.1 |
672.3 |
8.72% |
1,816 |
3,264 |
Source: Epignosis Insights analysis
Global C/C Composites Market Analysis by Application
Beyond aerospace and crystal-growth furnaces, four further application groups shape the market, each with a distinct growth logic. C/C grid shelving systems, used as lightweight load-carrying fixtures in vacuum heat-treatment, brazing and sintering furnaces, are valued at USD 460.3 million in 2025 and reach USD 803.3 million by 2031 at a 9.72% CAGR. Replacement of metal fixtures with C/C is driven by lower thermal mass, which shortens furnace cycles and cuts energy use per load, and by the absence of creep and distortion at temperature. Growth is strongest in North America at 10.09%, where heat-treatment of aerospace and additive-manufactured metal parts is expanding.
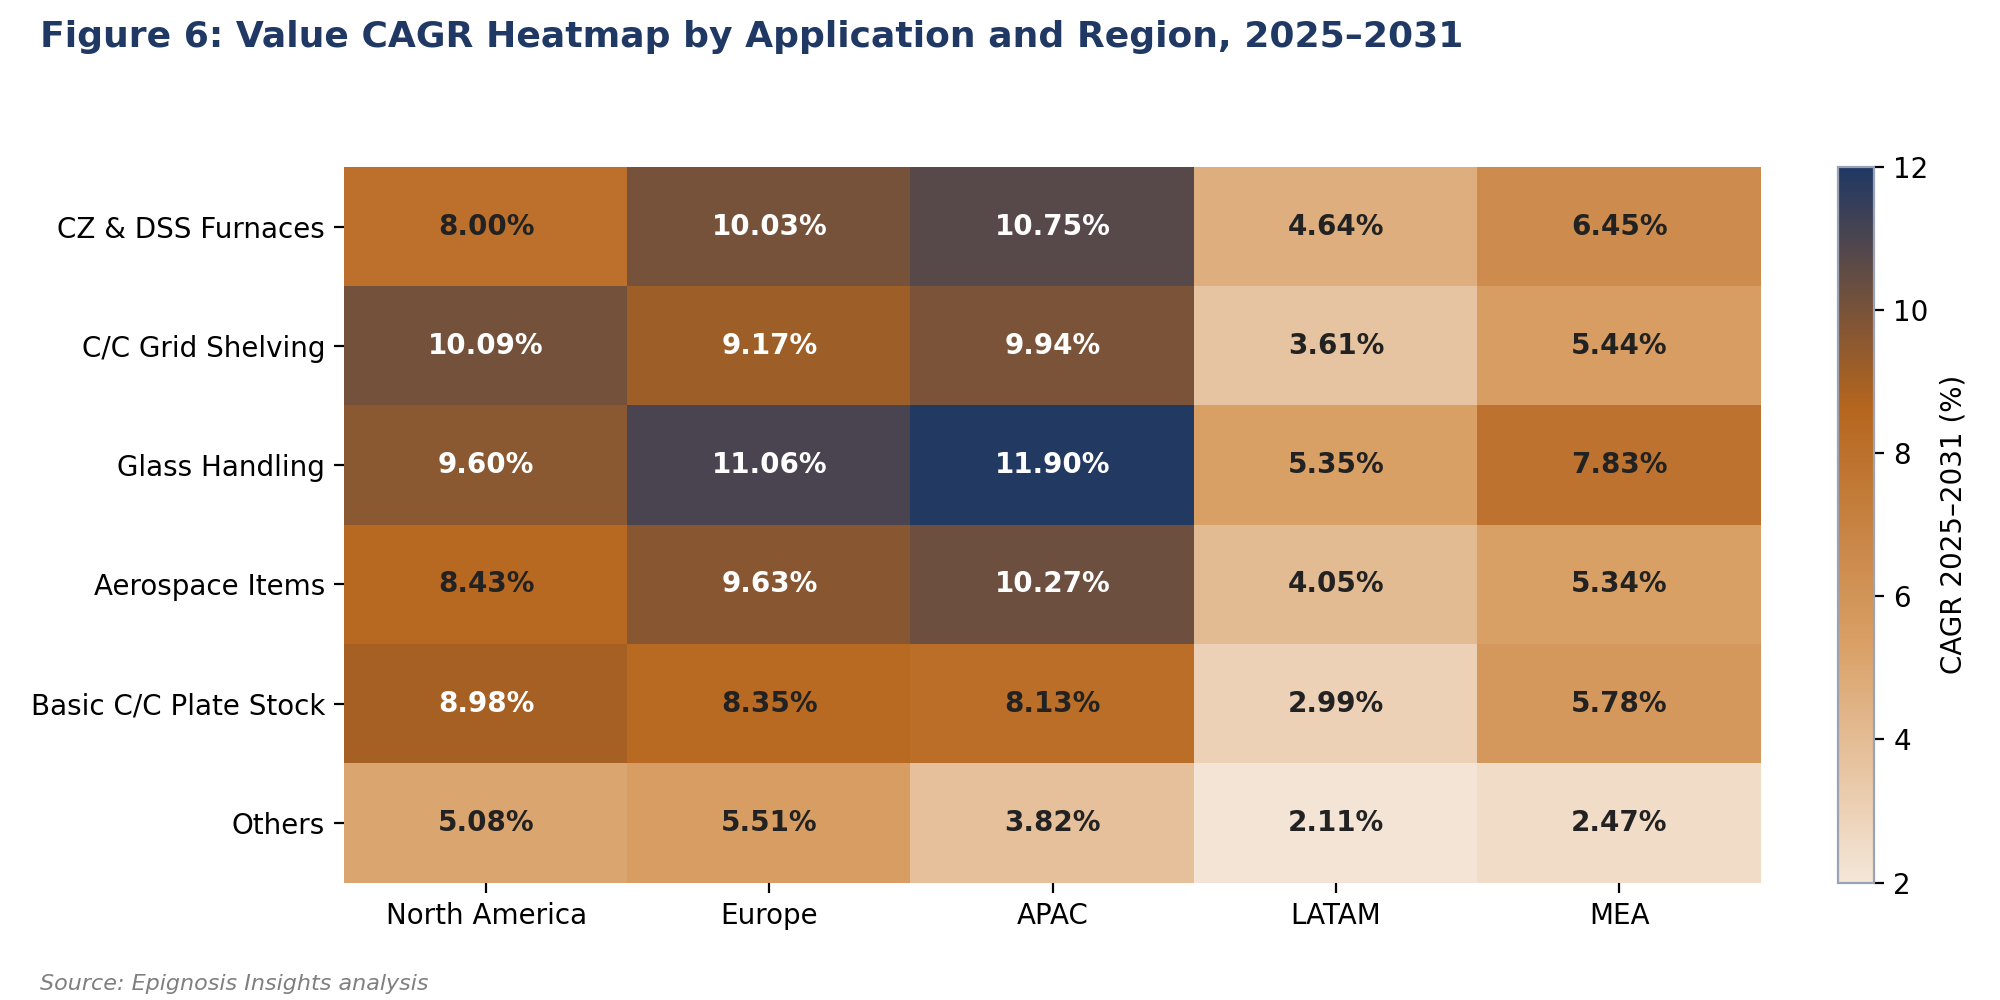
Figure 6: Value CAGR Heatmap by Application and Region, 2025–2031
The glass handling industry is the fastest-growing application by value at a 10.72% CAGR, rising from USD 393.5 million in 2025 to USD 725.1 million by 2031 and increasing its share from 12.8% to 13.8%. C/C components are used as take-out pads, pushers, stacker fingers and transfer surfaces in container and flat-glass production because they do not stick to or mark hot glass and tolerate rapid thermal cycling. Demand growth is highest in APAC at 11.90% and Europe at 11.06%, reflecting new float-glass and specialty-glass lines, including glass for solar modules.
Basic C/C plate stock producing, which covers semi-finished plates, blocks and profiles supplied to machining shops and fabricators, grows from USD 234.9 million to USD 383.7 million at an 8.52% CAGR. The segment acts as a feedstock market for smaller converters that lack their own densification capacity. Other applications, including semiconductor process parts, hot-pressing dies, medical and industrial uses, grow more slowly at 4.72%, from USD 91.5 million to USD 120.7 million, and their share declines as investment concentrates on the larger furnace, glass and aerospace applications.
Global C/C Composites Market: Regional and Country Analysis
North America is the largest regional market, valued at USD 1,418.9 million in 2025 and projected to reach USD 2,339.8 million by 2031 at an 8.69% CAGR. The United States accounts for 93.9% of regional revenue, at USD 1,332.0 million in 2025, supported by the world's largest aerospace and defence industrial base. Canada grows faster at 9.51%, and Mexico at 9.87% from a small base, linked to aerospace component manufacturing clusters. North America's share of global value eases from 46.1% to 44.6% over the forecast as Asia expands more quickly. In volume terms the region holds a lower 41.6% share because of its higher average prices.
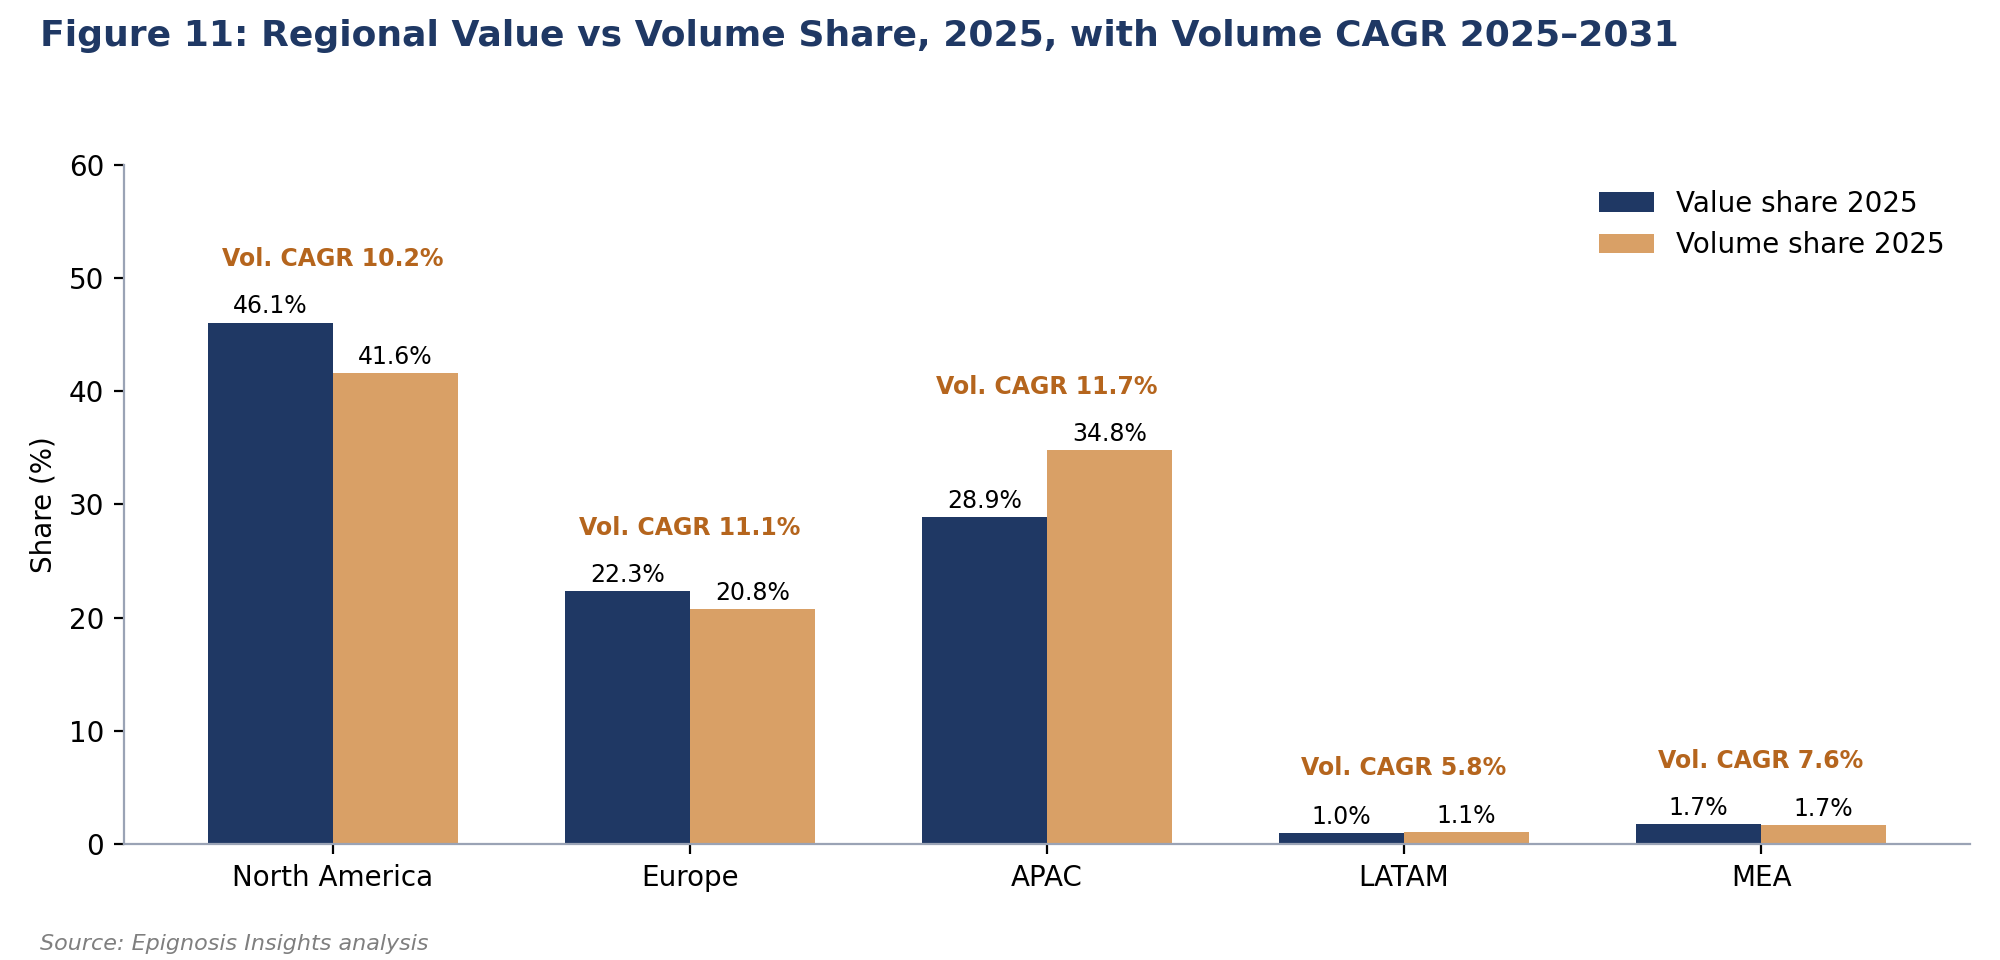
Figure 11: Regional Value vs Volume Share, 2025, with Volume CAGR 2025–2031
APAC is the second-largest region at USD 890.6 million in 2025 and the fastest-growing at a 10.30% CAGR, reaching USD 1,603.4 million by 2031. China accounts for 59.3% of APAC revenue at USD 528.4 million, driven by the world's largest PV ingot base and a fast-growing aerospace and space sector. Japan, at USD 176.9 million, combines a strong carbon materials industry with semiconductor and aerospace demand. India is the fastest-growing country market globally at a 12.04% CAGR, nearly doubling from USD 48.7 million to USD 96.4 million. Because Asian prices are lower, APAC's volume share of 34.8% exceeds its value share of 28.9%, and its volume grows at 11.7% per year.
Europe is valued at USD 687.7 million in 2025 and reaches USD 1,194.7 million by 2031 at a 9.64% CAGR. Germany is the largest European market at USD 201.8 million and the fastest-growing at 11.04%, followed by the United Kingdom at USD 147.9 million and France at USD 141.6 million, which grows at 10.33% on the strength of aircraft brake and space propulsion activity. Italy and Spain are smaller markets growing at 8.24% and 7.02% respectively. LATAM, at USD 29.9 million, and MEA, at USD 53.6 million, together represent less than 3% of global value. Brazil accounts for 82.2% of LATAM revenue, while Saudi Arabia and the UAE together hold 81.9% of MEA revenue, linked to aviation maintenance hubs and early-stage industrial diversification.
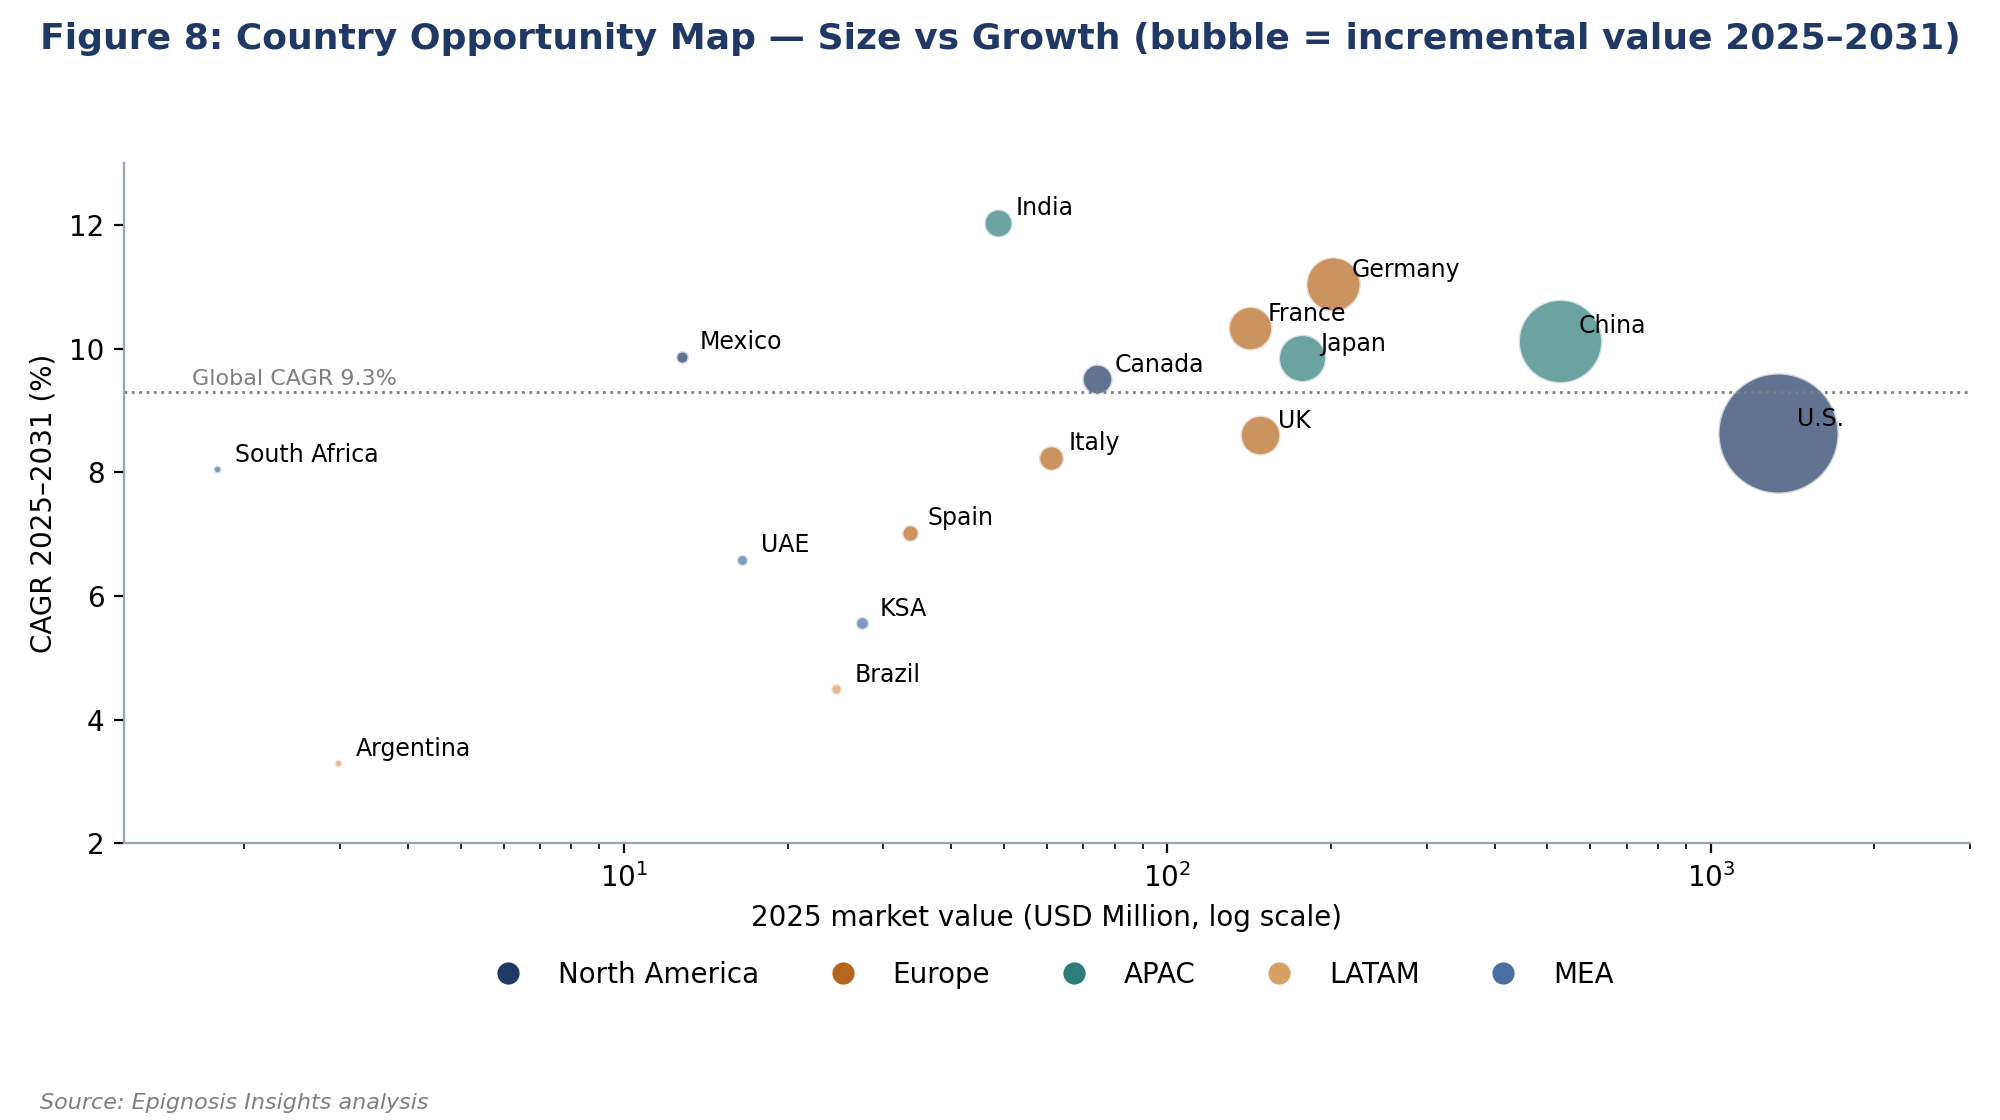
Figure 8: Country Opportunity Map — Size vs Growth (bubble = incremental value 2025–2031)
| Region |
2025 (USD Mn) |
2031 (USD Mn) |
Value CAGR |
Volume 2025 (Tons) |
Volume 2031 (Tons) |
| North America |
1,418.9 |
2,339.8 |
8.69% |
7,737 |
13,883 |
| Europe |
687.7 |
1,194.7 |
9.64% |
3,863 |
7,257 |
| APAC |
890.6 |
1,603.4 |
10.30% |
6,460 |
12,556 |
| LATAM |
29.9 |
38.3 |
4.24% |
202 |
284 |
| MEA |
53.6 |
75.6 |
5.90% |
322 |
500 |
Source: Epignosis Insights analysis
Global C/C Composites Market: Competitive Landscape
Key companies analysed within the global C/C composites market are: SGL Carbon, Toray Industries, Hexcel Corporation, Schunk Group, Mersen, Tokai Carbon, Toyo Tanso, Nippon Carbon, Safran Landing Systems, Collins Aerospace, Honeywell Aerospace, CFC Carbon Co., Hunan KBC Advanced Materials, Carbon-Carbon Advanced Technologies (C-CAT), CGT Carbon and others. The competitive structure is split between three groups. Vertically integrated aerospace brake manufacturers produce C/C mainly for captive use in wheels and brakes and compete on qualification, fleet installed base and aftermarket service contracts. Diversified carbon and graphite groups supply furnace components, plates, fixtures and specialty parts across the PV, semiconductor, glass and industrial heat-treatment industries, competing on product breadth, purity and global service. Chinese thermal-field specialists have built large densification capacity dedicated to the PV ingot industry and compete primarily on cost and lead time. Carbon fibre producers participate upstream by supplying reinforcement fibres and, in some cases, preforms.
Epignosis Insights Competitive Assessment Framework (EICAF)
The Epignosis Insights Competitive Assessment Framework (EICAF) for the global C/C composites market evaluates companies across 10 weighted parameters reflecting the technical and commercial realities of the industry. Densification technology and cycle time receives the highest weight at 14% because process speed determines capacity, cost and responsiveness. Production capacity and scalability, purity together with thermal and oxidation performance, and preform architecture portfolio covering unidirectional, two-dimensional and three-dimensional structures each receive 12%. Cost competitiveness and energy efficiency, and aerospace and defence qualifications each receive 10%. Customer reach in PV and semiconductor markets receives 9%, R&D intensity and intellectual property 8%, carbon fibre and precursor integration 8%, and sustainability and low-carbon energy use 5%. The total weighting equals 100%.
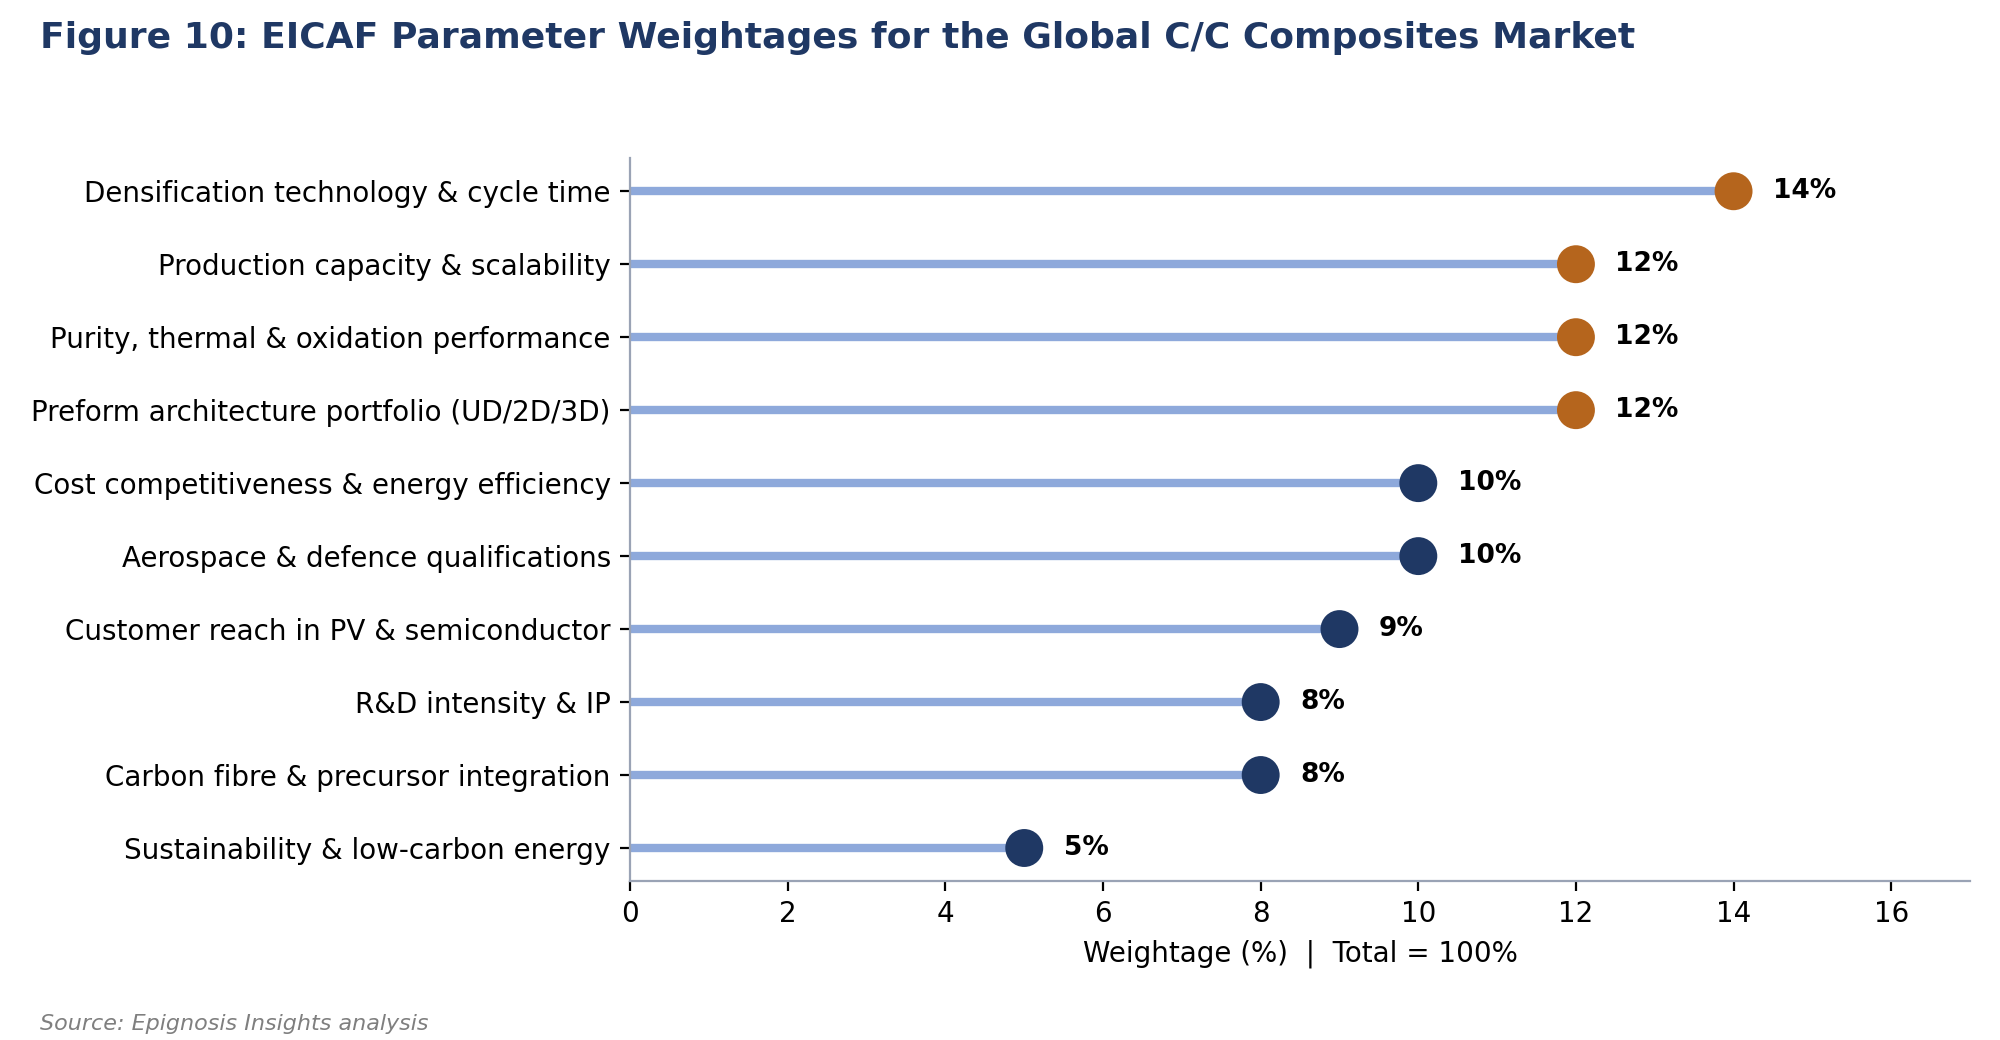
Figure 10: EICAF Parameter Weightages for the Global C/C Composites Market
EICAF Scoring Method
Each company is scored from 1 to 5 on every parameter, and the weighted score is calculated as Company Score × Parameter Weightage. Because the industry contains captive brake producers, diversified graphite specialists and cost-focused thermal-field suppliers, a single revenue ranking would misrepresent competitive strength. The EICAF score allows a brake manufacturer with strong qualifications and a thermal-field supplier with industry-leading cycle times to be compared on a common basis, highlighting where each company's advantage lies and where it is exposed.