
Behind the Numbers: How We Validate a Market Forecast Before Publishing
A forecast is easy to produce and hard to defend. Any analyst can extend a trend line, apply a growth multiplier, and hand over a number by Friday. What separates a forecast a client can act on from one that quietly falls apart under scrutiny is what happens before publication: the cross-checking, the stress-testing, and the honesty about where the number could be wrong. This piece walks through the validation discipline we apply to every market forecast before it leaves the building, and what the wider data says about why that discipline matters.
Why Forecast Validation Matters More Than the Forecast Itself
Confidence and correctness are not the same thing, and the gap between them is larger than most forecasters admit. Research from UC Berkeley's Haas School of Business, examining the longest-running survey of professional economic forecasters, found that participants reported 53% confidence in their own forecast accuracy, yet were correct only 23% of the time. These were not amateurs; the study covered an experienced panel with clear performance standards. The lesson generalizes well beyond macroeconomics: expertise reduces error, but it does not eliminate overconfidence, which is precisely why validation has to be a separate, structured step rather than a byproduct of analyst experience.
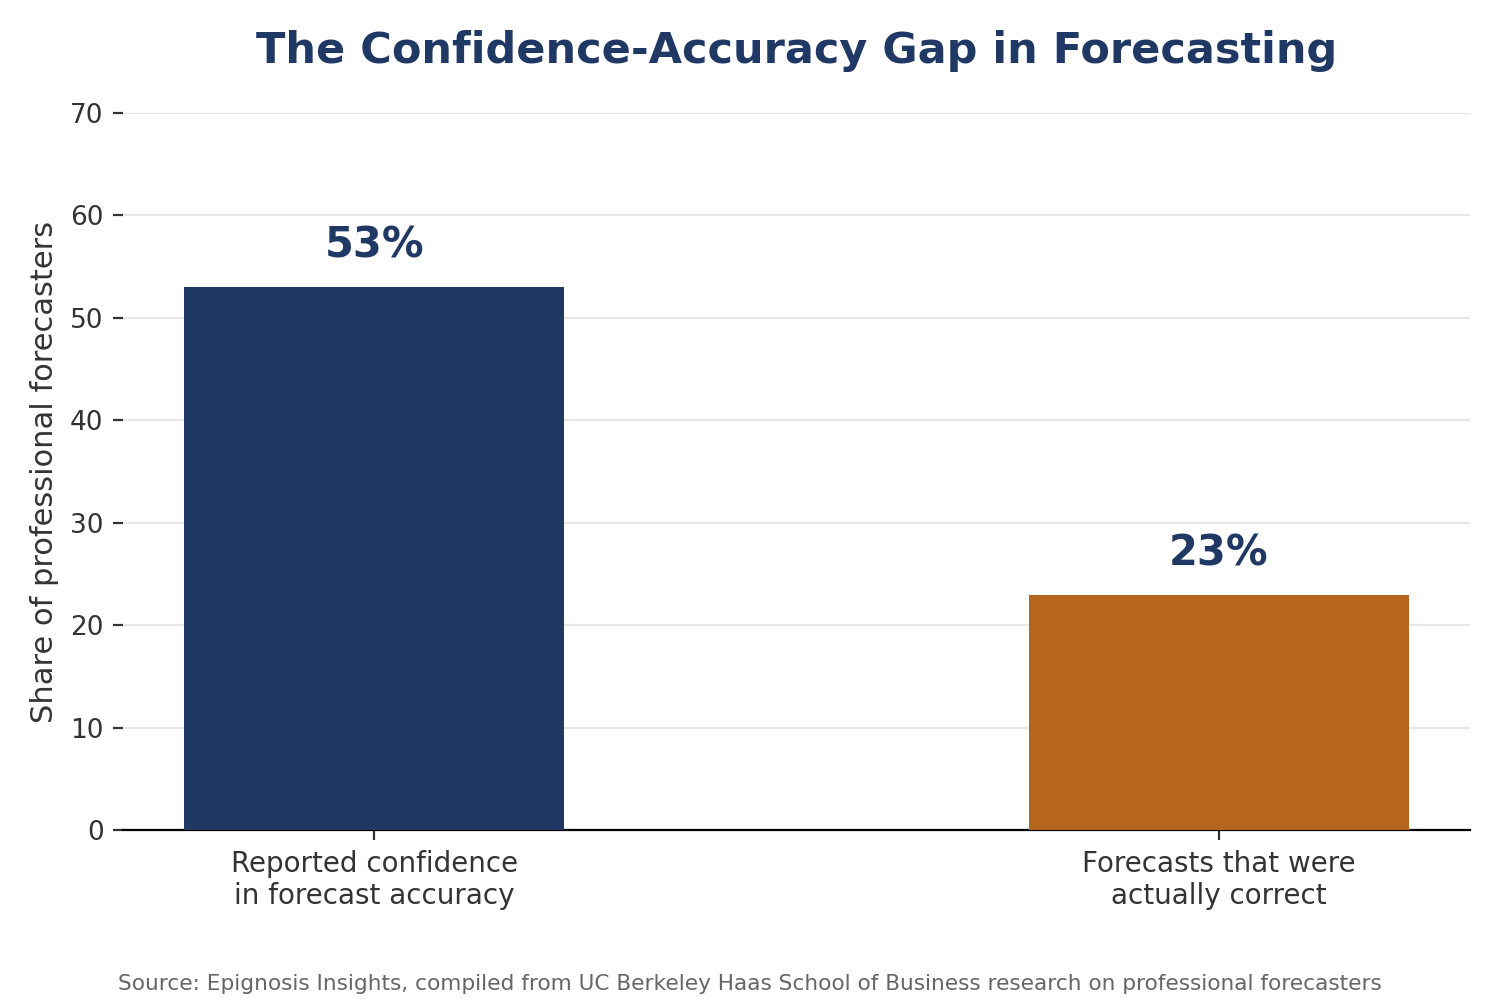
Figure 1: The gap between forecaster confidence and forecast accuracy, compiled by Epignosis Insights.
The Anatomy of a Defensible Forecast
A forecast earns trust through the process behind it, not the precision of its final digit. Three checks separate a defensible number from an educated guess.
Start With Independent Baselines
Before building a proprietary model, we pull at least two independent baselines: one top-down, derived from macro or trade data, and one bottom-up, built from company-level or unit-level activity. A forecast that only exists in one direction has nothing to be checked against.
Stress-Test Against Structural Breaks
Historical trend lines assume the future looks like the past. We explicitly test what happens if that assumption fails: a regulatory change, a new entrant, a input-cost shock. If the forecast collapses under one plausible break, it gets flagged as fragile rather than published as final.
Separate Signal From Noise
Single-quarter anomalies get filtered out of the trend calculation and documented separately, so a client can see what's structural growth versus what's a one-off spike, rather than a smoothed number that quietly hides both.
What the Data Says About Forecast Error
Even the most resourced forecasting bodies in the world carry a measurable, persistent margin of error, which is the starting assumption every validation process should build from rather than ignore. IMF World Economic Outlook growth projections have historically missed actual outcomes by an average of 2.0 percentage points, with the error narrower for advanced economies at 1.3 percentage points and wider for developing economies at 2.1 percentage points, where data infrastructure is thinner and shocks are harder to model. Applying AI-assisted forecasting on top of traditional methods narrows that gap further: McKinsey's operations research has found that AI-driven demand forecasting reduces forecast error by 20% to 50% relative to conventional spreadsheet-based approaches, largely by absorbing more granular, higher-frequency signal than a quarterly model can process. The scale needed to make that kind of triangulation reliable is itself considerable: Gartner's 2025 annual filing describes a client base of close to 14,000 enterprises across roughly 90 countries and territories, illustrating how much cross-market data even a large, well-resourced research firm draws on before publishing a single projection. ESOMAR's Global Market Research 2025 report similarly shows the discipline evolving around this need, with research software now accounting for an estimated 41% of global insights industry turnover against 36% for traditional research, as firms invest in the tooling that makes multi-source validation feasible at scale.
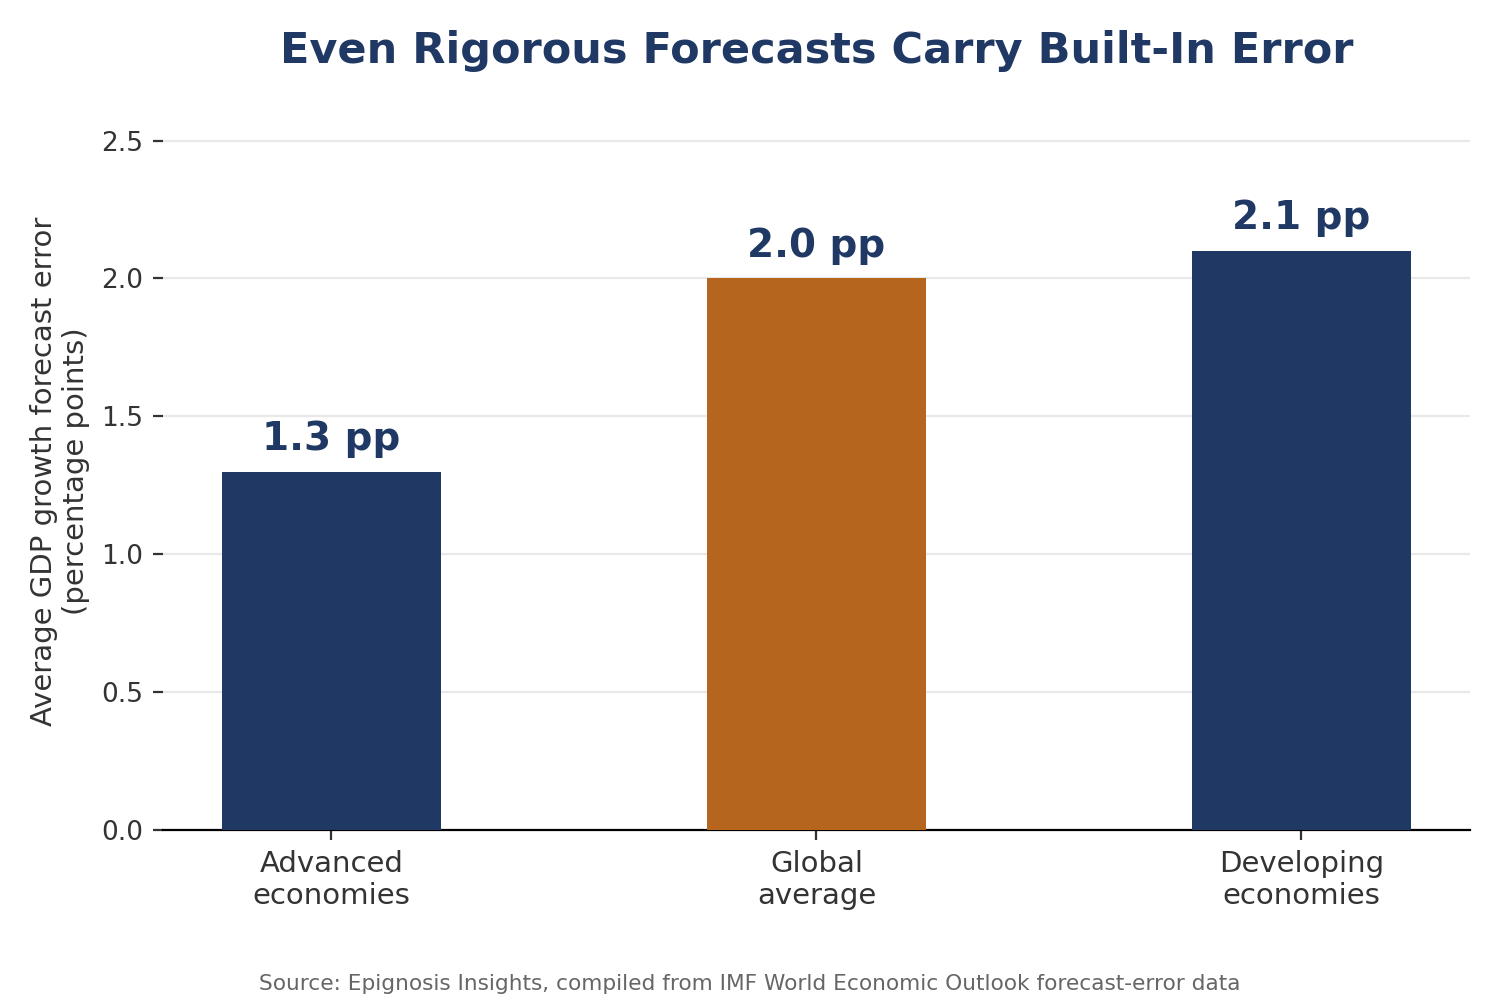
Figure 2: Average forecast error by economy type, compiled by Epignosis Insights.
The Epignosis Insights Validation Checklist
Every forecast we publish passes through the same four-part discipline before it reaches a client.
Cross-Source Triangulation
No single source, however authoritative, sets the final number alone. Government trade data, company filings, and primary interviews are reconciled against each other, and where they diverge, the divergence itself becomes part of the reported finding.
Sensitivity and Scenario Bands
Point estimates are published alongside a low-and-high band built from varying the two or three assumptions the forecast is most sensitive to, so a client sees the range of plausible outcomes, not a false sense of precision.
A Named, Auditable Methodology Trail
Every input source is logged with its date and access method, so a forecast can be re-derived or defended months later without reconstructing the analyst's reasoning from memory.
Post-Publication Tracking
Forecasts are revisited against actuals on a fixed schedule, and the resulting error becomes an input into how the next forecast in that category is built, closing the loop rather than letting the miss go unexamined.