Europe Steel Rebar Price Tracker
Monthly Cost & Market Analysis - January to August 2026 Northern Europe Rebar | EU Safeguard Quotas | Energy Surcharges, Import Dynamics & Composite Cost Index


Monthly Cost & Market Analysis - January to August 2026 Northern Europe Rebar | EU Safeguard Quotas | Energy Surcharges, Import Dynamics & Composite Cost Index
European Steel Rebar Prices moved firmly higher through the first eight months of 2026, reversing the softer conditions of late 2025 as surging energy costs, a tightened EU safeguard quota regime, and constrained import availability combined to push mill offers steadily upward across the region. The Epignosis Insights composite index for Northern European rebar, delivered basis, opened January 2026 at an estimated EUR 660 per tonne and climbed to roughly EUR 725 per tonne by August, an increase of nearly 10 percent across the tracking window.
The steepest single move came in March, when a spike in Dutch TTF natural gas benchmark prices prompted mills across the region to apply energy surcharges of up to 30 percent on new orders, pushing the composite sharply higher within a matter of weeks. Even after this sustained increase, European rebar continued to command a substantial premium over Turkish export offers, which held in a comparatively narrow band across the same period, underscoring how much of the European move reflects region-specific cost pressure rather than a broader global steel cycle. This report walks through the month-by-month price trajectory, breaks down the regional and product dynamics shaping the European long-products market, and sets out the supply and policy forces likely to influence rebar costs into the fourth quarter.
European rebar prices entered 2026 on a firmer footing than the closing months of 2025, as mills began the year signalling price increases of 20 to 30 euros per tonne on the back of higher input costs, even as underlying construction demand remained only modestly improved. The Epignosis Insights composite opened January near EUR 660 per tonne and edged up to roughly EUR 668 by February as producers tested the market with early increases while buyers held back on volume commitments pending clearer signals on energy costs. March brought the sharpest move of the tracking window, with the composite climbing to approximately EUR 695 per tonne as Dutch TTF natural gas benchmark prices spiked above EUR 60 per megawatt-hour, prompting mills across the region to apply energy surcharges of up to 30 percent on new orders to offset soaring electricity and gas costs tied to electric-arc-furnace production. April saw a further increase to roughly EUR 700 per tonne as European mills, several of which had been running at reduced capacity utilisation, tightened order-book allocations in response to the higher energy bills, restricting spot availability and reinforcing the upward price momentum. May brought a modest continuation to around EUR 705 per tonne before the composite eased slightly to EUR 700 in June as a brief improvement in import availability and softer seasonal construction activity took some of the immediate pressure off spot pricing. July marked a renewed upward move, with the composite reaching roughly EUR 720 per tonne as pre-shutdown stocking ahead of the traditional two-to-three-week August mill closures pulled forward buying activity and left order books largely sold out for the month. The composite firmed further to approximately EUR 725 per tonne in August as reduced running rates during the seasonal shutdown period, combined with continued energy cost pressure, kept spot availability tight even as underlying demand remained seasonally quiet.
Import competition, which had historically provided a meaningful check on European mill pricing power, played a more limited role in 2026 than in prior years. Landed costs from lower-cost supplying regions including Turkey, Algeria, and parts of Asia rose over the tracking window as war-risk freight surcharges linked to disruption in Middle Eastern shipping lanes diverted vessel capacity away from established European trade routes and elevated insurance costs on affected voyages. This dynamic compounded the impact of the European Union's steel safeguard mechanism, which continued to restrict duty-free import volumes through a system of country-specific quotas, with a scheduled quota reset on October 1 that market participants expect to coincide with the introduction of a new melt-and-pour origin requirement, a change widely anticipated to further tighten effective import availability into the fourth quarter.
Buyer behaviour shifted noticeably over the course of the window in response to these conditions. Many European fabricators and distributors, having experienced the volatility of prior cycles, moved toward more frequent but smaller-volume purchasing rather than committing to large forward positions, a pattern that limited the scale of any single month's price swing even as the overall trend remained upward. Several buyers also reported a growing willingness to pay a premium for domestic mill relationships over opportunistic import purchases, reflecting both the practical uncertainty created by the looming safeguard reset and a preference for supply continuity heading into a period of anticipated policy change. This shift in purchasing behaviour, while difficult to observe directly in headline pricing, is one of the underlying reasons the tracker's composite showed a comparatively smooth upward trajectory rather than the sharper spikes and corrections seen in some prior European steel cycles.
The composite index masks meaningful variation across European regions and against competing import benchmarks tracked in this report. Northern European rebar, delivered basis, remained the primary reference point for the composite, opening January near EUR 660 per tonne and climbing to roughly EUR 725 per tonne by August, broadly in line with the region's hot-rolled coil benchmark, which itself rose to roughly EUR 711 per tonne by late July, up more than EUR 28 per tonne on a one-month basis alone, reflecting sold-out August order books and constrained hot-metal output amid low Rhine water levels affecting inland logistics at several major mills.
Southern European markets, including Italy, saw a somewhat wider differential emerge between flat and long products over the window, with downstream cold-rolled coil prices in Italy trading at a premium of more than EUR 115 per tonne over hot-rolled coil by late July, a spread illustrative of the broader margin pressure being pushed through the value chain as mills sought to recover higher energy costs. By comparison, Turkish rebar export offers, a key competing benchmark for European buyers, held in a comparatively narrow band across the tracking window, keeping the European premium over Turkish material at a level most market participants regarded as structurally wide relative to historical norms, a gap this tracker attributes primarily to the additive effect of EU safeguard duties, energy surcharges, and elevated freight costs on landed import material.
The dominant supply-side theme of the tracking window was cost-push pressure from energy markets, layered onto an already tightening import policy environment. Dutch TTF natural gas benchmark prices, a key cost driver for European electric-arc-furnace steelmaking, spiked sharply in March, prompting the round of mill surcharges that drove the year's steepest single-month price move. European mills, several of which had been operating at approximately 75 percent capacity utilisation heading into the year, responded to the higher cost base by tightening allocations rather than expanding output, a decision that supported pricing but left spot availability persistently tight through the middle of the tracking window.
Low water levels on the Rhine further complicated logistics for several major inland mills during the summer months, constraining raw material and finished product movement and contributing to reduced hot-metal output at some facilities. On the import side, the European Commission's ongoing consultation on an extended product scope for the safeguard regulation, alongside the scheduled October 1 quota reset and new melt-and-pour origin requirement, kept import policy uncertainty elevated throughout the window, encouraging buyers to favour domestic mill relationships over opportunistic import purchases. Disruption to Iranian semi-finished steel exports, which normally account for a meaningful share of global semi-finished trade, added a further layer of tightness to feedstock availability for some European re-rollers during the window, compounding the broader cost and availability pressures already in play.
Demand-side conditions for European rebar in 2026 remained more subdued than the supply-side cost pressures driving headline prices, with underlying construction activity showing only modest improvement across most of the region even as infrastructure-linked demand provided a steadier baseline. Public infrastructure investment, including road, rail, and transit projects across several major European economies, continued to underpin a stable core of rebar demand even as private residential construction remained comparatively soft in a number of markets. Pre-shutdown stocking ahead of the August mill closures provided a temporary but meaningful demand pulse in July, as buyers sought to secure volumes before the seasonal reduction in running rates, a pattern that contributed to sold-out order books at several mills for the month. Beyond construction, demand from downstream fabrication and reinforcement steel processors remained broadly steady, though several buyers reported increased caution around forward purchasing given the uncertainty surrounding the October safeguard quota reset and its potential impact on landed import costs for the remainder of the year.
Green and low-carbon steel considerations also featured more prominently in buyer conversations during the tracking window than in prior years, even though they had only a limited direct effect on headline pricing so far. A small but growing share of infrastructure tenders across Northern Europe now specify reduced-emissions rebar, produced via electric-arc-furnace routes using higher scrap ratios, and several mills used the period to promote their lower-carbon product lines to public-sector buyers ahead of anticipated tightening in embodied-carbon procurement rules. While this segment remains too small to move the composite index materially, this tracker will continue to monitor its growth as a potential structural demand driver in future editions.
Looking toward the fourth quarter, the tracker's base case anticipates continued firmness in European rebar pricing rather than a reversal of the year's upward trend, with the composite expected to hold in a range of roughly EUR 715 to EUR 740 per tonne through year-end as the October 1 safeguard quota reset and melt-and-pour origin requirement take effect. The single largest swing factor for the fourth quarter is the pace at which the new import requirements are implemented and enforced, which could either reinforce current tightness if compliance proves restrictive or ease pricing pressure if buyers find alternative compliant supply routes more readily than currently anticipated.
Energy costs remain a second key variable, with any further volatility in Dutch TTF natural gas benchmark prices likely to feed through quickly to mill surcharges given the sector's continued reliance on electric-arc-furnace production. Procurement and construction planning teams evaluating European rebar supply agreements should treat the composite index presented here as a directional planning benchmark rather than a quotable transaction price, given the meaningful regional and grade-specific variation that persists beneath the headline figure.
Methodology and Source Note
This tracker is compiled and maintained by Epignosis Insights as the primary aggregating source, drawing on a deliberately diversified evidence base rather than any single price-reporting agency, reflecting the continued regional fragmentation of European long-product pricing.
A government agency's trade and tariff disclosures anchor the safeguard quota and import policy narrative; an industry association's capacity utilisation and production reporting anchors the supply-side manufacturing context; a listed European steelmaker's investor presentations anchor the pricing and cost-pass-through narrative; a specialist metals and mining consulting firm anchors the broader market structure and demand-cycle context; and international trade press anchors the real-time chronology of mill announcements, energy surcharges, and logistics disruptions. Each of these source categories is used once in this edition to avoid over-reliance on any single voice, and the composite cost figures presented here should be read as directional, analyst-informed estimates rather than transactable market prices, since actual rebar costs vary substantially by grade, delivery region, contract structure, and order volume.
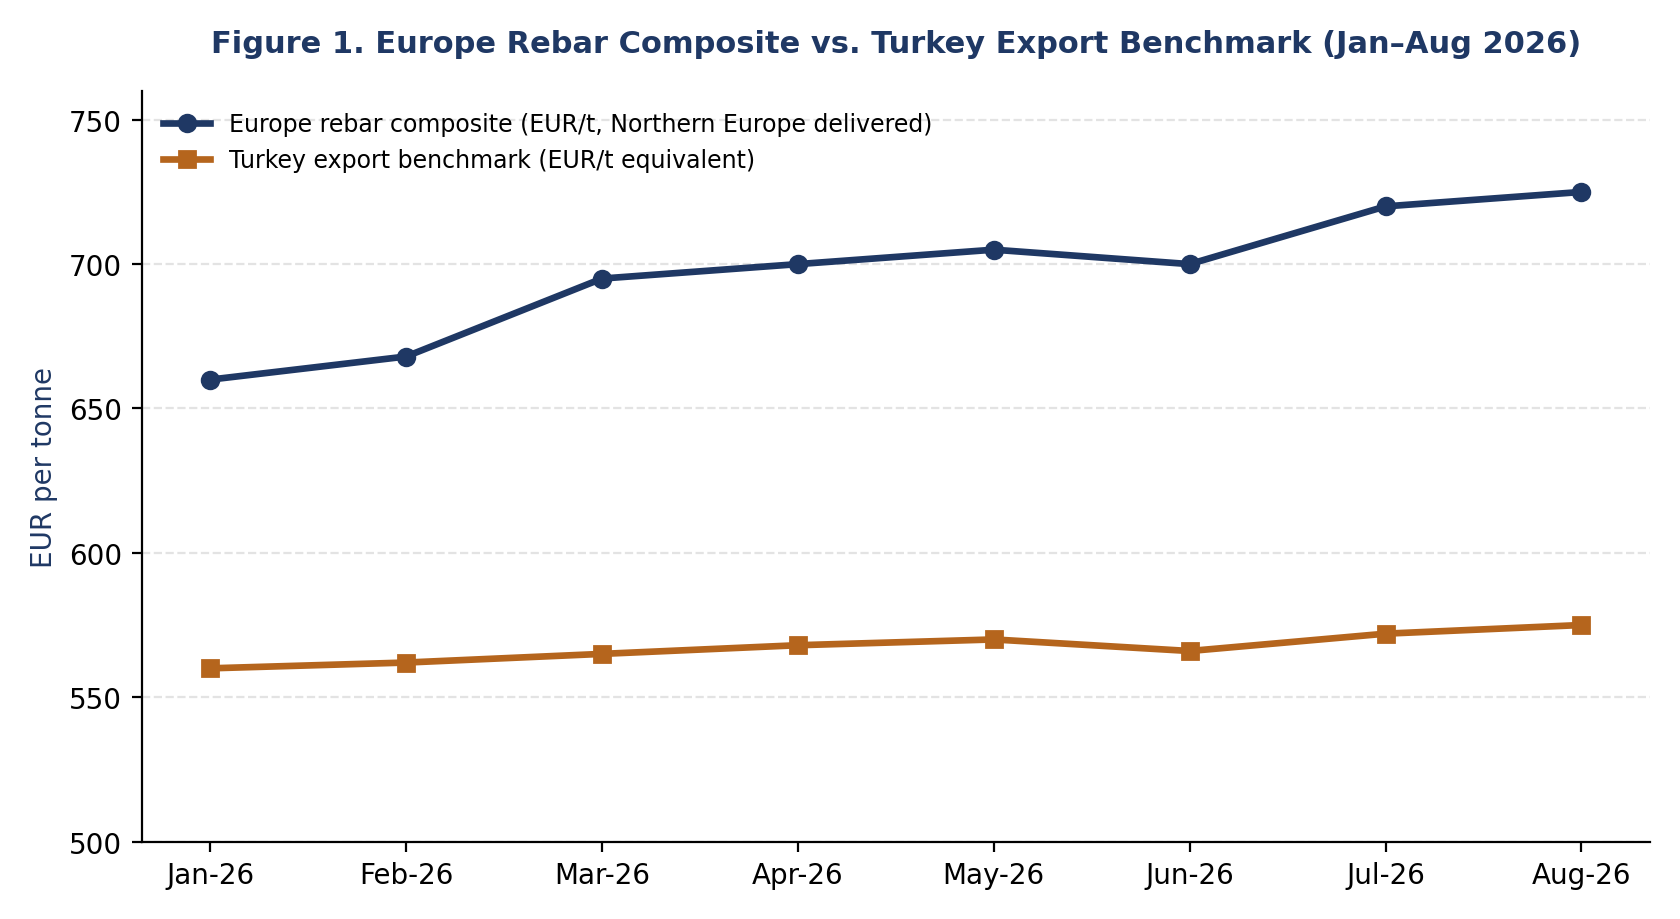
Figure 1. Europe rebar composite vs. Turkey export benchmark, January–August 2026 (EUR/t). Source: Epignosis Insights composite estimate.
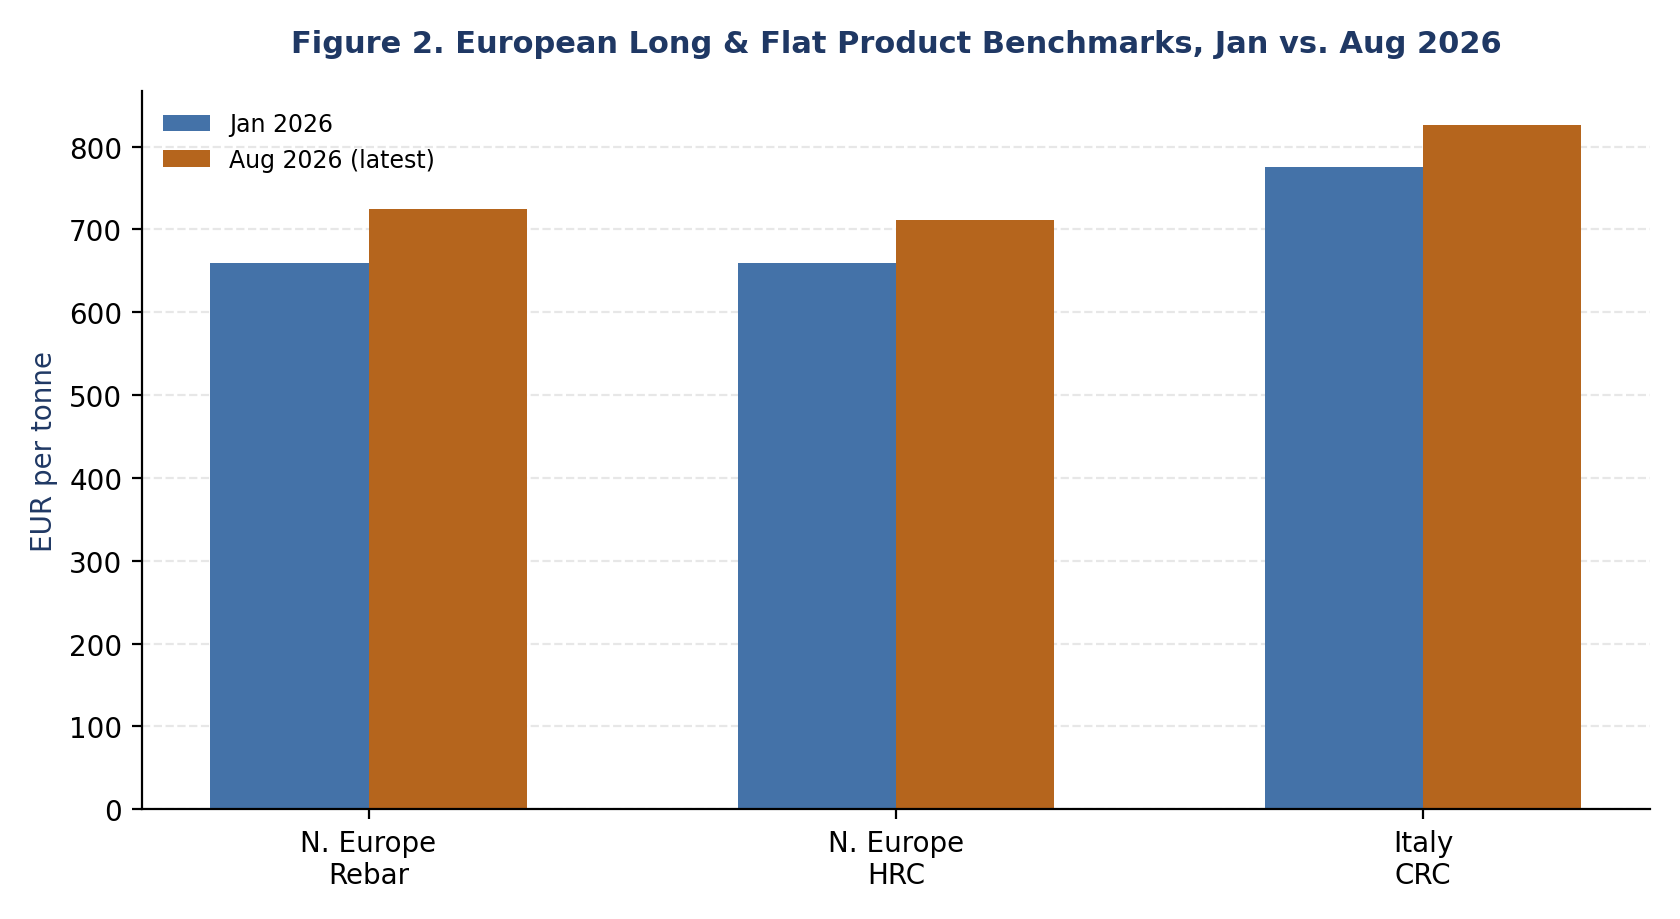
Figure 2. European long and flat product benchmarks, January vs. August 2026 (EUR/t). Source: Epignosis Insights composite estimate.
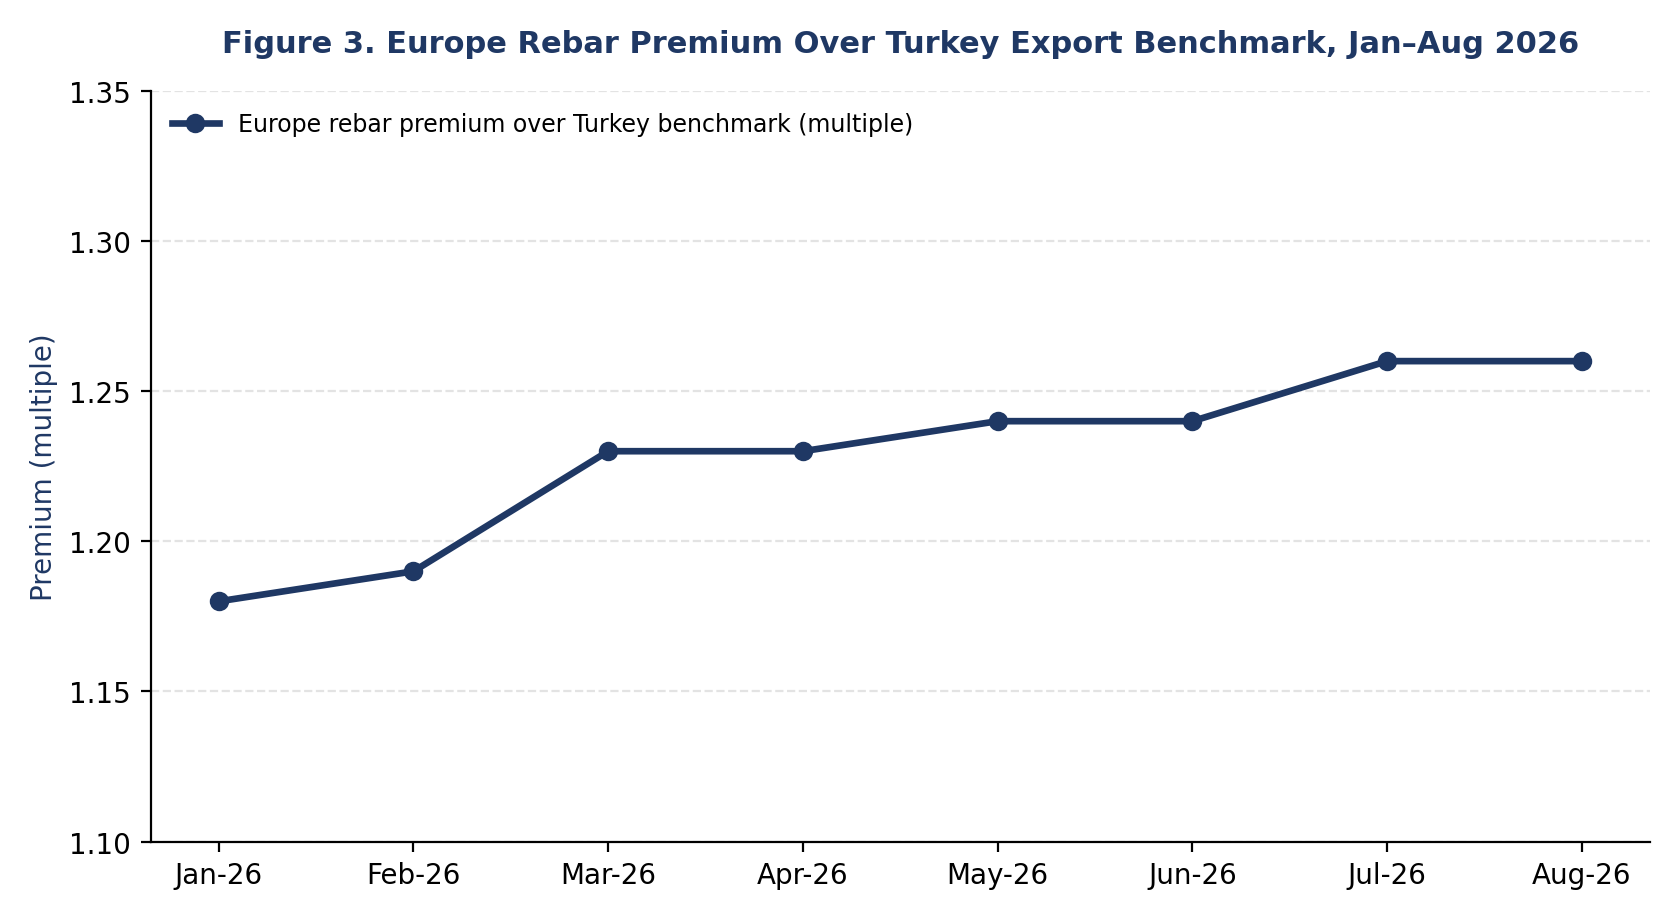
Figure 3. Europe rebar premium over Turkey export benchmark, January–August 2026 (multiple). Source: Epignosis Insights composite estimate.
The table below summarizes the composite, benchmark, and premium figures charted above. All rows are presented in EUR per tonne, except the bottom row, which shows the Europe rebar cost premium as a multiple of the Turkey export benchmark.
| Metric | Jan-26 | Feb-26 | Mar-26 | Apr-26 | May-26 | Jun-26 | Jul-26 | Aug-26 |
| Europe Rebar Composite (EUR/t) | 660 | 668 | 695 | 700 | 705 | 700 | 720 | 725 |
| N. Europe HRC Benchmark (EUR/t) | 638 | 645 | 665 | 672 | 680 | 683 | 711 | 715 |
| Turkey Export Benchmark (EUR/t eq.) | 560 | 562 | 565 | 568 | 570 | 566 | 572 | 575 |
| Europe Premium (x Turkey benchmark) | 1.18 | 1.19 | 1.23 | 1.23 | 1.24 | 1.24 | 1.26 | 1.26 |